Review
1
A review and scientometric analysis of global
2
Building Information Modelling (BIM) research in
3
the Architecture, Engineering and Construction
4
(AEC) industry
5
Ziwen Liu 1,2,*,Yujie Lu3,4 Lu Chang Peh 1
6
1 School of Science & Technology, Singapore University of Social Science, 463 Clementi Rd, Singapore
7
599494; [email protected]; [email protected]
8
2 Digitalisation Department, Built Environment Research and Innovation Institute (BERII), Building and
9
Construction Authority, Singapore 579700; [email protected]
10
3 Department of Building Engineering, College of Civil Engineering, Tongji University, China 200092
11
4 Key Laboratory of Performance Evolution and Control for Engineering Structures of Ministry of
12
Education, Tongji University, China 200092; [email protected]
13
* Correspondence: [email protected]; Tel.: +65-67304527
14
15
Abstract: In the recent decade, Building Information Modelling (BIM) has widely been adopted in
16
the Architecture, Engineering and Construction (AEC) industry and completely upended the way
17
we build. While BIM continues gain momentum in the industry, it has also attracted increasing
18
attentions from researchers. However, most of the current study focuses on reviewing BIM for
19
management, BIM for green building, BIM for infrastructure and BIM for Facilities Management
20
(FM). There are few studies about Global BIM review and to discuss their complex
inter-21
connections. In this study, we adopted a scientometric analysis method to review global BIM
22
research from 2004-2019. A total of 1455 scholarly bibliographic records obtained from Web of
23
Science Core Collection databased were established for the analysis. This study has identified the
24
top productive and influential researchers, research institutes, regions/countries, subject categories
25
and journals in the BIM field. In addition, 11 clusters of Global BIM research were also identified
26
including construction project, green BIM, construction safety planning, automated IFC-based
27
workflow and so on. Authors distinguished 11 clusters of global BIM research into 3 stages, namely
28
formulating stage, accelerating stage and transforming stage. Furthermore, authors reviewed the
29
BIM policy of Singapore and observed there is a co-production relationship between evolution of
30
BIM policy and global BIM research. These findings provide valuable information for researchers,
31
practitioners and policy makers by visualizing the current progress in the research field of BIM and
32
highlighting future research needs.
33
Keywords: Building information modelling; Co-citation network; Literature Review; Research
34
visualization; Scientometrics.
35
36
1. Introduction
37
The Architecture, Engineering and Construction (AEC) industry are undergoing a significant
38
shift from traditional labour-intensive methods to automation through the use of information
39
technology, Building Information Modelling (BIM) has played a crucial role in this transformation[1,
40
2]. The United States National Institute of Building Sciences (NIBS) gives the most authoritative
41
definition: "A BIM is a digital representation of physical and functional characteristics of a facility.
42
As such it serves as a shared knowledge resource for information about a facility forming a reliable
43
basis for decisions during its lifecycle from inception onward [3] ."
44
Literature review refers to a kind of academic paper which is written by making a
45
comprehensive analysis for a large amount of collected information data on a certain topic. As a type
46
of scientific literature, literature review is considered a stopgap for in-depth understanding of the
47
research fields [4]. Through the systemizing of existing researches, the fronts and trends of current
48
researches can be found, so as to provide strong support and argumentation for the establishment of
49
new research topics in the future.
50
Most of previous researches focused on the research literature review of BIM and other fields,
51
such as managerial areas of BIM [4], BIM for Green Buildings[5], BIM for infrastructure[6], BIM for
52
Facilities Management [7]. To illustrate, Qinghua He et al. [4] reviewed 126 peer-reviewed journal
53
paper on managerial areas of BIM (BIM-MA) and proposed an integrated conceptual framework to
54
summarize current and future research of managerial BIM. Y Lu et al. [5] conducted a comprehensive
55
and critical reflection on the relationship between BIM and Green Building and explained it
56
systematically using the classification of "Green BIM Triangle" taxonomy through an in-depth review
57
of hundreds of journal articles published from 1999 to 2016 and 12 kinds of BIM software widely used
58
in AEC industry. Alex Braddly et. al [6] presented a review of 250 key publications in the area of BIM
59
for infrastructure and analyses the trends for BIM development for infrastructure according to
60
publication year, publication origin, project phase and publication scope. Mustafa Hilal et.al [7]
61
adopted scientometric approach using science mapping techniques to examine BIM-FM articles using
62
Web of Science (WOS) database for the period between 2000 and April, 2018.
63
There have only a few studies on regional and global BIM review. Among the handful, Saka and
64
Chan[8] presented a scientometric review and metasynthesis of BIM development in the African AEC
65
industry. They found a varying level of BIM growth in the African continent, with North Africa, West
66
Africa, and Southern Africa leading the research development, while the other regions, namely the
67
East Africa and Central Africa are lagging behind. In addition, the authors identified the major
68
challenges encountered in BIM adoption are people/process-related barriers. X Zhao[9] conducted a
69
scientometric review of scientific literature relating to BIM in 2005-2016, and identified the top
hot-70
spots of BIM research, such as: mobile and cloud computing, laser scan, augmented reality, semantic
71
web technology, automated generation, safety rule and code checking. In comparison, this study
72
involved a higher corpus of papers (1455 articles). Moreover, compared with X Zhao[9]’s 12-year
73
span of review, this span of review for this study is 16 years. In addition, no previous review focus
74
on venation of BIM development, this study distinguished 11 clusters of global BIM research into 3
75
stages, namely formulating stage, accelerating stage and transforming stage. In addition, authors
76
reviewed the BIM policy of Singapore and observed there is a co-production relationship between
77
evolution of BIM policy and global BIM research.
78
79
80
81
82
This research adopts a quantitative and qualitative analysis method to analyze 1455 journal
83
articles related to BIM published from 2004-2019. In the quantitative analysis, distribution of BIMs
84
publication was analyzed by with times, authors, countries, research institute, subject categories and
85
published journal. In the qualitative analysis, 1455 bibliometric record was imported into
86
scientometric toolkit for visualization analysis, co-authorship network, network of countries/regions
87
and institutions, network of co-occurring subject categories, network of co-occurring keywords,
journal co-citation network, author co-citation network and document co-citation network. In
89
addition, co-citation clusters were identified and conducted critical review for the top three
90
documents in each cluster.
91
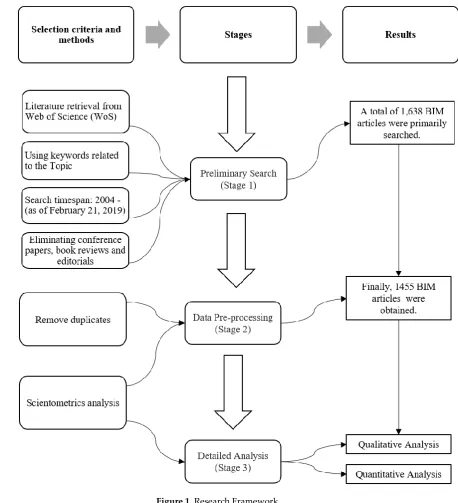
2. Research Method
92
The research framework includes defining literature database and search rules, conducting
93
preliminary retrieval, data processing and analysis, as illustrated in Figure. 1. The paper selection
94
process in this study was referred to the methods used in other review articles, such as [6, 8, 13].
95
96
Figure 1. Research Framework
97
2.1. Preliminary Search
98
The research boundary have been defined by following the rules below. Firstly, the research data
99
is obtained from Web of Science (WoS) Core Collection. For scientific text data, all literature
100
information except the main body is included in the index database. The WoS, an authoritative
101
database in the research field, is selected for literature search. The data structure of WoS is relatively
complete, including literature types, authors, journals, keywords, abstracts, institutes and references.
103
Engineering, architecture and information construction are also fully included in the database which
104
also contains major journals and conference papers. More than 18,000 influencing journals around
105
the world are covered by WoS, including open journals and more than 180,000 pieces of conference
106
proceedings, and over 80,000 books from around the world[10]. Information obtained from WoS is
107
considered sufficient for this study.
108
Secondly, the initial search takes the topics as follows: “Building information modelling”,
109
“Building information modeling” or “Building information model”, “” representing precise phrase
110
search. Taking into account articles comprehensively covering BIM and the avoidance of target
111
literature omission, the time span was set from 2004 to 2019. The first journal article [11] on BIM was
112
published in 2004, so the year 2004 was set as an the initial year. The retrieval was conducted on
113
February 21, 2019. In January 2004, John Haymaker et al. [11] firstly proposed “building information
114
modeling” in keywords of a paper and formalized a reusable reasoning module called “Perspectors”
115
which can automatically construct a task-specific engineering view known as “Perspectives” by
116
engineers. The method has been verified by a real project.
117
118
Thirdly, only English articles and reviews are selected. To ensure the comprehensiveness and
119
reliability of the results of literature review, the literature referred to is limited to journals, excluding
120
book reviews, letters, news reports and conference abstracts. This is because journal papers usually
121
peer-reviewed, and can be considered to provide more comprehensive, robust and superior quality
122
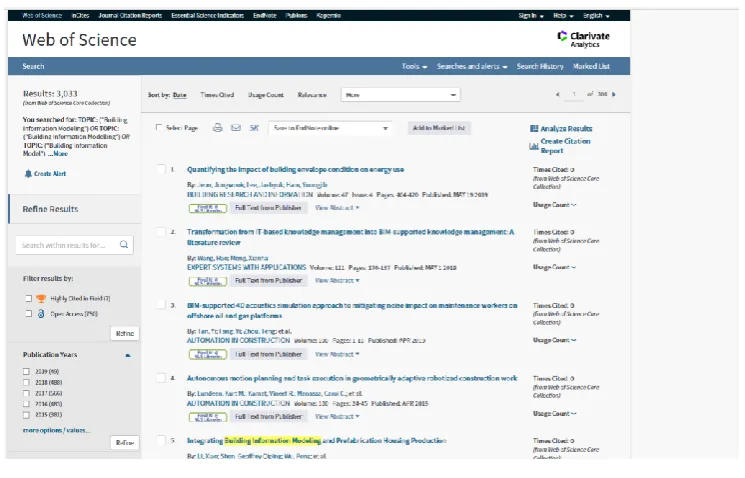
of information than other types of publications. A total of 3,033 articles on BIM were retrieved for the
123
first time, with the database interface shown in Figure. 2.
124
125
Figure 2. Article retrieved
126
Through refining and duplicate checking, 1,455 articles on BIM were obtained. The specific data
127
collection process is shown in Table 1.
128
129
Table 1. Articles retrieved at different stages
130
Web of Science
Topics: “Building information modelling”
Or “Building information modeling”
Or “Building information model”
Database: Web of Science Core Collection
Timespan: 2004 to 21Feb 2019
3033
Languages: English 2943
Exclude conference articles 2272
Document Types: Article + Review 1638
Remove duplicates 1455
131
132
133
134
2.2. Data pre-processing
135
Before performing detailed analysis, data filtering and duplicate removal for WoS format of data
136
should be carried out. It can help to remove redundant data and could be used for removing identical
137
or similar files with the same content [12]. As shown in Figure.3, a total of 1,455 valid BIM articles
138
were obtained after data pre-processing.
139
140
2.3. Research toolkits
141
Common scientometrics toolkits are CiteSpace[13], Science of Science (Sci2) Tool[14],
142
BibExcel[15]. These toolkits can help scholars to quickly and effectively perform visualized
143
information analysis. CiteSpace is an open-sourced tool-kit which can be freely downloaded. It is
144
mostly used to detect, analyze, and visualize patterns and trends in scientific literature[16]. Its
145
primary goal is to facilitate the analysis of emerging trends in knowledge domain. Featuring perfect
146
functions, CiteSpace is characterized by spectral clustering and citation burst[16]. It emphasizes on
147
identifying critical points-in-time in the development of a field or a domain, in particular, intellectual
148
turning points and pivotal points of research [17].In the whole process of constructing knowledge
149
maps, the processing of each step by CiteSpace is reasonable, with the highlight of core items.
150
Therefore, CiteSpace is used to analyze literature in this study.
151
2.4. Parameters setting
152
The time span settings were from 2004 to 2019 for BIM bibliographic records. Each year was
153
selected as a time slice and 16-time segments were obtained. The Cosine algorithm was selected for
154
the correlation strength of network nodes. The threshold of time slice was set to 50, that is to say, the
155
first 50 (Top 50) were extracted. Finally, redundant links was removed by Pathfinder in network
156
pruning, which was recommended by Chen and Morris[18]. Moreover, the corresponding node types
157
were selected, and the corresponding scientific knowledge map was drawn according to the research
158
needs.
159
3. Statistical overview
This section aims to conduct a quantitative analysis for 1455 BIM bibliometrics record. The
161
development status of BIM research field can be reflected by the diachronic change trend of the
162
amount of publications in this field. In order to understand the research achievements of BIM in the
163
last decade, statistics of distribution of BIMs publication were analyzed by their publishing times,
164
authors, countries, research institute, subject categories and published journal.
165
3.1. Distribution of BIM publications with times
166
A total of 1,455 BIM publications collected from the WoS database are shown in Figure. 3,
167
temporal distribution of which is recorded. It can be found that the volume of research documents
168
related to BIM has been on a rise since 2008, with a sharp increase especially since 2012. BIM is
169
receiving extensive attention and ushering in the upsurge of development in the world. As shown in
170
Figure.3, published articles in the BIM field have been greatly increased since 2008. A total of 708
171
BIM papers were published in the last three years (from 2016 to 2018), accounting for approximately
172
half of the literature in this study.
173
Seen from Figure. 3, the development of BIM research has continued since the beginning of the 20th
174
century. In January 2004, John Haymaker et al. [11] firstly proposed “building information modeling”
175
in keywords of a paper. In 2005, Kenny TC et al. [19] tried to explore other dimensions of BIM. Low
176
frequency of BIM usage was mentioned in the paper. Traditional entity-based CAD software was still
177
taken as the actual drawing tool. Core obstacles include the difference between architectural design
178
and drafting, inadequate objects and object customization capability, the complex and
time-179
consuming modeling process, lack of training and technical support, lack of customer requirements,
180
additional file acquisition costs and incapability of obtaining free trial software. In addition, the
181
separation of design and drafting has become a common practice, which may be the most prominent
182
obstacle to the widespread use of BIM and the nD modeling in the future.
183
184
185
Figure.3: Distribution of BIM publications with times
186
187
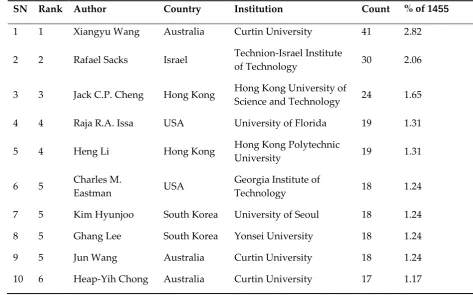
3.2. Distribution of published papers with authors
188
According to literature retrieved from WoS, the top 10 most productive BIM authors were
189
identified, as shown in Table 2. Xianyu Wang from Curtin University, Australia, tied for the first
190
place with 41 BIM publications, followed by Rafael Sacks from Israel Polytechnic University and Jack
191
C. P. Cheng. Among the top 10 productive authors, three come from Curtin University of Australia,
192
two from Hong Kong Universities, and another two from the University of Seoul and Yonsei
193
University, South Korea.
194
3 3 8 12 9 25
37 55 69
111 163
205 225 210 273
47
0 50 100 150 200 250 300
2004 2005 2006 2007 2008 2009 2010 2011 2012 2013 2014 2015 2016 2017 2018 2019
N
o
o
f
Pub
lic
ati
o
n
s
195
Table 2. Top 10 productive BIM article authors
196
SN Rank Author Country Institution Count % of 1455
1 1 Xiangyu Wang Australia Curtin University 41 2.82
2 2 Rafael Sacks Israel Technion-Israel Institute
of Technology 30 2.06
3 3 Jack C.P. Cheng Hong Kong Hong Kong University of
Science and Technology 24 1.65
4 4 Raja R.A. Issa USA University of Florida 19 1.31
5 4 Heng Li Hong Kong Hong Kong Polytechnic
University 19 1.31
6 5 Charles M.
Eastman USA
Georgia Institute of
Technology 18 1.24
7 5 Kim Hyunjoo South Korea University of Seoul 18 1.24
8 5 Ghang Lee South Korea Yonsei University 18 1.24
9 5 Jun Wang Australia Curtin University 18 1.24
10 6 Heap-Yih Chong Australia Curtin University 17 1.17
197
Seen from the number of publications in countries where the top ten authors are located, the top
198
three countries are Australia (76 publications), Hong Kong (43 publications) and South Korea (36
199
publications). It is also worth mentioning that the volume of publications by top 10 productive
200
authors accounts for approximately 15% of the total.
201
3.3. Distribution of published literature with countries/regions
202
The information of countries/regions in articles can be obtained from the published
203
bibliographic records, so as to determine the main countries/regions of the publications. According
204
to the records in WoS, a total of 1,455 BIM articles were published in 75 countries/regions. Top 10
205
productive countries/regions are shown in Table 3.
206
207
Table 3. Top 10 productive BIM articles countries/regions
208
SN Country/Region Count % of 1455
1 USA 341 23.44
2 China 224 15.40
3 England 194 13.33
4 Australia 152 10.45
5 South Korea 151 10.38
7 Canada 60 4.12
8 Taiwan 55 3.78
9 Italy 41 2.82
10 Malaysia 36 2.47
11 Netherlands 36 2.47
With regard to the contribution of the total volume of BIM documents, publications in the top
209
10 countries accounted for approximately 93% of the total volume of BIM documents. The top three
210
countries, namely, the United States, China and the United Kingdom contributed 341, 224 and 194
211
papers respectively, accounting for more than half of the total volume. In four Asian
212
countries/regions among the top 10, including China, South Korea, Taiwan and Malaysia, they
213
accounted for approximately 30 percent of the total publications. In European countries, there were
214
194 publications in England, 70 publications in Germany and 41 publications in Italy, accounting for
215
about 20 percent of the total publications. In North American countries, 341 were published in the
216
United States and 60 were in Canada, taking up approximately 27 percent of the total publications.
217
In Oceania, Australia contributed more than 10 percent of the total.
218
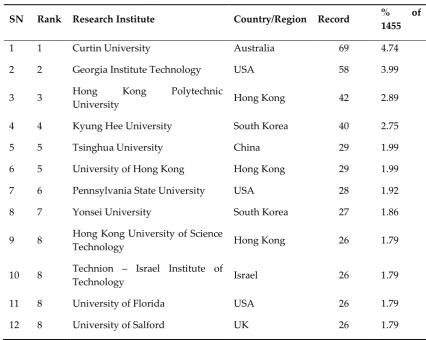
3.4. distribution of published documents with research institutes
219
Information of research institutes in publications can be obtained from bibliographic records as
220
well, so as to determine the main research institutes of the publications. According to records in WoS,
221
a total of 1,128 research institutes have published 1,455 BIM articles. The top 10 productive institutes
222
are shown in Table 4.
223
224
Table 4. Top 10 productive research institutes
225
SN Rank Research Institute Country/Region Record % of
1455
1 1 Curtin University Australia 69 4.74
2 2 Georgia Institute Technology USA 58 3.99
3 3 Hong Kong Polytechnic
University Hong Kong 42 2.89
4 4 Kyung Hee University South Korea 40 2.75
5 5 Tsinghua University China 29 1.99
6 5 University of Hong Kong Hong Kong 29 1.99
7 6 Pennsylvania State University USA 28 1.92
8 7 Yonsei University South Korea 27 1.86
9 8 Hong Kong University of Science
Technology Hong Kong 26 1.79
10 8 Technion – Israel Institute of
Technology Israel 26 1.79
11 8 University of Florida USA 26 1.79
In terms of the contribution of the total volume of BIM literature, the top 10 research institutes
226
accounted for nearly 30 percent of the total volume of published BIM documents. The top three
227
research institutes were Curtin University, Georgia Institute Technology and Hong Kong Polytechnic
228
University Regionally, there were 3 Hong Kong research institutes among the top 10 The total
229
contribution of Hong Kong was 97, accounting for 23% and 7% of the top 10 literature volume and
230
the total volume, respectively. There were also 3 USA research institutes, Georgia Institute
231
Technology, Pennsylvania State University and University of Florida. In addition, among the top 10
232
research institutes, Asian research institutes contributed 193 publications, taking up 45% and 13% of
233
the top 10 literature volume and the total volume, respectively.
234
235
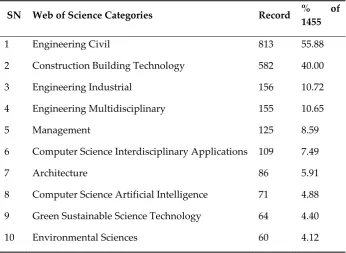
3.5. distribution of published documents with subject categories
236
A total of 1,544 BIM bibliographic records loaded from WoS were allocated to 86 WoS categories.
237
The top 10 productive research institutes are shown in Figure.5. The top 3 categories were
238
Engineering Civil with 813 publications, Construction Building Technology and Engineering
239
Industry with 582 and 156 publications, respectively. Each of them accounted for 56%, 40% and 11%
240
of the total volume of publications.
241
242
Table 5. Top 10 productive WoS subject categories
243
SN Web of Science Categories Record % of
1455
1 Engineering Civil 813 55.88
2 Construction Building Technology 582 40.00
3 Engineering Industrial 156 10.72
4 Engineering Multidisciplinary 155 10.65
5 Management 125 8.59
6 Computer Science Interdisciplinary Applications 109 7.49
7 Architecture 86 5.91
8 Computer Science Artificial Intelligence 71 4.88
9 Green Sustainable Science Technology 64 4.40
10 Environmental Sciences 60 4.12
3.6. distribution of published documents with journals
244
According to statistical data obtained from WoS core collection database, the top 10 Journals of
245
BIM research were determined. BIM literature publications are shown in Table.6. There were 294
246
papers published on Automation in Construction, occupying the first place in BIM research, followed
247
by the Journal of Information Technology in construction with 96 papers and the Journal of
248
Computing in Civil Engineering with 64 papers. Among these 10 journals, 4 were published in the
249
USA and 3 were published in the UK.
250
Table.6. Top 10 Journals for BIM research in 2004-2019
SN Source Title Host
country Count
% of
1455
1 Automation in construction Netherlands 294 20.21
2 Journal of information technology in construction Sweden 96 6.60
3 Journal of computing in civil engineering USA 64 4.40
4 Journal of construction engineering and management USA 61 4.19
5 Advanced engineering informatics UK 54 3.71
6 Journal of management in engineering USA 34 2.34
7 Architectural engineering and design management UK 30 2.06
8 Engineering construction and architectural management UK 29 1.99
9 Journal of civil engineering and management Lithuania 25 1.72
10 Buildings USA 24 1.65
4. The results of scientometric analysis
252
4.1 Co-author analysis
253
The information on the authors, research institutions and countries/regions can be obtained from
254
bibliographic records, so as to determine the leading researchers, institutions, and countries/regions
255
of BIM research [20]. Thereafter, a co-authorship network, as well as a network of co-authors’
256
institutions and countries/regions, was generated.
257
4.1.1 Co-authorship network
258
The co-authorship network is shown in Figure.4. Each node represents an author, and links
259
between the authors represent the collaboration established through co-authors in the article. The
260
node size represents the number of publications, and the thickness of the links represents the level of
261
the partnership in a specified year. Colors of the lines such as blue, green, yellow, orange and red
262
correspond to different years from 2004 to 2019. The bibliographic records of 1,455 BIM documents
263
were analyzed with CiteSpace. There were 312 nodes and 336 links for the co-authorship network.
264
As shown in Figure.4, there are multiple closed-loop circuits in the research of collaboration,
265
indicating that researchers in these closed-loop circuits have established strong collaboration. For
266
example, the closed-loop circuit of Rafael Sacks, Yeon-Suk Jeong and Charles M. Eastman implied
267
strong cooperation by these authors in 2008 and 2009. Jochen Teizer and Markus König established
268
strong cooperation in 2019. In addition, several research communities, including multiple authors
269
and one or two productive authors, were identified after the co-authorship network analysis. For
270
example, Xiangyu Wang and Jun Wang are two core authors of a research group which also includes
271
Martijn Truijens, Yi Jiao and Shih-Chung Kang. Inhan Kim is the main author of a research group
272
composed of Shen zhenghua, Jungho Yu etc. There is also a research community in recent years, such
273
as Liang Ma, Poorang Piroozfar and Ruoyu Jin.
274
276
Figure.4: Distribution of BIM publications with times
277
278
The following two important indicators are usually used to measure the importance of authors,
279
articles, research institutes and countries/regions:
280
Betweenness centrality (noted with purple rings)
281
In the graph theory, the centrality of nodes is the theoretical property of a graph, which
282
quantifies the position importance of nodes in the network. A commonly used centrality measure is
283
betweenness centrality which is an index measuring the importance of nodes in the network. It is
284
defined as the ratio of the shortest path between two nodes to the sum of all these shortest paths.
285
Nodes with high betweenness centrality usually connect two or more large groups of nodes to each
286
node. This index is used to discover and measure the importance of literature in CiteSpace, and a
287
purple highlighted ring is used to highlight this kind of literature (or authors, periodicals and
288
research institutes, etc.). Clusters in the network can be easily separated and influencing and
289
revolutionary scientific publications can be identified by these nodes. In Figure.6, purple rings are
290
used for nodes of Xiangyu Wang (centrality = 0.18), Jack C.P. Cheng (centrality = 0.13), Jun Wang
291
(centrality = 0.12), Peter Love (centrality = 0.12) and other several authors, and they connect different
292
groups of authors.
293
Citation burst detection (noted in red)
294
Citation burst detection is an important index for studying the most active field. One of
295
CiteSpace's breakthroughs is to provide a burst item analysis method based on the word frequency
296
growth algorithm, which detects rapidly growing specialized words in a short period of time by
297
counting citation keywords. The characteristics of temporal distribution and dynamic variability of
298
the burst items can better reflect the research fronts and development trend in the knowledge domain.
299
Citation burst detection is used for emergencies, which can last for a year or several years. Citation
300
burst detection can be used as an evidence to show that a particular publication is heavily cited at a
certain time. In other words, the publication has attracted great attention from the scientific
302
community in that period of time. Burst detection in CiteSpace is based on Kleinberg algorithm. As
303
shown in Figure 2.9, the four authors received citation bursts of different intensities by red notes.
304
According to the burst strength, the rank was Sacks R (strength = 6.09, 2009-2013), Eastman CM
305
(strength = 3.82, 2009-2012), Jeong YS (strength = 3.32, 2009-2010) and Lee G (strength = 3.13,
2012-306
2014)
307
4.1.2 Network of countries/regions
308
In order to understand the research status in the field of BIM in the world, a network of
309
countries/regions was generated. There are 51 nodes and 113 links in the network. In Figure.5, the
310
size of nodes represents the appearance frequency of the country in which the author is located in.
311
The larger the circle is, the higher appearance frequency of authors in the country is. The color of the
312
rings represents the authors’ literature publication time in the corresponding country, and the wider
313
the single ring is, the higher appearance frequency of authors in the country is within a certain time
314
period.
315
316
317
Figure.5:Network of countries/regions
318
As shown clearly in Figure.5, the circle area of the USA is the largest in the field of BIM research
319
with absolute advantages. It shows that the United States has strong research strength and influence
320
in the field of BIM. China ranks the second, suggesting the moderate BIM research power of the
321
country. The United Kingdom ranks the third, South Korea ranks the fourth and Australia ranks the
fifth with the frequency 156. It indicates that progress has been achieved in these countries on BIM
323
research. It can also be seen that European and Asian countries attach great importance to the
324
development of BIM, and that they actively carry out relevant researches in the field of BIM.
325
In addition, in the area of international cooperation, Canadian researchers have cooperated
326
extensively with researchers from Australia, South Korea, Finland and other countries. The U.K.,
327
New Zealand and Germany are connected by relatively thick golden/red lines, indicating a strong
328
partnership between these countries in 2018 and 2019.
329
Furthermore, nodes with high betweenness centrality have been identified with purple outer
330
rings. As shown in Figure.5, the representative countries/regions include New Zealand (centrality =
331
1.25), the United Kingdom (centrality = 0.84), Malaysia (centrality = 0.68), Canada (centrality = 0.64)
332
and Israel (centrality = 0.63). These countries with nodes of high betweenness centrality play an
333
important role in BIM research.
334
As for citation burst detection, the following 5 countries received citation bursts with different
335
strengths at different times. Ranking according to the burst strength, the sequencing is as follows: the
336
United States (strength = 10.49, 2004-2012), Israel (strength = 5.31, 2009-2010), Germany (strength =
337
4.01, 2009-2011), Italy (Strength = 3.65, 2017-2019), and Finland (strength = 3.26, 2009-2015).
338
339
4.1.2 Network of research institutes
340
Other than the distribution network of countries/regions, the network of the research institutes
341
in the field of BIM were established as well. It includes 195 nodes and 240 links in total, as shown in
342
Figure.7.
343
344
Figure.6: Network of research institutes
345
It can be found in Figure.6 that the frequency (Circle) of Curtin University is the highest. It has
347
published the most articles in the field of BIM with absolutely high research strength, followed by
348
Georgia Institute of Technology in the USA, Kyung Hee University in South Korea and Hong Kong
349
Polytechnic University in Hong Kong. It is implicates that the four institutions have strong research
350
potential in BIM. It is observed that half of the top 10 research institutes are located in Asia, which
351
can be seen merely from the volume of publications. In recent years, BIM has been widely concerned
352
and actively studied in Asia.
353
Additionally, the cooperation between different institutes is explored, as shown in Figure.6. The
354
node is the name of the research institutes. The connection between nodes is used to describe the
355
collaboration strength of different research institutes. The color of the connection indicates the time
356
of the first collaboration of the node. The thickness of the connection indicates the collaboration times
357
between the institutes. The thinner the lines are, the fewer times of cooperation there are. Hong Kong
358
Polytechnic University has established extensive collaboration with a number of research institutes
359
in the field of BIM such as Tsinghua University, Queensland University Technology and the
360
Birmingham City University. University of Florida, University of Oklahoma, University North
361
Carolina Charlotte, Calif State University Fresno and DKS Informat Consulting LLC have jointly
362
formed a research group for close collaboration in 2018, these research institutes were connected by
363
thicken golden lines.
364
Furthermore, high betweenness centrality points were identified and displayed by purple outer
365
rings, representative research institutes of which were Hong Kong Polytechnic University (centrality
366
= 0.26), University of Washington (centrality = 0.24, Research institutions such as Tongji University
367
(centrality = 0.23) Georgia Institute of tech (centrality = 0.22) and Kyung Hee University (centrality =
368
0.20). These research institutes with high betweenness centrality are the hub nodes connected with
369
other research institutes and different clusters.
370
In terms of citation burst, seven research institutes have received varied strength of citation burst
371
at different time. According to the burst strength, the sequences were Georgia Institution of
372
Technology (strength = 6.63, 2006-2012), Technion-Israel Institute of Technology (strength = 6.57,
373
2009-2013), University of Salford (strength = 5.69, 2007-2012) and University of Newcastle (strength =
374
4.26, 2011-2013), UCL (strength = 3.62, 2017-2019), Virginia Polytechnic Institue and State University
375
(strength = 2.98, 2011-2013) and University of Reading (strength = 2.98, 2013-2014).
376
4.2 Co-word analysis
377
With more and more countries and research institutes focusing on BIM research, there are
378
various researches on different topics, subjects and keywords. Co-word analysis aims to study the
379
internal correlation and scientific structure of the literature through the statistical analysis of the
380
keywords that reflect the subject of the literature. Co-word can help to estimate trends and conduct
381
front research.
382
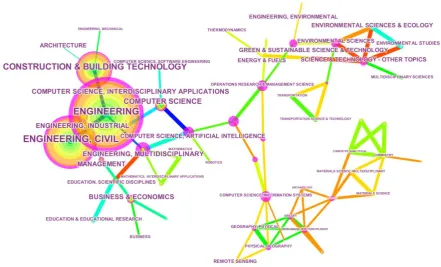
4.2.1 Network of co-occurring subject categories
383
Each journal publication from Web of Science Core Collection database is assigned to one or
384
more subject categories based on relevant journals. A network of subject category research was
385
generated with 62 nodes and 135 links. This network was used to analyze the emerging trend of BIM
386
research, as shown in Figure.7.
388
Figure.7:Network of co-occurring subject categories
389
In Figure. 7, the node size represents the number of articles in each category. Among them, the
390
frequency of Engineering is the highest, followed by Engineering Civil, Construction & Building
391
Technology, Computer Science, Engineering, Multidisciplinary and Engineering Industry. It
392
manifests that most of BIM articles were assigned to these categories.
393
It should also be noted that, in the past two years, subjects like Green & Sustainable science and
394
technology, Science and Technology-Other Topics and Environmental Studies have also attracted the
395
attention of scholars. What’s worth mentioning is that there are 58 articles in the category of Green &
396
Sustainable Science/Technology and 187 articles about computer science. Thus, it implies that the
397
potential of BIM in energy and environmental analysis and sustainable design has been recognized
398
and attached with great importance by the academic community.
399
Furthermore, nodes with high betweenness centrality were highlighted by purple outer rings ,
400
representative categories of which were computer science, artificial intelligence (centrality = 0.80),
401
engineering, electrical & electronic (centrality = 0.76), computer science, information systems
402
(centrality = 0.68) engineering, multidisciplinary (centrality = 0.66), and operations research &
403
management science (centrality = 0.65). They represent the turning point connecting different stages
404
of research, which has a significant impact on the development of BIM research.
405
Nine categories have received citation burst of different strengths at different time. According
406
to the burst strength, the sequences were Green & Sustainable Science & Technology (burst strength
407
= 7.53, 2017-2019), Remote Sensing (burst strength = 6.19, 2017-2019), other topics of Science &
408
Technology (burst strength = 5.72, 2017-2019), Architecture (burst strength = 5.41, 2004-2019),
409
Geography, Physical (burst Strength = 5.16, 2017-2019), Physical Geography (burst strength = 5.16,
410
2017-2019), Robotics (burst strength = 4.89, 2014-2015) and Engineering, Environmental (Burst
411
Strength = 3.70, 2017-2019). It indicates that these categories of publications are on behalf of the most
412
active fields in the research and development of BIM.
413
4.2.2 Network of co-occurring keywords and clusters analysis
Keywords play a role in highly summarizing the content of literature researches. To a certain
415
extent, they represent the research content of an article. The centrality of network nodes is one of the
416
key indexes reflecting the core degree of nodes, which can be used to measure the importance of some
417
node in the network as well as its correlation with other nodes. Therefore, the core issue or the focus
418
of researches that scientific researchers commonly concerned can be reflected by the keywords with
419
high centrality and frequency. There are two types of keywords in the literature database of Web of
420
Science: “author keyword” provided by the authors and "keyword +” identified by journals. The
co-421
occurring keyword network is constructed by the two types of keywords in bibliographic records.
422
There are similar keywords in all bibliographic records, such as "BIM", “building information
423
modeling", " Building information modelling", " building information modeling (BIM) ", and
424
"Building information modelling (BIM)". The function of merging similar keywords in CiteSpace is
425
used to merge these similar keywords to the "Building Information Model".
426
When analyzing the research hotspots of BIM, the network node was set to "Keyword", and the
427
synonymous keywords were merged after running the software to obtain the keyword co-occurring
428
network in the research literature, as shown in Figure. 8. Each keyword in the map was represented
429
by a square node. A larger block size represents a higher frequency of the keyword shown in the field
430
of BIM research, therefore, they are high frequency keywords. What needs to be concerned is the
431
square node with purplish red light which represents a high centrality of keywords and its close
432
correlation with other keywords. For this, there were 160 nodes and 516 links in the co-occurring
433
network.
435
Figure.8: Network of co-occurring keywords
436
The keywords with high frequency and high centrality in BIM research literature in the recent
437
decade are shown in Table.7. The top 10 keywords in the literature were Building Information Model
438
(frequency = 738), Construction (frequency = 359), Design (frequency = 213), System (frequency = 195),
439
Management (frequency = 190), Model (frequency = 138), Framework (frequency = 97), Project
440
(frequency = 95), Industry (frequency = 87), and Performance (frequency = 85). Combined with high
441
centrality keywords, we can find that the hot areas of global BIM research in the recent decade include
442
design, project, framework, industry and model. Keywords with high betweenness centrality are
443
correlated with different research subjects, which have a significant impact on the development of
444
BIM research as well.
445
446
Table.7:High Frequency keyword of BIM research from 2004-2019
447
SN
Keyword with high frequency Keyword with high centrality
1 Building Information Model 738 Design 0.66
2 Construction 359 Project 0.42
3 Design 213 Framework 0.39
4 System 195 Project Management 0.34
5 Management 190 System 0.32
6 Model 138 Simulation 0.32
7 Framework 97 Interoperability 0.29
8 Project 95 Tracking 0.29
9 Industry 87 Industry 0.27
10 Performance 85 Model 0.25
Besides, citation burst was observed in the following eight keywords: Building information
448
model (burst strength = 11.66, 2008-2014), Adoption (burst strength = 5.80, 2017-2019),
449
Interoperability (Burst strength = 5.63, 2007-2013), 4D CAD (burst strength = 4.57, 2011-2014), Cloud
450
Computing (burst strength = 4.38, 2012-2014), Generic Algorithm (burst strength = 4.26, 2014-2016),
451
Energy Efficiency (burst strength = 4.25, 2014-2016) and Augmented Reality (burst strength = 4.04,
452
2013-2015), indicating that these are the hotspots of BIM research in corresponding years.
453
Clustering in data mining is a process of aggregating and classifying data in complex networks
454
according to similarity. In keyword clustering analysis, the similarity of nodes in the network is
455
reflected, which is conducive to identify and detect representative knowledge subgroups in a certain
456
field of research, that is, the hot subject in the research field. The network node is set to "Keyword"
457
For clustering on the basis of the generation of keyword co-occurring network. Finally, the keyword
458
clustering network in the field of BIM research is obtained, as shown in Figure. 9.
459
460
Figure.9: Network of co-occurring keywords- Clusters
462
BIM research hotspots can be summarized into 13 subjects: #0: research review (Silhouette = 0.79,
463
Size = 19), #1: building design (Silhouette = 0.832, Size = 16), #2: modelling path (Silhouette = 0.971,
464
Size = 14), #3: Construction engineering (Silhouette = 0.838, Size = 13), #4: interior construction
465
progress monitoring (Silhouette = 0.913, Size =13), #5: Ontology-based partial building information
466
model extraction (Silhouette = 0.826, Size = 12), #6: facility management (Silhouette = 0.872, Size = 10),
467
#7: space conflict (Silhouette = 0.853, Size = 10), #8: lean production management system(Silhouette =
468
0.765, Size = 9), #9: construction supply chain management (Silhouette = 0.914, Size = 8), #10:
object-469
oriented model(Silhouette = 0.938, Size = 8), #11:repetitive construction project (Silhouette = 0.918,
470
Size = 8), #12: integrating resource product (Silhouette = 0.856, Size = 8), and #13: Organization
471
Division(Silhouette = 0.962, Size = 7). The larger the value of silhouette is, the more obvious the cluster
472
effect will be, while a smaller value of sihouette will lead to an insignificant effect.
473
4.3 Co-Citation analysis
474
When two documents are cited by a third document simultaneously, there will be co-citation
475
relationship between the two documents[4, 16]. The citation frequency of literature can objectively
476
reflect the degree to which the literature can be recognized by the academic community or the
477
knowledge domain, as well as the position of the literature in the network. Continuously highly cited
478
literature is considered classical in a certain field, while the early foundational literature and seminal
479
literature in a field could reflect the development and research basis of the researches in that field.
480
CiteSpace software was used in this section to perform co-citation analysis of journals, authors and
481
documents. BIM’s co-citation network was generated, in which the meaning of the size and color of
482
the nodes and the thickness and color of the links are similar to the interpretation of the previous
483
networks.
484
4.3.1 Journal co-citation network
485
The journal co-citation network in the field of BIM was established using CiteSpace software.
486
There were 261 nodes and 644 links in the network.
487
As shown in Figure.10, the five most influential journals were Automation in Construction
488
(frequency = 1071), Journal of Construction Engineering and Management (frequency = 548), BIM
489
Handbook (frequency = 475) , Advanced Engineering Informatics (frequency = 451) and Journal of
490
Computing in Civil Engineering (frequency = 447) in turn. These five journals are also the most
491
published source journals in the field of BIM.
493
Figure.10:Journal co-citation network
494
As shown clearly in Figure.10, some nodes with high betweenness centrality were highlighted
495
with purple rings, such as International Journal of Project Management (centrality = 0.22), Journal of
496
Construction Engineering and Management (centrality = 0.20) and Energy and Buildings (centrality
497
= 0.11). These journals represent major academic turning points and interrelated journals published
498
at different stages.
499
In addition, citation burst was found in the following representative journals in turn: Journal of
500
Information Technology in Construction (burst strength = 19.09, 2008-2013), Automation In
501
Construction (burst strength = 18.5, 2006-2014), Building Product Models: Building Product Models:
502
Computer Environments, Supporting Design and Construction (Book) (burst strength =
14.63,2005-503
2012), Cost Analysis of Inadequate Interoperability in the US Capital Facilities Industry (Book) (burst
504
strength = 8.12, 2009-2014) and Computer-Aided Design (burst strength = 8.05, 2006-2013). It shows
505
that the articles published on these journals were widely cited in a short period of time, therefore,
506
they are worthy of paying attention to.
507
4.3.2 Author co-citation network
508
Author co-citation analysis can be used to identify the relationship between the authors cited in
509
the same article and analyze the evolution of the research group. The author co-citation network in
the field of BIM is shown in Figure.11, consisting of 308 nodes and 757 links. The meaning of the size
511
and color of nodes as well as the thickness and color of links in the map is interpreted similarly to
512
that of the previous map.
513
514
Figure.11:Author co-citation network
515
Seen from the figure, the top 10 authors were Charles M. Eastman (frequency = 621, USA),
516
Salman Azhar (frequency = 300, USA), Rafael Sacks (frequency = 212, Israel), Bilal Succar (frequency
517
= 208, Australia), Burcin Becerik-Gerber (frequency = 184, USA), Yusuf Arayici (frequency = 145,
518
Turkey), Rebekka Volk (frequency = 127, Germany), Ghang Lee (frequency = 125, South Korea), Ning
519
Gu (frequency = 115, Australia), and Heng Li (frequency = 100, Hong Kong). The diversity of the most
520
cited authors’ locations indicates that BIM research has been widely carried out around the world.
521
Authors with high betweenness centrality were also identified with purple rings. The nodes with
522
purple rings means that the authors enjoy high betweenness centrality, representative authors of
523
which are Arayici Y (centrality = 0.25), Succar B. (centrality = 0.24), Sacks R (centrality = 0.23), etc.
524
They are the main intellectual drivers of BIM research and interrelated research in different research
525
groups.
526
Several authors have experienced citation burst with the frequency of citations increasing
527
rapidly in a short period of time. According to citation burst strength, the top five authors are Michael
528
P. Gallaher (burst strength = 10.8136, 2009-2014), Lachmi Khemlani (burst strength = 10.59 2009-2013),
529
Kiviniemi Arto (burst strength = 10.26,2007-2012), Bo-Christer Björk (burst strength = 8.27, 2009-2012)
530
and Bonsang Koo (burst strength = 7.86, 2009-2014). These authors may usually affect the direction of
531
BIM research, thus their articles are worthy of paying attention to.
533
4.3.3 Document co-citation network
534
Document co-citation analysis can be used to analyze the underlying structure of a knowledge
535
field and show the number and authority of citations. During the analysis of this document
co-536
citation, the co-citation clusters were also confirmed by CiteSpace. The document co-citation network
537
is shown in Figure.12, with 394 nodes and 851 links. Each node represents a document and is marked
538
with the name of the first author and the year of publication. Each link represents the co-citation
539
relationship between two corresponding documents. The node size shows the co-citation frequency
540
of documents. Documents with high betweenness centrality and citation burst were highlighted by
541
purple rings and red rings, respectively.
542
543
544
Figure.12:Document co-citation network
545
546
As shown in Figure.12, the 2011 and 2008 versions of BIM Handbook [22][45] published by
547
Charles M. Eastman et al. received 266 and 143 co-citations, respectively, followed by 134 co-citations
548
of Salman Azhar [2], 130 co-citations of Bilal Succar[24] and 129 co-citations of Rebekka Volk[25].
549
These articles are worthy of paying attention to. Representative documents with high betweenness
550
centrality were Arayici Y et al. [26](centrality = 0.52), Timo Hartmann et al. [27] (centrality = 0.49),
551
Salman Azhar[28] (centrality = 0.46), Timo Hartmann et al. [29](centrality = 0.46) and Stefan Boddy et
552
al. [29](centrality = 0.40).
A number of documents have received citation bursts, of which the representative ones include
554
Charles M. Eastman (burst strength = 19.65, 2009-2015), Rob Howard et al.[30] (burst strength =
555
9.78,2010-2015), Timo Hartmannt [27] (burst strength = 7.86, 2011-2015), Rafeal Sacks et al. [31] (burst
556
strength = 6.92, 2006-2012) and Rafael Sacks [32] (Burst Strength = 6.55, 2012-2014), which indicates
557
that there was a significant increase in the number of citations of these documents over a short period
558
of time in the corresponding years.
559
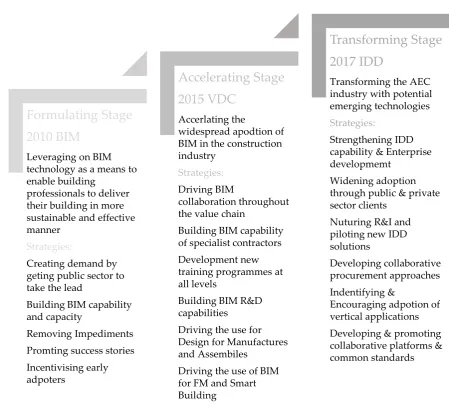
5. A revolution in global BIM research
560
BIM is a revolutionary technological development that is rapidly reshaping the AEC industry
561
and transforming the way we build. This aim of this section is to identify the significant co-citation
562
clusters to determine the key or anchor representative research and categorize the global BIM
563
research over the past 16 years into 3 stages, namely: infancy stage, maturity stage and expansion
564
stage.
565
As the core and essence of articles, keywords could be used as proxies to summarize research
566
hotspots in terms of directions and topics[33]. A significant feature and function of CiteSpace is to
567
probe and identify the research hotspots in related fields through the analysis of keyword
568
frequencies[33].There are three cluster analysis algorithms in CiteSpace, namely, latent semantic
569
indexing (LSI), loglikelihood ratio (LLR) and mutual information (MI). In this study, LLR algorithm
570
was used to select the optimal cluster label according to uniqueness and coverage, which was also
571
recommended by Chen Chaomei [34].
572
Based on the keywords of the documents cited in each cluster, a total of 12 significant co-citation
573
clusters were identified, as illustrated in Figure.13. There were 40 members in#0 "building
574
information model", which was the largest. The number in cluster #11 "total construction as-built
575
documentation" was the smallest, with only 5 members.
576
577
Figure.13:Document co-citation network- Clusters analysis
579
The top three representative articles in each cluster were also shown in Figure.13, for instance,
580
In Cluster#7 Construction safety planning, the top three representative articles were Chuck Eastman
581
et al. [35], Javier Irizarry et al. [36] and Umit Isikdag et al. [37].Alternative tags with the second and
582
third highest LLR scores were also shown in Table.8, clusters of which were sorted by size (i.e. the
583
number of documents/members).
584
Sihouette metric in clusters was used to measure the average homogeneity of the clusters. A high
585
silhouette score indicates high consistency of cluster members in clusters of similar sizes. The score
586
range of the above 11 clusters was between 0.858 and 0.996, suggesting high consistency of members
587
in each cluster. Mean year of publications suggests whether the cluster consists of the latest published
588
documents or the old ones, through which it can be found that Cluster #4 "integral part" consists of
589
old documents, while Cluster #6 and #10 consist of new documents. In addition, representative
590
documents of each cluster refer to the top three documents with most co-citation frequency in a
591
cluster. These representative documents have a profound impact on the label of the cluster, which is
592
worthy of paying attention to.
593
Table.8:Co-citation clusters of BIM research in 2004 - 2019
594
Cluster
ID Size Silhouette
Mean (Year)
Cluster Label (LLR)
1st Alternative Label 2nd Alternative Label Representative documents
#0 40 0.858 2008
building information model multi-standpoint framework technological development
Succar Bilal [24]
Rob Howard et al [30]
James D.Goedert et al [38]
Dana K. Smith et al[39]
#1 36 0.94 2008 research
review symphony
digital construction design
Carrie S. Dossick et al [40]
Rafael Sacks et al[41]
Timo Hartmann et al [27]
#2 33 0.913 2012 literature review project information management framework automated monitoring
Rebekka Volk et al [25]
David Bryde et al [42]
Ning Gu et al [43]
#3 31 0.88 2012 construction project project information management framework operational critical success factor
Salman Azhar et al [44]
Youngsoo Jung et al [45]
Pingbo Tang et al [46]
#4 28 0.945 2006 integral part civil engineering education
teaching building information modeling
Chuck Eastman et al[47]
Vishal Singh et al [48]
Tomo Cerovsek [49]
#5 27 0.912 2012
building information modelling green building project information management framework
Salman Azhar et al[50]
Arno Schlueter et al [51]
Burcin Becerik-Gerber et al [52]
#6 24 0.934 2015 inspecting post-construction
Life cycle assessment
environmental potential
Alan Redmond et al [53]
energy efficiency
Lieyun Ding et al [54]
Kwok Wai Wong et al [55]
#7 23 0.969 2008
construction safety planning geographic information system space conflict
Chuck Eastman et al [35]
Javier Irizarry et al [36]
Umit Isikdag et al [37]
#8 21 0.924 2008 modelling organization
structural
adjustment pilot study
Rafael Sacks [56]
Cabinet Office [57]
Guillermo Aranda-Mena et al [58]
#9 18 0.982 2014
project information management framework construction project building information modelling
Chuck Eastman et al[47]
M. Venugopal et al [23]
Jim Steel et al [59]
#10 14 0.985 2015
automated ifc-based workflow diagnosis approach auto-deployed model-based fault detection Rizal Sebastian[60]
Mehmet Yalcinkaya et al[61]
Heap-Yih Chong et al [62]
#11 5 0.99 2014
total construction as-built documentatio n
lift planning benefit sharing
Burcin Becerik-Gerber et al [63]
Dongping Cao et al [64]
Ibrahim Motawa et al [65]
Note: rows for clusters #0, #1, #2, #3,#4 and #9 are classified to the formulating stage; rows for clusters
595
#5 ,#6, #7 and #8, to the accelerating stage, and clusters #10 and # 11 to the transforming stage.
596
5.1 Evolution of global BIM research
597
Clustering is essentially, the grouping of a set of objects in such a way that objects in the same
598
group, herein called a cluster, are more similar in traits or features to each other than to those in other
599
groups. It is an iterative process of knowledge discovery, or interactive multi-objective optimization
600
that involves trial and error. There are a handful types of clustering, such as strict partitioning
601
clustering, strict partitioning clustering with outliers, hierarchical clustering, overlapping clustering
602
and subspace clustering. Strict partitioning clustering with outliers, which is a type of hard clustering
603
is adopted in this section of our study. These clusters, which are formed based on document
co-604
citation, and namely the formulating stage, accelerating stage and transforming stage, are
605
distinguished by the cluster labels of global BIM research. The cluster labels are used as a proxy to
606
determine the diffusion of innovation or technology adoption stage. For cluster #0,1,2,3,4 and 9, it can
607
be inferred that the research has been expanded and translated to industry practice, ; for cluster
608
#5,6,7and 8, it can be inferred that the research direction is at the accelerate stage, suggested by early
609
to early majority adoption of the knowledge or technology; for cluster #10 and 11, it can be inferred
610
that the research thrust for that cluster is innovative and at a nascent, transforming stage, as
611
illustrated in Figure.14.