P R O C E E D I N G S
Open Access
Admixture mapping analysis in the context of
GWAS with GAW18 data
Mengjie Chen
1, Can Yang
2, Cong Li
1, Lin Hou
2, Xiaowei Chen
1, Hongyu Zhao
1,2*From
Genetic Analysis Workshop 18
Stevenson, WA, USA. 13-17 October 2012
Abstract
Admixture mapping is a disease-mapping strategy to identify disease susceptibility variants in an admixed population that is a result of mating between 2 historically separated populations differing in allele frequencies and disease prevalence. With the increasing availability of high-density genotyping data generated in genome-wide association studies, it is of interest to investigate how to apply admixture mapping in the context of the genome-wide association studies and how to adjust for admixture in association tests. In this study, we first evaluated 3 different local ancestry inference methods, LAMP, LAMP-LD, and MULTIMIX. Then we applied admixture mapping analysis based on estimated local ancestry. Finally, we performed association tests with adjustment for local ancestry.
Background
In human genetics studies, several approaches are commonly used to identify disease risk variants, including linkage analysis, association analysis, and admixture mapping. Among these 3 methods, admixture mapping can fill a niche between family based linkage analysis and population-based association analysis, when the disease-causing variants differ in frequency between different ethnic groups because of drift or selection. This approach has been successfully applied in recent studies of African Americans [1] and Mexican Americans [2], implicating susceptibility regions for prostate cancer and type 2 diabetes that are associated with ancestry. Of relevance for Genetic Analysis Workshop 18 (GAW18), epidemiological studies have found that rates of hypertension vary markedly in different regions and ethnic groups, suggesting that admixture mapping may be a viable approach to analyzing the GAW18 Mexican American cohort. In this study, we first compared 3 local ancestry inference methods based on several metrics. With the estimated local ancestry, we then performed admixture mapping. Finally, we performed association tests with adjustment for local ancestry.
Methods
Data set, reference panels, and preprocessing
All analyses presented in this paper are based on the genotyping data of 109 unrelated individuals with blood pressure information from GAW18. Two individuals, T2DG1101320 and T2DG0800490, were excluded because of their high genotype missing rates. For association analysis with quantitative traits, we used log-transformed systolic and diastolic blood pressure measurements at the second examination of each individual. For binary traits, that is, case or control, all individuals diagnosed with hypertension at least once were classified as cases, whereas others were classified as controls. Because of the methodo-logical purpose of our analysis, we performed the analyses only on chromosome 3.
We utilized CEU and YRI samples of release 27 of merged phases II and III of the International Haplotype Map Project (HapMap) for European and African ances-try, respectively, and the Human Genome Diversity Project (HGDP) samples from the Americas for Native American ancestry, which include 6 Colombian, 13 Karitiana, 22 Maya, 14 Pima, and 8 Surui individuals (denoted as NA). We extracted markers that were present in both the reference panels and the GAW18 subjects and then removed markers with missingness greater than 20%, resulting in a set of 37,438 single-nucleotide polymorph-isms (SNPs). Inconsistency in the strand orientation was
* Correspondence: [email protected]
1
Program in Computational Biology and Bioinformatics, Yale University, New Haven, CT 06520, USA
Full list of author information is available at the end of the article
observed among data from HapMap, HGDP, and GAW18. We realigned HGDP and GAW18 to the orientation of HapMap, resulting in 7004 of the 37,438 SNPs being recoded.
Global and local ancestry estimation
We performed supervised global ancestry estimation of chromosome 3 using ADMIXTURE [3], with the number of ancestral populations fixed at 3. Global estimates were used as a reference metric to assess the perfor-mance of local ancestry estimates. The perforperfor-mance of ADMIXTURE depends highly on the number of markers used. Generally, more markers are needed to perform adequate genome-wide association studies (GWAS) correction than to depict population structure. As a rule of thumb, 100,000 markers (genome-wide) are necessary to perform GWAS correction when populations are within a continent (the context of GAW18). To fully harness the ancestral information from markers, we used 37,348 SNPs for chromosome 3. Thus, we think the global ancestry estimation from ADMIXTURE is of high quality.
We used LAMP, LAMP-LD [4], and MULTIMIX [5] to estimate local ancestry. To apply LAMP, we first constructed an ancestry-informative marker (AIM) panel based on the F-statistic (Fst), a commonly used measure
of genetic diversity across populations. To calculate Fst,
we used allele frequencies for CEU and YRI from HapMap release 27, as well as allele frequencies for Mayan (MAY) and Pima (PMA) from the Allele FREquency Database (ALFRED) [6]. Sets of AIMs were selected so that for each SNP, (a) allele frequency was similar in Mayan and Pima Indians (FstMAY−PMA<0.1);
(b) allele frequency was different in CEU and YRI (FstCEU−MAY>0.2 and FstCEU−PMA >0.2 and FstYRI−MAY
>0.2 and FstYRI−PMA>0.2); and (c) LDr2 <0.1 for each
pair of selected SNPs (this step was automatically per-formed in LAMP). This resulted in 522 AIMs in total. We ran LAMP in the LAMPANC mode inputting allele frequencies of CEU, YRI, and NA, respectively, with the following configuration parameters: mixture proportions (alpha) = 0.6, 0.1, 0.3; number of generations since admix-ture (g) = 10; recombination rate (r) = 1e-8; fraction of overlap between adjacent windows (offset) = 0.2; andr2 threshold (ldcutoff) = 0.1.
To apply LAMP-LD, we first phased the reference panel using the SHAPEIT software [7] with default settings. We then ran LAMP-LD on the GAW18 samples. Considering that LAMP-LD used window-based processing in its model, we tested the effects of different window sizes (150, 100, 75, and 50). We applied MULTIMIX to both phased (by SHAPEIT) and unphased GAW18 samples with phased reference. For phased samples, we used the MULTIMIX_EM algorithm with resolving step. For unphased samples, we used the MULTIMIX_MCMCgeno
algorithm with misfitting probabilities equal to the estima-tion from MULTIMIX_EM.
Estimation of the number of generations since admixture
Given the number of ancestry segments (A) of each indivi-dual, we estimate the number of generations (N) since admixture atN = A/4a(1-a)L, whereais the admixture proportion of European ancestry,4a(1-a)is the number of expected recombination events in a diploid individual, and
Lis the length of genetic map in morgans (2.217 morgans on chromosome 3).
Admixture mapping analysis
We used a linear regression model similar to the model proposed by Zhu et al. [8] for admixture analysis. Specifically, let yi be the residual trait value of individual
i after adjusting for age and gender. Let Sij be the
Eur-opean/Native American ancestry at thejth marker, andS¯i
be the average of the European/Native American ancestry of individual i. We tested the null hypothesis β2= 0 on the model yi=β0+β1S¯i+β2(Sij− ¯Si) +εi. We selected
SNPs whose false discovery rate (FDR) adjustedp-value was less than 0.05.
Association analysis with adjustment for local ancestry
We propose an association test with adjustment for local ancestry based on the model
yi=βGij+
K
k=1βkαijkqk+εi, where yi is the residual trait value of individual i as defined above, Gij is half of
the number of nonreference alleles, αijk is the local ances-tral proportion for the kth ancestral population of individual i at the jth marker, and qk is the allele
frequency of the nonreference allele for thekth ancestral population. We tested for association with the null hypothesis:β= 0. We selected SNPs whose FDR-adjusted
p-value was less than 0.05.
Results and discussion
Comparisons of local ancestry inference methods
procedure; MULTIMIX requires an additional boundary-resolving step with a larger computational burden, whereas LAMP-LD resolves the boundaries internally with better efficiency.
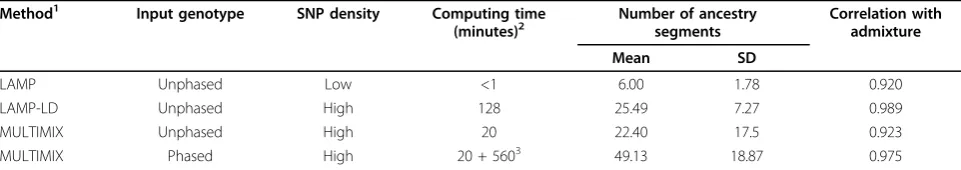
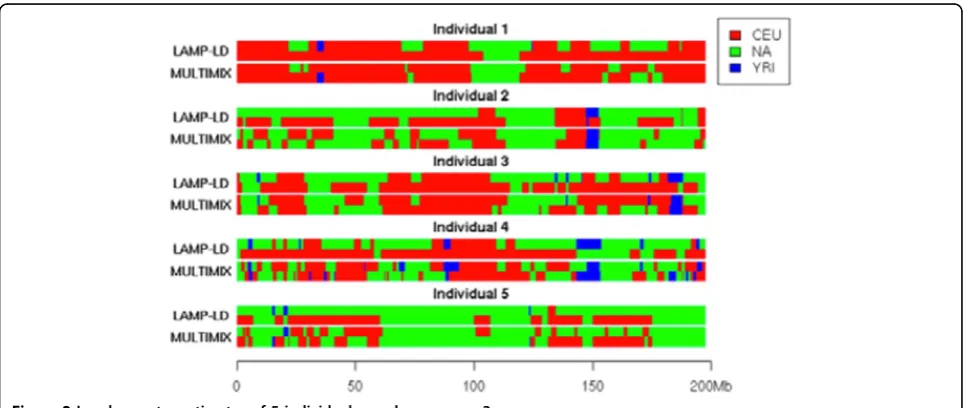
Table 1 summarizes the results from these 3 methods. LAMP-LD achieved the highest correlation (0.989) with the global estimates from ADMIXTURE. LAMP-LD and MULTIMIX, based on unphased genotype data, led to similar estimates on the number of ancestry segments, which suggests that the number of generations since admixture is between 10 and 12. This is consistent with previous reports that Latino and Hispanic populations have been admixed within the past 10 generations. We note that the number of ancestry segments from MULTIMIX using phased data is double that from the unphased data. This increment results from more inferred segments with smaller sizes from the phased haplotypes (Figure 1). Therefore, additional simulation studies are needed to investigate the robustness of the inference results given the uncertainty in haplotype phasing.
Comparisons of local ancestry estimates
We further compared local ancestry estimates from LAMP-LD and MULTIMIX with phased data (Table 2). Using global estimates from ADMIXTURE as reference, we first assessed the reliability of local ancestry esti-mates at a global level. LAMP-LD produced very stable estimates across different window sizes, with the mean Pearson correlation around 0.989 and 4% of SNP ances-try “mislabelled.” MULTIMIX achieved better accuracy with smaller window sizes. When the window size decreased from 150 to 50 SNPs, the mislabelled rate dropped from 8% to 4.5%. Using the same window size, LAMP-LD always outperformed MULTIMIX.
Although estimates from MULTIMIX and LAMP-LD are comparable at the global level, there was appreciable difference at the local level (Figure 2). We further checked differences on the estimates of 6 diploid types (CEU-YRI, YRI-NA, CEU-NA, CEU-CEU, YRI-YRI, NA-NA) (see Table 2). For example, when the window size was fixed to 100 SNPs, 18% of the SNPs had inconsis-tent diploid inferences between the 2 methods, which
led to differences in downstream admixture mapping and association analysis results.
Admixture mapping analysis and association test
We used local ancestry estimates from MULTIMIX and LAMP-LD with window size 100 for both admixture mapping analyses and association tests. No SNP’s adjusted FDRp-value is lower than 0.05 for all the tests. This may be as a result of the low power because of the small sample size and/or the lack of genomic regions affecting these traits.
Overall, the admixture mapping analysis for local ances-try is underpowered. The genomic control factors for the test on European ancestry using LAMP and MULTIMIX amounted to 0.894 and 0.936, respectively. We further compared the test statistics (t) from admixture mapping analyses using different local ancestry estimates. In the association tests of diastolic blood pressure with European ancestry, we found 694 SNPs with at-statistic higher than 3 based on MULTIMIX estimates, compared to 68 for LAMP-LD estimates. We used permutation to assess the significance of this association. Specifically, we permuted the traits and subsequently fitted the regression model
Table 1 Comparisons of different local ancestry inference methods.
Method1 Input genotype SNP density Computing time
(minutes)2 Number of ancestrysegments Correlation withadmixture
Mean SD
LAMP Unphased Low <1 6.00 1.78 0.920
LAMP-LD Unphased High 128 25.49 7.27 0.989
MULTIMIX Unphased High 20 22.40 17.5 0.923
MULTIMIX Phased High 20 + 5603 49.13 18.87 0.975
1
Only results from runs with window size of 100 are listed in Table 1.
2
One hundred seven samples were tested on a PowerEdge M600 node 2.33 GHz with 16 GB RAM.
3
Additional 560 minutes were used to resolve the boundaries.
3000 times. For each regression we calculated the number of SNPs with a t-statistic greater than 3. By comparing the observed t-value with the distribution of the statistic from the permutations, we obtained a
p-value of 0.027 for MULTIMIX estimates and a
p-value of 0.2 for LAMP-LD estimates. This indicates the inconsistent inferences between MULTIMIX and LAMP-LD may lead to different conclusions in down-stream analyses.
The small number of investigated individuals was a limitation of the present study. For example, assuming a 9.75% exposure probability among controls (minor allele frequency 5% and dominant penetrance model), a type I error equal to 0.05/37,438, and a sample size of 36 cases and 72 controls (the hypertension prevalence in the sample was 33%), the present study had 80% power to identify a genotype relative risk of 14.4. The low statistical power clearly limits the detection of effects attributable to ancestry adjustment.
Conclusions
Although many methods have been proposed to infer local ancestry in the last several years, most of them are not applicable to 3-way admixed Latino and Hispanic populations, nor can they account for background LD. LAMP-LD and MULTIMIX are newly developed methods to address these challenges. This report shows that both methods performed better than LAMP in the context of GWAS with densely spaced markers. Using global estimates from ADMIXTURE as a standard, this report shows that both methods achieved high accuracy of ancestry estimation at the global level (greater than 95%). However, 18% of the SNPs had different ancestry inferences between the 2 methods. MULTIMIX with phased samples produces much smaller ancestry segments, which is a major cause of the discrepancy at the local level. The statistical properties of MULTIMIX need to be further studied. Consequently, multiway admixture deconvolution at the local level is still a challenging problem.
Table 2 Comparisons of local estimates from LAMP-LD and MULTIMIX.
Method Window size (SNPs)
Mean correlation1 SD of correlation1 Mean deviation (%)1
SD of deviation (%)1
Diploid inconsistency (%)
LAMP-LD 150 0.988 0.043 4.0 3.6 19.8
MULTIMIX 150 0.959 0.105 8.0 5.8
LAMP-LD 100 0.989 0.041 3.9 3.4 18
MULTIMIX 100 0.975 0.100 6.0 5.2
LAMP-LD 75 0.989 0.041 3.9 4.1 16.6
MULTIMIX 75 0.974 0.108 6.0 4.5
LAMP-LD 50 0.989 0.043 3.7 3.2 14.2
MULTIMIX 50 0.985 0.072 4.5 3.5
1
Comparisons with global estimates from ADMIXTURE. Deviation is defined as the percentage of inconsistent SNPs.
It has been shown that local ancestry at a SNP might confound with the association signal. Ignoring this could lead to spurious associations [9]. Although no significant association was detected in the present exercise, we note that local ancestry is an important facet of population stratification, and integrating the local heterogeneity into association tests is necessary for admixed samples.
Competing interests
The authors declare that they have no competing interests.
Authors’contributions
MC and HZ designed the overall study; MC, CY, CL, XC, and LH conducted statistical analyses; and MC and HZ drafted the manuscript. All authors read and approved the final manuscript.
Acknowledgements and declarations
We thank the organizers of GAW18 for providing the data set. This research was supported in part by National Institutes of Health (NIH) grants R01 GM50507, R01 DA12849 and R01 DA030976, and the VA Cooperative Studies Program of the Department of Veterans Affairs. MC, CL, and XC
acknowledge support from CSC Scholarship. The GAW18 whole genome sequence data were provided by the T2D-GENES Consortium, which is supported by NIH grants U01 DK085524, U01 DK085584, U01 DK085501, U01 DK085526, and U01 DK085545. The other genetic and phenotypic data for GAW18 were provided by the San Antonio Family Heart Study and San Antonio Family Diabetes/Gallbladder Study, which are supported by NIH grants P01 HL045222, R01 DK047482, and R01 DK053889. The Genetic Analysis Workshop is supported by NIH grant R01 GM031575. This article has been published as part ofBMC ProceedingsVolume 8 Supplement 1, 2014: Genetic Analysis Workshop 18. The full contents of the supplement are available online at http://www.biomedcentral.com/bmcproc/ supplements/8/S1. Publication charges for this supplement were funded by the Texas Biomedical Research Institute.
Authors’details
1Program in Computational Biology and Bioinformatics, Yale University, New
Haven, CT 06520, USA.2Department of Biostatistics, Yale School of Public Health, Yale University, New Haven, CT 06520, USA.
Published: 17 June 2014
References
1. Reich D, Patterson N, De Jager PL, McDonald GJ, Waliszewska A, Tandon A, Lincoln RR, DeLoa C, Fruhan SA, Cabre P,et al:A whole-genome admixture scan finds a candidate locus for multiple sclerosis susceptibility.Nat Genet2005,37:1113-1118.
2. Adler S, Pahl M, Abboud H, Nicholas S, Ipp E, Seldin M:Mexican-American admixture mapping analyses for diabetic nephropathy in type 2 diabetes mellitus.Semin Nephrol2010,30:141-149.
3. Alexander DH, Novembre J, Lange K:Fast model-based estimation of ancestry in unrelated individuals.Genome Res2009,19:1655-1664. 4. Baran Y, Pasaniuc B, Sankararaman S, Torgerson DG, Gignoux C, Eng C,
Rodriguez-Cintron W, Chapela R, Ford JG, Avila PC,et al:Fast and accurate inference of local ancestry in Latino populations.Bioinformatics2012,
28:1359-1367.
5. Churchhouse C, Marchini J:Multi-way admixture deconvolution using phased or unphased ancestral panels.Genet Epidemiol2013,37:1-12. 6. The ALlele FREquency Database.[http://alfred.med.yale.edu/alfred/
AboutALFRED.asp].
7. Delaneau O, Marchini J, Zagury JF:A linear complexity phasing method for thousands of genomes.Nat Methods2011,9:179-181.
8. Zhu X, Young JH, Fox E, Keating BJ, Franceschini N, Kang S, Tayo B, Adeyemo A, Sun YV, Li Y,et al:Combined admixture mapping and association analysis identifies a novel blood pressure genetic locus on 5p13: contributions from the CARe consortium.Hum Mol Genet2011,
20:2285-2295.
9. Wang X, Zhu X, Qin H, Cooper RS, Ewens WJ, Li C, Li M:Adjustment for local ancestry in genetic association analysis of admixed populations.
Bioinformatics2011,27(5):670-677.
doi:10.1186/1753-6561-8-S1-S3
Cite this article as:Chenet al.:Admixture mapping analysis in the context of GWAS with GAW18 data.BMC Proceedings20148(Suppl 1):S3.
Submit your next manuscript to BioMed Central and take full advantage of:
• Convenient online submission
• Thorough peer review
• No space constraints or color figure charges
• Immediate publication on acceptance
• Inclusion in PubMed, CAS, Scopus and Google Scholar
• Research which is freely available for redistribution