R E S E A R C H A R T I C L E
Open Access
Magnitude of income-related disparities in
adverse perinatal outcomes
Ketan Shankardass
1,2*, Patricia O
’
Campo
2, Linda Dodds
3, John Fahey
4, KS Joseph
5, Julia Morinis
2,6and Victoria M Allen
3Abstract
Background:To assess and compare multiple measurements of socioeconomic position (SEP) in order to determine the relationship with adverse perinatal outcomes across various contexts.
Methods:A birth registry, the Nova Scotia Atlee Perinatal Database, was confidentially linked to income tax and related information for the year in which delivery occurred. Multiple logistic regression was used to examine odds ratios between multiple indicators of SEP and multiple adverse perinatal outcomes in 117734 singleton births between 1988 and 2003. Models for after tax family income were also adjusted for neighborhood deprivation to gauge the relative magnitude of effects related to SEP at both levels. Effects of SEP were stratified by single- versus multiple-parent family composition, and by urban versus rural location of residence.
Results:The risk of small for gestational age and spontaneous preterm birth was higher across all the indicators of lower SEP, while risk for large for gestational age was lower across indicators of lower SEP. Higher risk of
postneonatal death was demonstrated for several measures of lower SEP. Higher material deprivation in the neighborhood of residence was associated with increased risk for perinatal death, small for gestational age birth, and iatrogenic and spontaneous preterm birth. Family composition and urbanicity were shown to modify the association between income and some perinatal outcomes.
Conclusions:This study highlights the importance of understanding the definitions of SEP and the mechanisms that lead to the association between income and poor perinatal outcomes, and broadening the types of SEP measures used in some cases.
Keywords:Perinatal, Socioeconomic position, Health inequalities, Neighborhood, Income
Background
In Nova Scotia, Canada, despite all families having ac-cess to essential health services through a publicly funded insurance program, lower-income mothers have worse perinatal outcomes than mothers with higher income [1]. Socioeconomic position (SEP) is a multi-dimensional characteristic with an indirect, complex re-lationship to perinatal health [1-5], and past studies indicate that multiple indicators should be considered when measuring inequalities [6,7].
Effects associated with SEP may reflect unique and inter-related mechanisms at multiple levels. This in-cludes maternal and family characteristics associated with low income that mediate effects on adverse perinatal outcomes (e.g., whether or not a mother uses tobacco products during pregnancy), as well as macro-social factors (i.e., economic, political and macro-social) that are better measured at the group or environmental level (e.g., in relation to the availability of prenatal care) [8-18]. These mechanisms may also vary by other con-textual factors. In particular, lower SEP can mean dif-ferent things for families living in urban and rural settings [19]; for example, in Nova Scotia there is poorer access to specialized health services in rural setting [20]. Family composition may also change the implications of lower SEP since female-headed lone parent families are
* Correspondence:kshankardass@wlu.ca
1
Department of Psychology, Wilfrid Laurier University, 75 University Avenue West, Waterloo, Ontario, Canada
2
Centre for Research on Inner City Health, St. Michael’s Hospital and Dalla Lana School of Public Health, University of Toronto, Toronto, Ontario, Canada Full list of author information is available at the end of the article
often young [21] and have low income [22,23], so it is likely harder to manage stressors than comparable two-parent families [24-29]. Identifying what dimensions of SEP mean at different levels and in different contexts can facilitate interventions [30]; yet, few studies have compared the consistency in associations across mea-sures of SEP for perinatal outcomes, and across various contexts.
Most investigations into income disparities and perinatal outcomes have assumed that the effects of income on health are direct. As a result, these analyses often control for risk factors as potential confounders that may actually lie on the causal pathways that relate income level to adverse perinatal outcomes. By controlling for a partly or fully mediating factor, this approach leads to underesti-mates of the magnitude of income-related disparities. For example, mothers of lower SEP are more likely to smoke tobacco products than higher SEP mothers in Nova Scotia [31], and some findings suggest that lower SEP mothers may also be more likely to continue smoking during preg-nancy due to the the stressfulness of their context for several reasons (e.g., , partly as a maladaptive coping habit [32]. Similarly, property values in Nova Scotia drive lower SEP families in Nova Scotia to live in more polluted envi-ronments in [33,34], so the deprivation level of a neigh-bourhood could reflect how likely individual are to be exposed to unhealthy environmental conditions [33,34]. In these examples, family and neighbourhood SEP may in-crease risk for adverse perinatal outcomes through path-ways involving differential exposure to tobacco smoke and air pollution; thus, we argue that such risk factors should correctly be considered mediators of health effects related to income, rather than confounders.
This analysis asks: 1) “On which disease processes, in
which subpopulations, and at what geographic levels can socioeconomic inequalities in perinatal health be
demonstrated in Nova Scotia?”; and 2)“Do different
in-dicators of SEP demonstrate varying magnitudes of
inequalities?” We examined the relationship between
several indicators of SEP at the household and neigh-borhood levels and adverse perinatal outcomes among singleton births in Nova Scotia between 1988 and 2003 using a population-based observational study of the SEP in the year of delivery and birth outcomes up to one year of life. Lastly, we examined whether income dispar-ities varied across families in urban and rural settings, and in female-headed lone-parent families versus two-parent families. This analysis treats family income-related variables as proxies for SEP and assumes that other maternal risk factors for perinatal health may plausibly lie downstream of income on common causal pathways that shape the development and constraint of maternal health behaviours and exposures to environ-mental toxins.
Methods Study population
The study population included all families (unit of ana-lysis) that gave birth in Nova Scotia between 1988 and 2003. Data describing perinatal outcomes and maternal or household characteristics other than income were ob-tained from the Nova Scotia Atlee Perinatal Database (NSAPD), a registry that collects and compiles detailed maternal and perinatal health data for all births in the province by using trained personnel to extract information from antenatal and medical charts (as described else-where; [1]) in a reliable manner [35].
All singleton births in the province between 1988 and 2003 (n = 134 560) were included. Exclusions were then made where data were missing for key study variables, including income or any of the pregnancy outcomes (n = 16 632). Due to the low prevalence of several out-comes, enumeration areas with fewer than 50 births (n = 194) were excluded to avoid unstable or biased/unre-liable estimates. The number of unique births included in this analysis was 117 734.
Dependent variables
Adverse outcomes examined as dependent variables in this analysis include small- and large-for-gestational-age live birth (below the 3rd and greater or equal to the 90th percentile, respectively) [36], iatrogenic (i.e., delivery was induced or by cesarean delivery before the onset of labour) and spontaneous preterm birth (i.e., less than 37 weeks in both cases), perinatal death (including deaths between 22 weeks gestation and the end of the 7th day after deli-very) and post-neonatal death (including deaths occurring from 28 through 364 days after birth).
Independent variables
A partnership with Statistics Canada facilitated a confi-dential linkage with income tax-related information for the year in which delivery occurred using the T1 Family File [37]. The T1 Family File includes parent(s) and chil-dren living at the same address, but not persons living at the same address who are not in the family, including approximately 95% of all Canadians. The File aggregates income-related information from a variety of data re-cieved by the Canada Revenue Agency, including from all individuals who filed a tax return or who received a Canada Child Tax Benefit, children who filed a tax return and who reported the same address as their parent(s), as well as children and spouses who did not file their own tax return, but whose wage and salary information are available from other sources.
in Joseph et al. 2008 [1]); proportion of income from government transfers (including welfare payments, social security, and subsidies for businesses) as an indicator of relative reliance on redistributed income; total family in-come (after tax) below the Low Inin-come Measure (LIM) as an indicator of poverty [38]; whether any income was derived from investments as an indicator of wealth [39]; and whether any contributions were made to a Registered Retirement Savings Plan (RRSP) as an indicator of middle social class [40].
An index of neighborhood deprivation describing the enumeration area of residence of families was calculated based on information from the 1986 Census using a pre-viously described method [41]; this was the only inde-pendent variable included at the group level. The Atlee database was used to assign postal code of residence at the time of childbirth, which was linked to enumeration areas using the Statistics Canada Postal Code Conver-sion File. The deprivation index (range 0 to 5.3 across 606 enumeration areas, mean 1.8, SD 0.9) was converted into a percentile where higher values indicated higher levels of deprivation.
Other maternal and household characteristics that were reported in the NSAPD were examined as confounders: urban or rural place of residence and birth year; effect modifiers: urban or rural place of residence and single marital status (a proxy for female-headed lone parent fam-ily); or considered to be mediators and thus, not included in models measuring the full magnitude of income-related inequalities, including parity, pre-pregnancy weight, weight gain during pregnancy, maternal age, maternal smoking at delivery (a proxy for maternal smoking during pregnancy), gestational diabetes and prenatal class attendance.
Data analysis
Multiple logistic regression was used to examine rela-tionships between indicators of SEP and perinatal out-comes. We adjusted regression models for year of birth and residence in a rural or urban setting as potential confounders. Since our objective was to describe the magnitude of income disparities, we did not adjust for characteristics that may plausibly lie on the causal path-way between SEP and adverse perinatal outcomes (i.e., potential mediators), including parity, family parental composition, pre-pregnancy weight, weight gain during pregnancy, maternal age, maternal smoking at delivery, gestational diabetes, and prenatal class attendance [15].
In the second stage of the analysis, models for total fa-mily income (after tax) were further adjusted for neigh-borhood deprivation using fixed effects multilevel logistic regression models to examine the relative effects of house-hold SEP and neighbourhood deprivation.
Modification of gradients for family income and neigh-borhood deprivation on perinatal outcomes by urban or
rural place of residence, and by parental composition of families was assessed using a likelihood ratio test com-paring a base model to a model where effects for family income and neighborhood deprivation were stratified by one or the other of these potential effect modifiers
(α= 0.05).
All analyses were performed using SAS software (Cary, NC). The study was approved by the IWK Health Centre Research Ethics Board.
Results
Study population
Table 1 describes demographic characteristics and pre-valence of adverse perinatal outcomes. Less than half of families (43.5%) resided in a rural postal code. A female lone-parent headed approximately 20% of families. In 43% of cases, the mother was nulliparous, while 20% had had at least two previous children. Seventy-three percent of mothers reported not smoking during pregnancy, while 21% reported smoking at least 10 cigarettes per day during pregnancy. Approximately 40% of mothers reported at-tending prenatal classes during pregnancy, which includes multiparous women who may have attended classes dur-ing earlier pregnancies.
Total family income (after tax) was less than $20 760 in approximately 60% of families. Approximately 20% had an after tax family income at or above $28 267, and slightly fewer than 10% had after tax family income below the LIM. Fewer than a third of families received income from investments (27%) or made contribution to a RRSP (30%) during the year of delivery.
Large-for-gestational-age live birth was a relatively com-mon outcome (13%), while perinatal and post-neonatal death were rare (prevalence of 0.8% and 0.2%, res-pectively). Small-for-gestational-age live birth occurred in 3.4% of cases, while iatrogenic and spontaneous preterm birth occurred in 2.1% and 3.7% of cases respectively.
Magnitude of family income effects on adverse perinatal outcomes
Figure 1 presents the relationship between multiple indi-cators of SEP and adverse perinatal outcomes. There is a consistent association between lower SEP and higher odds ratios for SGA across all indicators of SEP, including a stepwise relationship for family income levels (before and after tax). For LGA, there was a similarly consistent pat-tern across all SEP indicators but in the opposite direction: that is, lower SEP was generally associated with protective odds ratios.
was observed i.e., families with middle income (i.e., in the 40th to 50th percentile) had protective odds ratios for postneonatal death. Similarly, higher odds ratios for spon-taneous preterm birth were found across most indicators of low SEP, although the relationship with family income Table 1 Maternal and family characteristics, income and
adverse perinatal outcomes of 117734 singleton births in Nova Scotia, Canada, 1988-2003
Frequency1(%) Maternal characteristics
Residence in a rural postal code
Yes 51193 (43.48)
Parental composition of family
Female-headed
lone-parent family2 24642 (20.93)
Two-parent family 93092 (79.07)
Pre-pregnancy weight (kg)
<55 25246 (23.99)
55 - <75 58119 (55.22)
75 - <90 14099 (13.40)
≥90 7778 (7.39)
Weight gained during pregnancy (kg)
0 -≤10.4 20497 (21.3)
20 - <25 26757 (22.73)
25 - <30 40027 (34)
30 - <35 30263 (25.7)
35 - <40 10305 (8.75)
≥40 1419 (1.21)
Smoking status (# of cigarettes per day at time of admission)
Non-smoker 79664 (73.07)
1 - <10 8704 (8.0)
10- 75 23029 (21.12)
Known smoker, amount unknown
1651 (1.51)
Table 1 Maternal and family characteristics, income and adverse perinatal outcomes of 117734 singleton births in Nova Scotia, Canada, 1988-2003(Continued)
Gestational diabetes ≥$5,990.92 < $9,119.4 11773 (10.00) ≥$9,119.4 < $14,997.34 23547 (20.00) ≥$14,997.34 < $20,759.95 23548 (20.00) ≥$20,759.95 < $28,266.83 23546 (20.00) ≥28,266.83 23547 (20.00) Total family income
(before tax)3
<$6,389 12125 (10.3)
≥$6,389 - < $9,418 12203 (10.36) ≥$9,418 - < $17,184 24176 (20.53) ≥$17,184 - < $25,361 24031 (20.41) ≥$25,361 - < $35,983 23313 (19.8)
≥$35,983 21886 (18.59)
Total family income (after tax) below the low income measure4
10973 (9.32)
No income from investments 86310 (73.31)
No contribution to Registered Retirement Savings Plan
82735 (70.27)
Adverse perinatal outcomes
Small-for-gestational-age live birth (<3rd percentile) 3934 (3.41)
Large-for-gestational-age live birth (>90th percentile) 15157 (13.13)
Iatrogenic pre-term birth (before 37 weeks)5 2316 (2.07)
Spontaneous pre-term birth (before 37 weeks) 4152 (3.66)
Post-neonatal death 197 (0.17)
Perinatal death 909 (0.77)
1
Subject number varied due to missing values.
2
Mother is not married or in a common-law relationship.
3
Income adjusted for family size and inflation, expressed in 2003 Canadian dollars
4
The Low Income Measure is fixed at 50% of median family income (after tax) adjusted for family size.
5
was not stepwise, i.e., only families with income <20th percentile (before and after tax) had elevated odds ratios. Also, a U-shaped gradient for proportion of income from government transfers was observed, i.e., families with middle income (i.e., in the 20th to 59th percentile) had protective odds ratios for spontaneous preterm birth.
In contrast, there were inconsistent associations bet-ween indicators of SEP and iatrogenic preterm birth. A U-shaped gradient for total family income (before and after tax) was observed, i.e., families with income in the 20th to 79th percentile were associated with lower risk of iatrogenic preterm birth. There was a similar protective association for this outcome among all families with pro-portion of income from government transfers above the 20th percentile. Lack of investment income and RRSP contributions were not associated with this outcome.
Perinatal death showed significantly decreased risk for all lower income groups compared to the highest income group and for all groups of proportionate income from government transfers compared to the lowest proportion.
Investment income, contributions to RRSP and total fa-mily income below the LIM demonstrated no associations with perinatal death.
Effects of neighborhood deprivation on adverse perinatal outcomes
In models co-adjusted for total family income (after tax) (Table 2), higher levels of material deprivation in the neighborhood of residence were associated with increased risk for SGA, iatrogenic and spontaneous preterm birth and perinatal death. A U-shaped gradient appeared for LGA across quartiles of neighborhood deprivation, with relatively lower risk for families in the inter-quartile range. There was no association between neighborhood material deprivation and post-neonatal death.
In general, the pattern of effects by family income did not substantively change after controlling for neighbor-hood deprivation. The borderline significant increased risk for spontaneous preterm birth in the lowest quintile
of family income was diminished and no longer statisti-cally significant in co-adjusted models.
Modification of effects by parental composition of family
Figures 2a through Figure 2c present those outcomes for which there was a statistically significant improvement in model fit when stratifying effects in the co-adjusted model by parental composition of family. All patterns are visualized with two parent families having a total after tax income above the 80th percentile and living in neighbourhoods below the 25th percentile of neighbour-hood material deprivation as the reference groups.
The protective gradient in LGA across lower total family income remained for families headed by a lone parent (Figure 2a), while no clear family income gradient in odds ratio was observed among two parent families. By contrast, a weak U-shaped pattern in odds ratios for material deprivation was found for LGA among two par-ent families, while a gradipar-ent of protective odds ratios emerged among female-headed lone parent families in neighbourhoods with lower deprivation.
In Figure 2b, odds ratios for spontaneous preterm birth among female-headed lone parent families were particularly elevated among those with total family in-come between the 40th and 79th percentiles. In contrast, Odds ratios for two parent families were under 1.0 and all 95% confidence intervals included 1.0 except for families at the 40-59th percentile. For neighborhood material deprivation, female-headed lone-parent families had uniformly high odds ratios across all levels of neigh-borhood deprivation. Odds ratios were elevated for two parent families as well but odds ratios decreased as neighborhood deprivation levels decreased.
Parental composition modified the effect of total fa-mily income on perinatal death (Figure 2c). Odds ratios for female-headed lone-parent families were protective for this outcome at the lowest end of total family in-come. For two parent families, odds ratio were uniformly below 1.0 for all income groups relative to two parent families above the 80th percentile. Modification of the effect of neighborhood material deprivation on perinatal death showed a very different pattern; odds ratios were uniformly high across all deprivation levels for female-headed lone-parent families, whereas among two parent families, odds ratios were only elevated for those resid-ing in neighborhoods with high levels of deprivation.
Modification of effects by place of residence
Figures 3a and b highlight statistically significant effect modification in household and neighbourhood gradients by urban and rural place of residence, with urban fa-milies having a total after tax income above the 80th percentile and living in neighbourhoods below the 25th
percentile of neighbourhood material deprivation as the reference groups.
While a stepwise decrease in odds ratios for large-for-gestational-age live birth was observed across decreasing levels of family income in the total population, Figure 3a indicates a steeper positive income gradient among rural compared to urban families. Odds ratios for large-for-gestational-age live birth were larger in urban neighbor-hoods with higher deprivation, while there were generally protective odds ratios for living in higher deprivation neighborhoods in urban settings.
Figure 3b indicates increased odds ratios for spon-taneous preterm birth in neighbourhoods of higher de-privation. Odds ratios were significantly elevated for urban families with deprivation above the median; where odds ratios were only significantly elevated for rural fami-lies in the highest quartile of neighbourhood deprivation.
Discussion and conclusions
We sought to explore the relationship between SEP, measured using different indicators at the family and neighborhood levels, and perinatal outcomes in this popu-lation-based sample that was linked to a rich set of indica-tors on income and census data. Our findings suggest that the income-related indicators did not always have consis-tent patterns of association with the perinatal outcomes, and in some instances, such as for spontaneous preterm birth, had contradictory findings. Both individual level income and neighborhood level deprivation, when con-sidered together, were significant predictors for most of the perinatal outcomes we examined.
For all outcomes examined in this study, there were consistent, nearly identical patterns for total family income after tax and before tax with all perinatal out-comes. The other individual-level SEP variables did not always have relationships to the outcomes that mirrored that of the total family income variables. For example, having a medium proportion of income from government transfers was risk-protective for spontaneous preterm birth and for postneonatal death; whereas lower income based on other variables conferred higher risk for these outcomes. While most income variables likely reflect the resources available to the families, a variable like propor-tion of income from government transfers did not take into account the absolute family income levels which may, in part, be contributing to the different patterns for SGA, spontaneous preterm and postneonatal death.
Table 2 Relationship of total family income (after tax) and neighbourhood deprivation with adverse perinatal outcomes among 117734 singleton births in Nova Scotia, Canada, 1988-2003
Perinatal outcomes Socioeconomic domains Crude OR (95% CI)1 Adjusted OR (95% CI)1
Small-for-gestational-age live birth Total family income (Percentile)
<10th (Lowest) 2.11 (1.87 - 2.37) 2.00 (1.78 - 2.26)
10th-19th 2.02 (1.79 - 2.28) 1.91 (1.69 - 2.17)
20th-39th 1.67 (1.50 - 1.86) 1.59 (1.42–1.77)
40th-59th 1.29 (1.5 - 1.44) 1.25 (1.11 - 1.39)
60th-79th 1.02 (0.91 - 1.15) 1.0 (0.89 - 1.12)
≥80th (Highest) 1.002 1.002
Neighbourhood deprivation index3(Percentile)
≥75th (Lowest) - 1.18 (1.07-1.30)
50th-74th - 1.23 (1.11-1.35)
25th-49th - 1.11 (1.01-1.23)
<25th (Highest) - 1.002
Large-for-gestational-age live birth Total family income (Percentile)
<10th (Lowest) 0.72 (0.67 - 0.77) 0.72 (0.67 - 0.78)
10th-19th 0.73 (0.68 - 0.78) 0.74 (0.69 - 0.79)
20th-39th 0.86 (0.82 - 0.91) 0.86 (0.82 - 0.91)
40th-59th 0.99 (0.94 - 1.05) 1.0 (0.95 - 1.06)
60th-79th 1.03 (0.98 - 1.09) 1.04 (0.98 - 1.06)
≥80th (Highest) 1.002 1.002
Neighbourhood deprivation index3(Percentile)
≥75th (Lowest) - 0.97 (0.92-1.02)
50th-74th - 0.92 (0.87-0.96)
25th-49th - 0.91 (0.87-0.95)
<25th (Highest) - 1.002
Iatrogenic preterm birth Total family income (Percentile)
<10th (Lowest) 0.95 (0.81 - 1.11) 0.91 (0.78 - 1.07)
10th-19th 0.91 (0.78 - 1.06) 0.87 (0.74–1.02)
20th-39th 0.90 (0.79–1.03) 0.87 (0.76–1.00)
40th-59th 0.82 (0.72 - 0.93) 0.80 (0.70 - 0.91)
60th-79th 0.94 (0.82–1.06) 0.92 (0.81–1.05)
≥80th (Highest) 1.002 1.002
Neighbourhood deprivation index3(Percentile)
≥75th (Lowest) - 1.15 (1.02-1.31)
50th-74th - 1.10 (0.97-1.24)
25th-49th - 1.05 (0.93-1.19)
<25th (Highest) - 1.002
Spontaneous preterm birth Total family income (Percentile)
<10th (Lowest) 1.15 (1.02 - 1.29) 1.09 (0.97 - 1.23)
10th-19th 1.17 (1.05 - 1.32) 1.11 (0.99 - 1.25)
20th-39th 0.97 (0.88 - 1.07) 0.93 (0.84 - 1.03)
40th-59th 0.9 (0.82–1.0) 0.88 (0.79 - 0.97)
60th-79th 1.0 (0.9 - 1.1) 0.98 (0.89 - 1.08)
total family income compared to those in the highest in-come category, while higher levels of neighborhood deprivation were associated with elevated risk for these outcomes. Such findings suggest that the two indicators of SEP may be operating through different pathways, at least for those outcomes. Neighborhood deprivation likely mea-sured a wide range of social variables that went beyond income levels of neighborhood residents (e.g., see [30,42]). Further research is needed to delineate the relevant path-ways and mechanisms involved in these discordant findings.
Our findings also illustrated how family composition and level of urbanicity modify the associations between
SEP and the some of the outcomes. The patterns of asso-ciation between SEP and LGA, spontaneous preterm birth and perinatal death varied depending on family compos-ition or urbanicity. This too suggests that the importance of certain pathways and mechanisms may vary by context.
These findings are from a Canadian setting with single payer universal health coverage for all essential healthcare services, so we expect there to be some generalizability for other settings with universal coverage like the United Kingdom. Whereas in other settings like the United States, where the quality of antenatal care may be com-mensurate with the level of family income, we might ex-pect income to be a stronger determinant of perinatal
Table 2 Relationship of total family income (after tax) and neighbourhood deprivation with adverse perinatal outcomes among 117734 singleton births in Nova Scotia, Canada, 1988-2003(Continued)
Neighbourhood deprivation index3(Percentile)
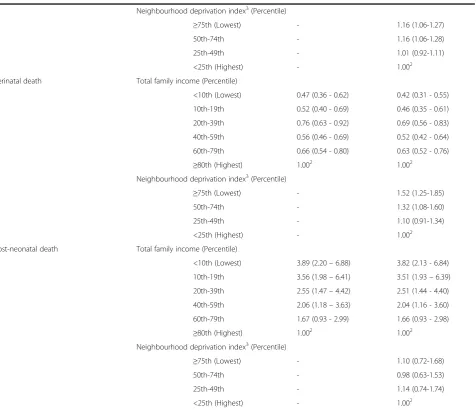
≥75th (Lowest) - 1.16 (1.06-1.27)
50th-74th - 1.16 (1.06-1.28)
25th-49th - 1.01 (0.92-1.11)
<25th (Highest) - 1.002
Perinatal death Total family income (Percentile)
<10th (Lowest) 0.47 (0.36 - 0.62) 0.42 (0.31 - 0.55)
10th-19th 0.52 (0.40 - 0.69) 0.46 (0.35 - 0.61)
20th-39th 0.76 (0.63 - 0.92) 0.69 (0.56 - 0.83)
40th-59th 0.56 (0.46 - 0.69) 0.52 (0.42 - 0.64)
60th-79th 0.66 (0.54 - 0.80) 0.63 (0.52 - 0.76)
≥80th (Highest) 1.002 1.002
Neighbourhood deprivation index3(Percentile)
≥75th (Lowest) - 1.52 (1.25-1.85)
50th-74th - 1.32 (1.08-1.60)
25th-49th - 1.10 (0.91-1.34)
<25th (Highest) - 1.002
Post-neonatal death Total family income (Percentile)
<10th (Lowest) 3.89 (2.20–6.88) 3.82 (2.13 - 6.84)
10th-19th 3.56 (1.98–6.41) 3.51 (1.93–6.39)
20th-39th 2.55 (1.47–4.42) 2.51 (1.44 - 4.40)
40th-59th 2.06 (1.18–3.63) 2.04 (1.16 - 3.60)
60th-79th 1.67 (0.93 - 2.99) 1.66 (0.93 - 2.98)
≥80th (Highest) 1.002 1.002
Neighbourhood deprivation index3(Percentile)
≥75th (Lowest) - 1.10 (0.72-1.68)
50th-74th - 0.98 (0.63-1.53)
25th-49th - 1.14 (0.74-1.74)
<25th (Highest) - 1.002
1
Odds ratio and 95% confidence interval; models are adjusted for potential confounders, including residence in a rural versus urban postal code and birth year.
2
Reference group.
3
0.40 0.50 0.60 0.70 0.80 0.90 1.00 1.10 1.20
≥75th 50th - 74th 25th - 49th <25th
Odds Ratio
Neighbourhood Material Deprivation Index (Pct) 0.20
0.40 0.60 0.80 1.00 1.20 1.40 1.60
<10th 10th - 19th 20th - 39th 40th - 59th 60th - 79th ≥80th
Odds Ratio
Total Family Income (Pct)
* Reference Group
Female-headed lone-parent family
Two parent family
*
*
(Lowest) (Highest)
(Lowest) (Highest)
0.80 1.00 1.20 1.40 1.60 1.80
≥75th 50th - 74th 25th - 49th <25th
Od
d
s
R
a
tio
Neighbourhood Material Deprivation Index (Pct) 0.20
0.60 1.00 1.40 1.80 2.20 2.60
<10th 10th - 19th 20th - 39th 40th - 59th 60th - 79th ≥80th
Odds Ratio
Total Family Income (Pct)
* Reference Group
*
* Female-headed lone-parent family Two parent family
(Lowest) (Highest)
(Lowest) (Highest)
0.60 1.00 1.40 1.80 2.20 2.60 3.00
≥75th 50th - 74th 25th - 49th <25th
Odds Ratio
Neighbourhood Material Deprivation Index (Pct) 0.20
0.60 1.00 1.40 1.80 2.20 2.60 3.00
<10th 10th - 19th 20th - 39th 40th - 59th 60th - 79th ≥80th
Odds Ratio
Total Family Income (Pct)
* Reference Group
Female-headed lone-parent family
Two parent family
*
*
(Lowest) (Highest)
(Lowest) (Highest)
a
b
c
outcomes, and so we might expect inequalities to be of a larger magnitude than we report.
There were limitations of our data and approach. First, not all birth records were linked to data on the income variables; linkage was successful in 81.3% of records [43]. Thus, the extent to which the failure to link may have contributed to an over or underestimate of the associations is not known. Also, some families were missing data on SGA (2%), LGA (2%) and preterm birth outcomes (iatrogenic, 5%; spontaneous 4%). Families excluded from the analysis here were less likely to be of
higher SEP or to reside in lower deprivation neighbour-hoods. For all outcomes, the difference in income and deprivation composition within strata was less than 7%, and usually less than 4% (data not shown). It is not pos-sible to predict the direction of bias; however, given the small size of these differences, any impact on the magni-tudes reported here are likely to be minimal.
Second, the use of cross sectional data meant that data on total family income (after tax) were for the same year as the year of birth, raising questions about the direction of the association; however, for studies of pregnancy it is
0.60 0.70 0.80 0.90 1.00 1.10 1.20
≥75th 50th - 74th 25th - 49th <25th
Odds Ratio
Neighbourhood Material Deprivation Index (Pct) 0.40
0.50 0.60 0.70 0.80 0.90 1.00 1.10 1.20
<10th 10th - 19th 20th - 39th 40th - 59th 60th - 79th ≥80th
Odds Ratio
Total Family Income (Pct)
Rural
Urban
*
*
* Reference Group
(Lowest) (Highest)
(Lowest) (Highest)
0.60 0.80 1.00 1.20 1.40 1.60
≥75th 50th - 74th 25th - 49th <25th
Od
ds Ratio
Neighbourhood Material Deprivation Index (Pct)
Rural
Urban
*
* Reference Group
(Lowest) (Highest)
0.60 0.80 1.00 1.20 1.40 1.60
≥75th 50th - 74th 25th - 49th <25th
Od
ds Ratio
Neighbourhood Material Deprivation Index (Pct)
Rural
Urban
*
* Reference Group
(Lowest) (Highest)
a
b
unlikely that the outcome influenced the levels of income for the family. Finally, while SEP may reflect a range of causal mechanisms at the group level in health research, including the level of material deprivation, income in-equality, social capital and racial segregation (e.g., [42]), we only assessed the magnitude of inequalities relative to a measure of material deprivation in the neighbourhood in this study.
Our main conclusions are that the choice of income indicator may influence the magnitude and pattern of inequality observed. In some instances, such as for iatro-genic and spontaneous preterm birth, some of the indica-tors of individual level SEP may contradict each other in terms of whether higher income is risk inducing or pro-tective for the outcome. Thus, choosing indicators of SEP that are consistent with the purpose of the investigation is critical for the examination of inequities in perinatal health. Also, because the patterns of inequities may vary by context–family composition or urbanicity–examination of effect modification should be a priority in future stu-dies. As with all analyses that demonstrate gaps and in-equalities, a critical next step is to investigate why these inequalities exist and what factors, with intervention po-tential, can be identified so that effective programs and policies can be designed and implemented. This is but a first step in that larger research agenda to uncover stra-tegies to address to continue the trend of reducing the gap in in perinatal health in Canada [44].
Abbreviations
LGA:Large for gestational age; LIM: Low income measure; NSAPD: Nova scotia atlee perinatal database; RRSP: Registered retirement savings plan; SEP: Socioeconomic position; SGA: Small for gestational age.
Competing interests
The authors declare that they have no competing interests.
Authors’contributions
KS conceptualized and designed the analyses, oversaw the interpretation of findings, conducted the statistical analysis, drafted the initial manuscript, and reviewed and revised the final manuscript. POC conceptualized and designed the analyses, assisted with interpretation of findings, and reviewed and revised the final manuscript. JM conducted the background literature review, revised and edited the manuscript and finalized the submission for publication. LD gave input into the design of the analyses, assisted with interpretation of findings, and reviewed and revised the final manuscript. JF gave input into the design of the analyses, assisted with interpretation of findings, and reviewed and revised the final manuscript. KSJ gave input into the design of the analyses, assisted with interpretation of findings, and reviewed and revised the final manuscript. VMA gave input into the design of the analyses, assisted with interpretation of findings, and reviewed and revised the final manuscript. All authors read and approved the final manuscript.
Acknowledgements
We thank the Small Area and Administrative Data Division of Statistics Canada, especially Bill Steele, Benjamin Lister, Mark Bonenfant, and Mary Frances Lawlis, for data linkage and analysis. We also thank the Reproductive Care Program of Nova Scotia for access to the NSAPD. This study was funded by grant no. MOP-82806 from the Canadian Institutes of Health Research.
Author details 1
Department of Psychology, Wilfrid Laurier University, 75 University Avenue West, Waterloo, Ontario, Canada.2Centre for Research on Inner City Health, St. Michael’s Hospital and Dalla Lana School of Public Health, University of Toronto, Toronto, Ontario, Canada.3Department of Obstetrics and Gynaecology, Dalhousie University, Halifax, Nova Scotia, Canada. 4Reproductive Care Program of Nova Scotia, Halifax, Nova Scotia, Canada. 5
Department of Obstetrics & Gynaecology, School of Population and Public Health, University of British Columbia and the Children’s and Women’s Hospital of British Columbia, Vancouver, British Columbia, Canada. 6Department of Paediatric Medicine, Hospital for Sick Children, Toronto, Ontario, Canada.
Received: 7 June 2013 Accepted: 18 February 2014 Published: 4 March 2014
References
1. Joseph KS, Liston RM, Dodds L, Dahlgren L, Allen AC:Socioeconomic status and perinatal outcomes in a setting with universal access to essential health care services.CMAJ2007,177(6):583–590.
2. Andrade CL, Szwarcwald CL, Gama SG, Leal Mdo C:Socioeconomic inequalities and low birth weight and perinatal mortality in Rio de Janeiro, Brazil.Cad Saude Publica2004,20(Suppl 1):S44–S51.
3. Hayward I, Malcoe LH, Cleathero LA, Janssen PA, Lanphear BP, Hayes MV, Mattman A, Pampalon R, Venners SA:Investigating maternal risk factors as potential targets of intervention to reduce socioeconomic inequality in small for gestational age: a population-based study.BMC Public Health
2012,12:333.
4. McElroy JA, Bloom T, Moore K, Geden B, Everett K, Bullock LF:Perinatal mortality and adverse pregnancy outcomes in a low-income rural population of women who smoke.Birth Defects Res A Clin Mol Teratol
2012,94(4):223–229.
5. Messer LC, Vinikoor LC, Laraia BA, Kaufman JS, Eyster J, Holzman C, Culhane J, Elo I, Burke JG, O'Campo P:Socioeconomic domains and associations with preterm birth.Soc Sci Med2008,7:1247–1257. Social Science & Medicine, 2008.7: p. 1247–1257.
6. Harper S, King NB, Meersman SC, Reichman ME, Breen N, Lynch J:Implicit value judgements in the measurement of health inequalities. Milbank Memorial Fund2010,88(1):4–29.
7. Regidor E:Measures of health inequalities: part 1.J Epidemiol Community Health2004,58:858–861.
8. Auger N, Giraud J, Daniel M:The joint influence of area income, income inequality, and immigrant density on adverse birth outcomes: a population-based study.BMC Public Health2009,9:237.
9. Buka SL, Brennan RT, Rich-Edwards JW, Raudenbush SW, Earls F:Neighborhood support and the birth weight of urban infants.Am J Epidemiol2003,157:1–8. 10. Farley TA, Mason K, Rice J, Habel JD, Scribner R, Cohen DA:The relationship
between the neighbourhood environment and adverse birth outcomes. Paediatr Perinat Epidemiol2006,20:188–200.
11. Luo ZC, Kierans WJ, Wilkins R, Liston RM, Mohamed J, Kramer MS, British Columbia Vital Statistics Agency:Disparities in birth outcomes by neighborhood income: temporal trends in rural and urban areas, British Columbia.Epidemiology2004,15:679–686.
12. Luo ZC, Wilkins R, Kramer MS, Fetal and Infant Health Study Group of the Canadian Perinatal Surveillance System:Effect of neighbourhood income and maternal education on birth outcomes: a population-based study. Can Med Assoc J2006,174:1415–1420.
13. Masi CM, Hawkley LC, Piotrowski ZH, Pickett KE:Neighborhood economic disadvantage, violent crime, group density, and pregnancy outcomes in a diverse, urban population.Soc Sci Med2007,65:2440–2457.
14. O’Campo P, Xue X, Wang MC, Caughy M:Neighborhood risk factors for low birthweight in Baltimore: a multilevel analysis.Am J Public Health
1997,87:1113–1118.
15. O’Campo P, Burke JG, Culhane J, Elo IT, Eyster J, Holzman C, Messer LC, Kaufman JS, Laraia BA:Neighborhood deprivation and preterm birth among non-hispanic black and white women in eight geographic areas in the United States.Am J Epidemiol2008,167(2):155–163.
17. Poeran J, Denktas S, Birnie E, Bonsel GJ, Steegers EA:Urban perinatal health inequalities.J Matern Fetal Neonatal Med2011,24(4):643–646. 18. Schempf A, Strobino D, O'Campo P:Neighborhood effects on birthweight:
an exploration of psychosocial and behavioral pathways in Baltimore, 1995–1996.Soc Sci Med2009,68:100–110.
19. Luo ZC, Kierans WJ, Wilkins R, Liston RM, Mohamed J, Kramer MS, British Columbia Vital Statistics Agency:Disparities in birth outcomes by neighborhood income: temporal trends in rural and urban areas, british columbia.Epidemiology2004,15(6):679–686.
20. Veugelers PJ, Yip AM, Elliot DC:Geographic variation in health services use in Nova Scotia.Chronic Dis Can2003,24(4):116–123.
21. Ambert A:One Parent Families: characteristics, causes, consequences, and issues.InContemporary Family Trends.The Vanier Institute of the Family: Ottawa, ON; 2006.
22. Statistics Canada:Family Income, by Family Type (Lone-Parent Families).
Summary Tables October 2, 2013 December 1, 2013]; Available from: /l01/ cst01/famil106b-eng.htm.
23. Statistics Canada:Family Income, by Family Type (Couple Families).Summary Tables October 2, 2013 December 1, 2013]; Available from: /l01/cst01/ famil106a-eng.htm.
24. Friedrichs J, Blasius J:Social norms in distressed neighbourhoods: testing the wilson hypothesis.Housing Stud2003,18(6):807–826.
25. Pattenden S, Dolk H, Vrijheid M:Inequalities in low birth weight: parental social class, area deprivation, and“lone mother”status.J Epidemiol Community Health1999,53(6):355–358.
26. Lawson A, Rhode DL:The Politics of Pregnancy: Adolescent Sexuality and Public Policy.1995.
27. Martens PJ, Brownell M, Au W, MacWilliam L, Prior H, Schultz J, Guenette W, Elliott L, Buchan S, Anderson M, Caetano P, Metge C, Santos R, Serwonka K:
Health Inequities in Manitoba: Is the Socioeconomic Gap Widening or Narrowing Over Time?.Winnipeg: Manitoba Centre for Health Policy; 2010. 28. Smith DM, Elander J:Effects of area and family deprivation on risk factors
for teenage pregnancy among 13-15-year-old girls.Psychol Health Med
2006,11(4):399–410.
29. Stonehocker D:Bonnyville Teen Pregnancy Research Report.Lakeland Regional Health Authorities: Bonnyville; 1997.
30. Shankardass K, Dunn JR:How goes the neighbourhood? Rethinking neighbourhoods and health research in social epidemiology.In
Rethinking Social Epidemiology: Towards a Science of Change.Edited by O’Campo P, Dunn JR. Dordrecht, Netherlands: Springer Science + Business Media B.V; 2012:137–156.
31. Nova Scotia Department of Health:Smoking in Nova Scotia (Cycle 2.1, Report 1), in Canadian Community Health Survey Topics.Halifax, NS: Nova Scotia Department of Health; 2004.
32. Weaver K, Campbell R, Mermelstein R, Wakschlag L:Pregnancy smoking in context: the influence of multiple levels of stress.Nicotine Tob Res2008,
10(6):1065–1073.
33. Fryzuk LA:Environmental justice in Canada: an empirical study and analysis of the demographics of dumping in Nova Scotia.InSchool for Resource and Environmental Studies.Halifax, NS: Dalhousie University; 1996:203.
34. Thompson SJ:Environmental justice in a toxic economy: community struggles with environmental health disorders in Nova Scotia.InAdult Education and Counselling Psychology.Toronto, ON: OISE/University of Toronto; 2002:406.
35. Fair M, Cyr M, Allen A, Wen SW, Guyon G, MacDonald R:Validation Study for a Record Linkage of Births and Infant Deaths in Canada.Ottawa, ON: Statistics Canada; 1999.
36. Kramer MS, Platt RW, Wen SW, Joseph KS, Allen A, Abrahamowicz M, Blondel B, Bréart G, Fetal/Infant Health Study Group of the Canadian Perinatal Surveillance System:A new and improved population-based Canadian reference for birth weight for gestational age.Pediatrics2001,
108(2):E35.
37. Statistics Canada:Annual Estimates for Census Families and Individuals (T1 Family File).2013. Available from: http://www23.statcan.gc.ca/imdb/p2SV. pl?Function=getSurvey&SDDS=4105.
38. Giles P:Low Income Measurement in Canada.InIncome Research Paper Series.Edited by Income Statistics Division. Ottawa, ON: Statistics Canada; 2004. 39. Zogby J:Who Belongs To The“Investor Class”?InForbes.com.New York,
NY: Forbes.com LLC; 2009.
40. Maser K:Who’s Saving for Retirement?InPerspectives.Ottawa, ON: Statistics Canada; 1995.
41. Matheson FI, Moineddin R, Dunn JR, Creatore MI, Gozdyra P, Glazier RH:
Urban neighborhoods, chronic stress, gender and depression.Soc Sci Med2006,63(10):2604–2616.
42. Shankardass K, Jerrett M, Milam J, Richardson J, Berhane K, McConnell R:
Social environment and asthma: associations with crime and no child left behind programmes.J Epidemiol Community Health2011,
65(10):859–865.
43. Joseph KS, Fahey J, Dendukuri N, Allen VM, O'Campo P, Dodds L, Liston RM, Allen AC:Recent changes in maternal characteristics by socioeconomic status.J Obstet Gynaecol Can2009,31(5):422–433.
44. Dzakpasu S, Joseph KS, Kramer MS, Allen AC:The Mathew effect: infant mortality in Canada and internationally.Pediatrics2000,106:e5.
doi:10.1186/1471-2393-14-96
Cite this article as:Shankardasset al.:Magnitude of income-related disparities in adverse perinatal outcomes.BMC Pregnancy and Childbirth
201414:96.
Submit your next manuscript to BioMed Central and take full advantage of:
• Convenient online submission
• Thorough peer review
• No space constraints or color figure charges
• Immediate publication on acceptance
• Inclusion in PubMed, CAS, Scopus and Google Scholar
• Research which is freely available for redistribution