R E S E A R C H A R T I C L E
Open Access
Effects of socioeconomic position and clinical risk
factors on spontaneous and iatrogenic preterm
birth
KS Joseph
1*, John Fahey
2, Ketan Shankardass
3, Victoria M Allen
4, Patricia O
’
Campo
5, Linda Dodds
6,
Robert M Liston
7and Alexander C Allen
6Abstract
Background:The literature shows a variable and inconsistent relationship between socioeconomic position and preterm birth. We examined risk factors for spontaneous and iatrogenic preterm birth, with a focus on
socioeconomic position and clinical risk factors, in order to explain the observed inconsistency.
Methods:We carried out a retrospective population-based cohort study of all singleton deliveries in Nova Scotia from 1988 to 2003. Data were obtained from the Nova Scotia Atlee Perinatal Database and the federal income tax T1 Family Files. Separate logistic models were used to quantify the association between socioeconomic position, clinical risk factors and spontaneous preterm birth and iatrogenic preterm birth.
Results:The study population included 132,714 singleton deliveries and the rate of preterm birth was 5.5%. Preterm birth rates were significantly higher among the women in the lowest (versus the highest) family income group for spontaneous (rate ratio 1.14, 95% confidence interval (CI) 1.03, 1.25) but not iatrogenic preterm birth (rate ratio 0.95, 95% CI 0.75, 1.19). Adjustment for maternal characteristics attenuated the family income-spontaneous preterm birth relationship but strengthened the relationship with iatrogenic preterm birth. Clinical risk factors such as hypertension were differentially associated with spontaneous (rate ratio 3.92, 95% CI 3.47, 4.44) and iatrogenic preterm (rate ratio 14.1, 95% CI 11.4, 17.4) but factors such as diabetes mellitus were not (rate ratio 4.38, 95% CI 3.21, 5.99 for spontaneous and 4.02, 95% CI 2.07, 7.80 for iatrogenic preterm birth).
Conclusions:Socioeconomic position and clinical risk factors have different effects on spontaneous and iatrogenic preterm. Recent temporal increases in iatrogenic preterm birth appear to be responsible for the inconsistent relationship between socioeconomic position and preterm birth.
Keywords:Spontaneous preterm birth, Iatrogenic preterm birth, Risk factors, Pregnancy complications, Socioeconomic status
Background
Factors such as multi-fetal pregnancy, congenital malfor-mations, older maternal age and race/ethnicity are strongly associated with preterm birth [1-4]. However, the relationship between socioeconomic position and pre-term birth is variable and inconsistent, especially when compared with the relationship between socioeconomic
position and small-for-gestational age (SGA) [5]. Further, the inconsistency in the relationship between socioeco-nomic position and preterm birth is evident irrespective of whether socioeconomic position is measured using in-come, education, occupation or area-based measures [5].
Another interesting aspect of the relationship between socioeconomic position and preterm birth is the docu-mented temporal change in the association. For instance, in 1989, preterm birth rates among less educated women in the United States [6] were 73% (95% confidence inter-val (CI) 63, 83%) higher than preterm birth rates among more educated women, whereas in 2006 the excess risk * Correspondence:KSJoseph@cfri.ca
1
Department of Obstetrics and Gynaecology and the School of Population and Public Health, University of British Columbia and the Children’s and Women’s Hospital of British Columbia, 4500 Oak Street, Vancouver, British Columbia V6H 3 N1, Canada
Full list of author information is available at the end of the article
was reduced to 31% (95% CI 22, 40%). A similar phe-nomenon was observed in New Zealand, where the strong socioeconomic gap in preterm birth rates ob-served in the 1980s disappeared by the turn of the century [7]. Some attenuation of the socioeconomic gap in preterm birth has also been observed in Denmark and Finland [8].
We hypothesized that the heterogeneity of preterm birth may constitute one potential explanation for the inconsistent and variable relation between socioeco-nomic position and preterm birth. It is possible that spatial and temporal variations in the frequency of the preterm birth subtypes, namely, spontaneous preterm birth (following preterm labour) and iatrogenic preterm birth (following labour induction or cesarean delivery before labour onset), or temporal changes in clinical risk factors (e.g., older maternal age and complications of pregnancy) for these subtypes of preterm birth underlie the vagaries of the socioeconomic position–preterm birth relationship.
The Canadian setting is likely ideal for examining po-tential changes in the relationship between socioeco-nomic position, obstetric intervention and preterm birth subtypes, given universal health insurance coverage for obstetric and related medical services. We there-fore carried out a study to examine the determinants of spontaneous and iatrogenic preterm birth, with a focus on the effect of socioeconomic position and clinical risk factors.
Methods
The study cohort included all live births and stillbirths to residents of Nova Scotia, Canada between 1988 and 2003. Detailed information for the study was ob-tained from the Nova Scotia Atlee Perinatal Database, a population-based database which contains information on maternal characteristics, labor and delivery events, and neonatal diagnoses and procedures. The database is collated from information abstracted from antenatal and medical charts by trained personnel using standardized forms. An ongoing data-quality assurance program, which conducts periodic abstraction studies, and valid-ation studies [9,10] have shown the data to be accurate and reliable.
Births with a birth weight <500 g or a gestational age <20 weeks were excluded to avoid potential bias due to changes in the registration of births at the border-line of viability [11,12]. A confidential linkage between the Nova Scotia Atlee Perinatal Database (1988 to 2003) and federal income tax (T1 Family File) records (1988 to 2003) was carried out to supplement the clinical in-formation in the database with inin-formation on socio-economic position (reported previously [13]). The T1 Family Files, which are maintained by the Small Area
and Administrative Data Division of Statistics Canada in Ottawa, were created from several administrative data sources, with income tax returns serving as the primary source [14]. The linkage was carried out using determin-istic and probabildetermin-istic methods and resulted in a success-ful linkage of 135,945 of 167,187 (81.3%) of the births. All linkages and analyses were carried out by Small Area and Administrative Data Division personnel in secure offices. Tabular analyses involving income and related informa-tion that resulted in cells with fewer than 15 were sup-pressed, and all tabulated counts were rounded to the nearest 10. However, regression analyses were carried out without such restrictions.
Annual after-tax family income for each woman (in the year of delivery) was based on the T1 Family Files and ad-justed for family size. The latter calculation was carried out by dividing the total family income by the weighted number of family members. Weights were based on a standard formula (the oldest adult in the family received a weight of 1, other members 16 years or older and the first child in a single parent family received a weight of 0.4, and children under 16 years received a weight of 0.3) [15]. Family income was also adjusted for inflation (expressed in 1988 Canadian dollars) and categorized to yield five approximately equal groups. The quintile with the lowest family income was then further subdivided (in order to obtain a potentially more vulnerable group) and this resulted in a total of six family income categories (< $4,430, $4,430–$6,529, $6,530–$11,914, $11,915– $17,584, $17,585–$24,949, and≥$24,950). Contribu-tion to a retirement savings plan (RSP, a tax-deductible investment) in the year of delivery was also examined as a second measure of socioeconomic position. This measure was used as an indicator of behavior related to tax-planning and long-term saving and was expected to reflect a dimension of socioeconomic status that was dis-tinct from family income [16].
Rates of preterm birth <37 completed weeks gestation and preterm birth <32 completed weeks among single-tons (N = 132,714) were examined within categories of family income and contribution to a retirement savings plan. Gestational age was based on the duration between the last menstrual period and the delivery if it was con-sistent with the neonatal physical examination of the infant and based on the neonatal physical examination in cases where the discrepancy between the 2 methods of gestational age ascertainment was 3 weeks or greater. Preterm births were categorised as iatrogenic if labor was induced or if a cesarean delivery was carried out in the absence of labor, and as spontaneous otherwise.
non-independence of observations among births to the same women using generalized estimating equations. The first of the three models provided the crude effects of socioeconomic position and included family income and contribution to a retirement savings plan as the independent variates and spontaneous (or iatrogenic) preterm birth as the dependent variate. The second set of logistic models were used to assess the effect of family income and contribution to a retirement sav-ings plan after adjustment for extraneous maternal characteristics that could have confounded the socio-economic position-spontaneous/iatrogenic preterm birth relation (namely, maternal age, parity, marital status, resi-dence, pre-pregnancy weight, smoking status, previous cesarean delivery, previous low birth weight, previous perinatal death and calendar period). The last of the 3 models also included medical complications of pregnancy (gestational hypertension, pre-existing hypertension, gestational diabetes, diabetes mellitus, other chronic medical disease, placenta previa and placental abruption). Other chronic medical disease included cardiovascular disorders, renal disease, gastrointestinal disorders, re-spiratory disease, endocrine disorders, neurologic disease, blood dyscrasias and miscellaneous illnesses. This most proximal set of potential confounders was added last because some potentially lie in the causal pathway be-tween maternal characteristics and spontaneous/iatrogenic preterm birth. Since rates of preterm birth and its sub-types (e.g., spontaneous/iatrogenic preterm, preterm birth <32 weeks) were rare, the odds ratios from the logis-tic models were considered to approximate proportion type rate ratios. The statistical significance of differences in the odds ratios expressing the effect of a risk factor on spontaneous preterm birth vs iatrogenic preterm birth was assessed using a Chi-square test for the heterogeneity [17]. Analysis was carried out using SAS software (Cary, NC) and the study was approved by the IWK Health Centre Research Ethics Board.
Results
Maternal characteristics such as age, parity, marital sta-tus, rural residence, pre-pregnancy weight and smoking status varied by family income and RSP status (Figure 1). For instance, 34.9% of mothers in the lowest family in-come category were <20 years age compared with 1.0% of mothers in the highest family income group (Table 1). On the other hand, 18.6% of mothers in the highest fam-ily income group were > = 35 years of age compared with only 4.8% of mothers in the lowest family income category. Such differences were also evident in contrasts by RSP contribution in the year of delivery (Table 1).
The overall rate of preterm birth (<37 weeks) was 5.5%; the rate of spontaneous preterm birth was 4.7% and the rate of iatrogenic preterm birth was 0.8%. Crude
rates of preterm birth <37 weeks were significantly higher among women with the lowest family income (6.1%) com-pared with women with the highest family income (5.6%, Table 2). Logistic regression adjustment for known deter-minants of preterm birth abolished this association. Rates of preterm birth <32 weeks gestation were not signifi-cantly different by family income; adjustment for known determinants did not change this association. The crude relationships between RSP contribution and preterm birth <37 weeks and preterm birth <32 weeks were statisti-cally significant; logistic regression adjustment attenuated both these relationships.
The crude relationship between family income and spon-taneous preterm birth was complex (Table 3). The crude rate ratio for spontaneous preterm birth was significantly higher among the women in the lowest 2 family income groups (<$4,430 and $4,430 to $6,529) compared with women in the highest family income group (> =$24,950). Also, women in the middle family income category ($11,915-$17,584) had a significantly lower rate of spon-taneous preterm birth compared with women in highest family income group. Finally, women who did not contrib-ute to an RSP also had a 14% (95% CI 8, 21) higher rate of spontaneous preterm birth compared with women who contributed to an RSP. On the other hand, the crude rela-tionships between family income and iatrogenic preterm birth, and the crude relationship between contribution to an RSP and iatrogenic preterm birth were not statistically significant (Table 3).
Table 4 contrasts the results of logistic regression for spontaneous preterm birth and iatrogenic preterm birth. Adjustment for other determinants of preterm birth abolished the crude relationship between low family in-come and spontaneous preterm birth (crude rate ratio for family income < $4,430 = 1.14, 95% CI 1.03, 1.25, Table 3; adjusted rate ratio = 0.99, 95% CI 0.85, 1.15, Table 4). On the other hand, adjustment increased the rate ratio between low family income and iatrogenic preterm birth, although neither the crude nor the adjusted effect was statistically significant (crude rate ratio for family income < $4,430 = 0.95, 95% CI 0.75, 1.19; adjusted rate ratio 1.12, 95% CI 0.77, 1.62). No RSP contribution was a risk factor for spontaneous preterm birth in the crude model and adjustment for maternal characteristics attenuated this relationship. These crude and adjusted associations between RSP contri-bution and iatrogenic preterm birth were not significant (Table 4).
1.51 (95% CI 1.13, 2.03) times greater risk of spontaneous preterm birth compared with women 20–24 years, while women> =40 years had a 4.47 (95% CI 2.77, 7.22) times greater risk of iatrogenic preterm birth. These two rate ra-tios were significantly different from each other (P < 0.05
for heterogeneity). Nulliparous women were at higher risk of both spontaneous and iatrogenic preterm birth compared with women of parity 1, though again the excess risk was higher with iatrogenic preterm birth. However, parity > = 3 was protective against spontaneous preterm
Table 1 Maternal characteristics by family income and contribution to a retirement savings plan (RSP) among singleton births, Nova Scotia, 1988-2003
Characteristic Family income* RSP (no) RSP (yes)
<$4,430 $4,430 to $6,529
$6,530 to $11,914
$11,915 to $17,584
$17,585 to
$24,949 ≥
$29,450
N = 13,217 N = 13,215 N = 26,354 N = 26,536 N = 26,628 N = 26,764 N = 96,356 N = 36,358
Maternal age <20 yrs (%) 34.9 14.0 6.7 2.4 1.4 1.0 9.5 1.0
Maternal age≥35 yrs (%) 4.8 5.8 8.2 9.8 12.1 18.6 8.9 15.6
Nulliparous (%) 62.1 40.5 34.6 36.4 43.0 54.5 43.8 44.0
Nulliparous,≥35 yrs (%) 0.8 0.7 1.3 1.7 2.7 6.7 1.9 4.5
Married (%) 20.9 25.2 53.3 79.3 87.4 91.5 58.0 90.8
Rural residence (%) 45.4 36.9 43.9 46.0 38.4 27.7 41.1 34.7
Prenatal classes†(%) 53.6 55.7 62.8 73.8 82.7 87.8 67.8 86.3
Pre-preg. Wt.≥90 kg (%) 6.7 9.3 10.5 9.6 7.7 4.8 9.0 5.7
Delivery Wt.≥100 kg (%) 10.0 12.2 13.2 12.3 10.8 7.5 11.9 8.4
Smokers (%) 43.7 48.2 36.8 25.1 18.3 10.7 32.8 12.0
*Family income adjusted for family size and expressed in 1988 Canadian dollars.
†Prenatal class attendance among nulliparous women only.
Figure 1Maternal characteristics by family income and contribution to a retirement savings plan (RSP) among singleton births, Nova
birth but not significantly related to iatrogenic preterm birth (Table 4).
Other differences in risk factors for spontaneous and iatrogenic preterm birth included marital status. Single women and women in a common law relationship had higher rates of spontaneous preterm birth compared
with married women, while marital status did not in-fluence rates of iatrogenic preterm birth (Table 4). Women with a low or high pre-pregnancy weight (<55 kg, 55– 59 kg and> =90 kg) had an increased risk of spontaneous preterm birth compared with women with a pre-pregnancy weight of 60–69 kg. However, pre-pregnancy weight was
Table 3 Crude association between family income and contribution to a retirement savings plan (RSP) and subtypes of preterm birth (<37 weeks) among singleton births, Nova Scotia, Canada, 1988 to 2003
Family income*/RSP Spontaneous preterm birth Iatrogenic preterm birth
Crude rate ratio 95% CI P value Crude rate ratio 95% CI P value
<$4,430 1.14 1.03-1.25 0.009 0.95 0.75-1.19 0.65
$4,430-$6,529 1.14 1.04-1.26 0.006 0.98 0.78-1.23 0.88
$6,530-$11,914 0.99 0.91-1.07 0.75 0.92 0.76-1.11 0.36
$11,915-$17,584 0.91 0.84-0.99 0.02 0.86 0.71-1.04 0.11
$17,585-$24,949 1.00 0.92-1.08 0.97 0.88 0.73-1.07 0.20
$≥29,450 1.00 - - 1.00 -
-No RSP 1.14 1.08-1.21 <0.0001 0.98 0.86-1.12 0.76
RSP 1.00 - - 1.00 -
-*Family income adjusted for family size and expressed in 1988 Canadian dollars.
Table 2 Rates of preterm birth <37 weeks and preterm birth <32 weeks and crude and adjusted rate ratios by family income and contribution to a retirement saving plan (RSP) among singletons births, Nova Scotia, 1988 to 2003
Family income*/RSP Preterm birth Crude rate
ratio
95% CI P value Adjusted rate ratio‡
95% CI P value
Number†Rate (%)†
Preterm birth <37 weeks
<$4,430 780 6.1 1.11 1.01-1.21 0.03 1.01 0.88-1.16 0.87
$4,430-$6,529 800 6.2 1.12 1.02-1.22 0.02 1.03 0.90-1.18 0.69
$6,530-$11,914 1,390 5.4 0.97 0.90-1.05 0.47 0.96 0.86-1.07 0.44
$11,915-$17,584 1,270 5.1 0.90 0.83-0.97 0.007 0.97 0.87-1.07 0.52
$17,585-$24,949 1,390 5.5 0.98 0.91-1.06 0.61 1.07 0.97-1.17 0.17
$≥29,450 1,380 5.6 1.00 - - 1.00 -
-RSP (no) 5,240 5.7 1.11 1.05-1.18 0.0001 1.08 1.00-1.16 0.06
RSP (yes) 1,780 5.1 1.00 - - 1.00 -
-Preterm birth <32 weeks
<$4,430 100 0.86 1.14 0.90-1.43 0.29 0.74 0.50-1.10 0.14
$4,430-$6,529 110 0.92 1.21 0.96-1.52 0.11 0.87 0.59-1.28 0.47
$6,530-$11,914 190 0.79 1.04 0.85-1.26 0.72 0.82 0.60-1.11 0.19
$11,915-$17,584 170 0.75 0.98 0.80-1.20 0.86 0.90 0.68-1.18 0.44
$17,585-$24,949 170 0.72 0.95 0.78-1.16 0.62 0.92 0.72-1.19 0.52
$≥29,450 150 0.76 1.00 - - 1.00 -
-RSP (no) 670 0.81 1.18 1.02-1.37 0.02 1.17 0.94-1.44 0.15
RSP (yes) 210 0.69 1.00 - - 1.00 -
-*Family income adjusted for family size and expressed in 1988 Canadian dollars.
†All numbers rounded to the nearest 10 in tabular analyses, with crude rates (and crude rate ratios) obtained from logistic models (excluding those with a missing
gestational age).
‡Adjusted rate ratios were obtained from a logistic model that included maternal age, parity, marital status, residence, pre-pregnancy weight, smoking status,
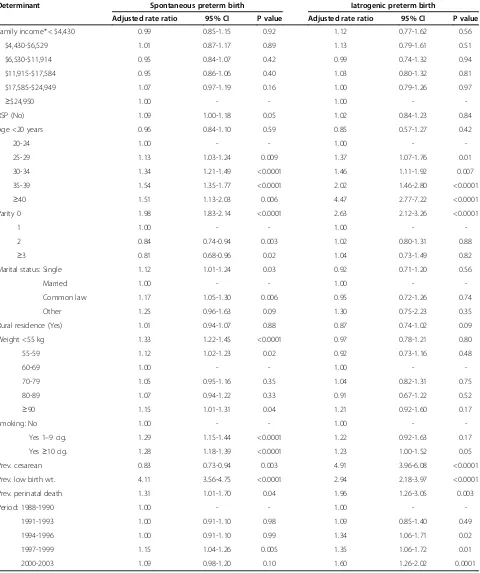
Table 4 Factors associated with spontaneous and iatrogenic preterm birth (<37 weeks) among singleton births, Nova Scotia, Canada, 1988 to 2003
Determinant Spontaneous preterm birth Iatrogenic preterm birth
Adjusted rate ratio 95% CI P value Adjusted rate ratio 95% CI P value
Family income* < $4,430 0.99 0.85-1.15 0.92 1.12 0.77-1.62 0.56
$4,430-$6,529 1.01 0.87-1.17 0.89 1.13 0.79-1.61 0.51
$6,530-$11,914 0.95 0.84-1.07 0.42 0.99 0.74-1.32 0.94
$11,915-$17,584 0.95 0.86-1.06 0.40 1.03 0.80-1.32 0.81
$17,585-$24,949 1.07 0.97-1.19 0.16 1.00 0.79-1.26 0.97
≥$24,950 1.00 - - 1.00 -
-RSP (No) 1.09 1.00-1.18 0.05 1.02 0.84-1.23 0.84
Age <20 years 0.96 0.84-1.10 0.59 0.85 0.57-1.27 0.42
20-24 1.00 - - 1.00 -
-25-29 1.13 1.03-1.24 0.009 1.37 1.07-1.76 0.01
30-34 1.34 1.21-1.49 <0.0001 1.46 1.11-1.92 0.007
35-39 1.54 1.35-1.77 <0.0001 2.02 1.46-2.80 <0.0001
≥40 1.51 1.13-2.03 0.006 4.47 2.77-7.22 <0.0001
Parity 0 1.98 1.83-2.14 <0.0001 2.63 2.12-3.26 <0.0001
1 1.00 - - 1.00 -
-2 0.84 0.74-0.94 0.003 1.02 0.80-1.31 0.88
≥3 0.81 0.68-0.96 0.02 1.04 0.73-1.49 0.82
Marital status: Single 1.12 1.01-1.24 0.03 0.92 0.71-1.20 0.56
Married 1.00 - - 1.00 -
-Common law 1.17 1.05-1.30 0.006 0.95 0.72-1.26 0.74
Other 1.25 0.96-1.63 0.09 1.30 0.75-2.23 0.35
Rural residence (Yes) 1.01 0.94-1.07 0.88 0.87 0.74-1.02 0.09
Weight <55 kg 1.33 1.22-1.45 <0.0001 0.97 0.78-1.21 0.80
55-59 1.12 1.02-1.23 0.02 0.92 0.73-1.16 0.48
60-69 1.00 - - 1.00 -
-70-79 1.05 0.95-1.16 0.35 1.04 0.82-1.31 0.75
80-89 1.07 0.94-1.22 0.33 0.91 0.67-1.22 0.52
≥90 1.15 1.01-1.31 0.04 1.21 0.92-1.60 0.17
Smoking: No 1.00 - - 1.00 -
-Yes 1–9 cig. 1.29 1.15-1.44 <0.0001 1.22 0.92-1.63 0.17
Yes≥10 cig. 1.28 1.18-1.39 <0.0001 1.23 1.00-1.52 0.05
Prev. cesarean 0.83 0.73-0.94 0.003 4.91 3.96-6.08 <0.0001
Prev. low birth wt. 4.11 3.56-4.75 <0.0001 2.94 2.18-3.97 <0.0001
Prev. perinatal death 1.31 1.01-1.70 0.04 1.96 1.26-3.05 0.003
Period: 1988-1990 1.00 - - 1.00 -
-1991-1993 1.00 0.91-1.10 0.98 1.09 0.85-1.40 0.49
1994-1996 1.00 0.91-1.10 0.99 1.34 1.06-1.71 0.02
1997-1999 1.15 1.04-1.26 0.005 1.35 1.06-1.72 0.01
2000-2003 1.09 0.98-1.20 0.10 1.60 1.26-2.02 0.0001
not associated with iatrogenic preterm birth. Maternal smoking was associated with both spontaneous and iatro-genic preterm birth to a similar degree, while a previous cesarean delivery was a protective factor for spontaneous preterm birth (rate ratio 0.83, 95% CI 0.73, 0.94) and a strong risk factor for iatrogenic preterm birth (rate ratio 4.91, 95% CI 3.96, 6.08; P value for heterogeneity <0.05). Previous low birth weight and previous perinatal death were similarly associated with spontaneous and iatrogenic preterm birth. Spontaneous preterm birth rates showed an increasing trend over calendar time but the rate in 2000– 2003 was not significantly higher than the rate in 1988– 1990 (adjusted rate ratio 1.09, 95% CI 0.98, 1.20). On the other hand, rates of iatrogenic preterm birth increased steadily and the adjusted rate in 2000–2003 was 60% (95% CI 26, 102) higher than the rate in 1988–1990.
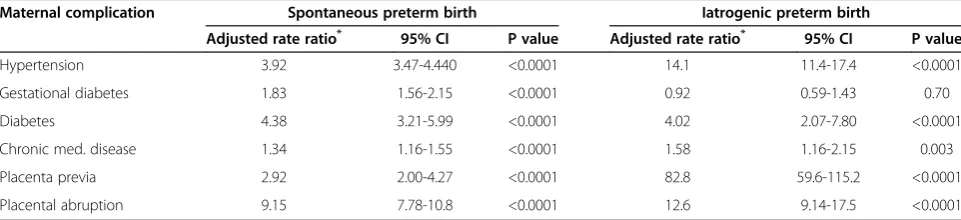
Associations between maternal complications and the two subtypes of preterm birth showed distinct differ-ences (Table 5). Gestational diabetes and other chronic medical disease were weakly or moderately associated with spontaneous preterm birth, while hypertension, diabetes mellitus, placenta previa and abruption were strongly associated. On the other hand, gestational dia-betes was not associated with iatrogenic preterm birth, while the association between hypertension and iatro-genic preterm birth and between placenta previa and iatrogenic preterm birth was much stronger than the corresponding associations with spontaneous preterm birth (P value for heterogeneity of the odds ratio <0.05). The magnitude of the association between diabetes mel-litus, other chronic medical disease and placental abrup-tion, and the two subtypes of preterm birth was similar.
Supplementary analyses showed that women whose perinatal records linked to socioeconomic information in the T1 Family Files (81.3%) were generally similar to women whose records did not link (18.7%); 10.4% of women whose records linked were > = 35 years com-pared with 8.7% whose records did not link. Similarly, of
the women whose records linked to socioeconomic in-formation 43.8% were nulliparous, 7.5% had a pre-pregnancy weight > = 90 kg, 63.3% were married and 39.4% lived in a rural area compared with 46.6%, 6.8%, 63.3% and 39.2%, respectively, of women whose records did not link. The rate of preterm birth among women with unlinked records was 6.0% (compared with 5.5% among women with linked records).
Discussion
Our study shows that spontaneous and iatrogenic pre-term birth have several common and distinct risk fac-tors. Family income and contribution to a retirement savings plan were associated with crude rates of spon-taneous preterm birth but not with crude rates of iatro-genic preterm birth. Similarly, factors such as older maternal age, parity and previous cesarean delivery had significantly different effects on spontaneous and iatro-genic preterm birth. Adjustment for determinants of preterm birth attenuated the socioeconomic associations with spontaneous preterm birth and strengthened associ-ations with iatrogenic preterm birth. Finally, adjusted temporal trends in spontaneous and iatrogenic preterm birth were distinct, with a small, non-significant increase in spontaneous preterm birth and a substantial, signifi-cant increase in iatrogenic preterm birth.
These data provide some insight into the observed temporal attenuation in the relationship between socio-economic position and preterm birth seen in several countries [6,7]. Since older maternal age is associated with spontaneous preterm birth and more strongly asso-ciated with iatrogenic preterm birth, the differential tem-poral increases in older maternal age by socioeconomic position [13] would have led to increases in rates of pre-term birth among more affluent women. This in turn would have resulted in a diminution in the gradient be-tween socioeconomic position and preterm birth. Other factors that appear to have been responsible for the
Table 5 Association between maternal complications of pregnancy and subtypes of preterm birth among singleton births, Nova Scotia, Canada,1988 to 2003
Maternal complication Spontaneous preterm birth Iatrogenic preterm birth
Adjusted rate ratio* 95% CI P value Adjusted rate ratio* 95% CI P value
Hypertension 3.92 3.47-4.440 <0.0001 14.1 11.4-17.4 <0.0001
Gestational diabetes 1.83 1.56-2.15 <0.0001 0.92 0.59-1.43 0.70
Diabetes 4.38 3.21-5.99 <0.0001 4.02 2.07-7.80 <0.0001
Chronic med. disease 1.34 1.16-1.55 <0.0001 1.58 1.16-2.15 0.003
Placenta previa 2.92 2.00-4.27 <0.0001 82.8 59.6-115.2 <0.0001
Placental abruption 9.15 7.78-10.8 <0.0001 12.6 9.14-17.5 <0.0001
temporal change in the relation between socioeconomic status and preterm birth include the increase in the pro-portion of women with a previous cesarean delivery given the strong association between this factor and iat-rogenic preterm birth. This underscores the complex nature of the various behavioral and lifestyle mediators responsible for socioeconomic gradients in preterm birth [18] and in health more generally.
The overlap between the etiology of spontaneous and iatrogenic preterm birth has been previously described [19-24]. Indications for obstetric intervention at preterm gestation (including preeclampsia, placental abruption, growth restriction and fetal compromise) are also risk factors for spontaneous preterm birth. In fact, with re-cent improvements in fetal surveillance and monitoring, iatrogenic preterm birth and spontaneous preterm birth are clearly competing risks in any high risk pregnancy. It is likely that the anticipated temporal increase in spon-taneous preterm birth (secondary to temporal increases in older maternal age and multi-fetal pregnancy) was moderated by the observed substantial increase in iatro-genic preterm birth.
Our study shows that crude rates of spontaneous pre-term birth are associated with indices of socioeconomic position including family income and contribution to a retirement savings plan. Adjustment for maternal characteristics such as age, parity, marital status, pre-pregnancy weight and smoking abolished or substan-tially attenuated these associations strongly suggesting that such lifestyle factors mediate the excess risk of spon-taneous preterm birth by socioeconomic position. On the other hand, family income and contribution to a retire-ment savings plan were not associated with iatrogenic preterm birth. However, this is not unexpected in the Canadian setting where universal coverage for obstet-ric and related medical services is available under the Canadian health care system [25,26].
The overall rate of preterm birth in our study was low (5.5%) and the proportion due to iatrogenic preterm birth was also low (rate 0.8% i.e., 15% of preterm births). This is because the study was restricted to singleton births for the period 1988 to 2003. For instance in 1997, the overall rate of preterm birth in Canada was 7.1% and among singletons, the preterm birth rate was 5.9% [27]. A previous study from Nova Scotia also reported a pre-term birth rate of 5.5% and an iatrogenic prepre-term birth rate of 1.4% for the period 1995–97 among live births without congenital malformations [28]. Differences be-tween this study [28] (which excluded infants with con-genital malformations and included multiple births) and ours, make these rates approximately similar (the rate of preterm induction and preterm cesarean delivery among twins in Nova Scotia in 1996–97 was 8.6% and 23.9%, respectively) [29].
The strengths of our study include the use of informa-tion from two high quality databases. The Nova Scotia Atlee Perinatal Database had detailed information that permitted the classification of preterm birth subtypes based on labor characteristics (presence/absence of labor and whether labor was induced or spontaneous). Simi-larly, information from the federal T1 Family Files and calculation of family income (adjusted for family size and inflation) permitted an accurate estimate of socio-economic position. The use of contribution to a retirement savings plan as an index of socioeconomic behavior that was distinct from family income was another strength of the study.
The limitations of our study included those that are typically associated with information in large databases. Some accuracy may have been compromised due to transcription and related errors. Also, height was not available for calculation of body mass index, and gesta-tional age was assessed based on menstrual dating con-firmed by neonatal physical examination. Although we did not have ultrasound confirmed gestational age, the same uniform algorithm for gestational age assessment was used over the entire duration of the study from 1988 to 2003. Finally, our population-based data source, which included all singleton births in Nova Scotia (≥20 weeks gestation or≥500 g), was affected by our in-ability to link all perinatal records with T1 Family File socioeconomic information. However, the linkage rate was high (81.3%) and there were only modest differences in maternal characteristics between women whose re-cords did and did not link. Finally, we only examined one dimension of the heterogeneity of preterm birth (spontaneous vs iatrogenic), although several other clas-sification schemes have been previously described in the literature [30-32]. This was because our hypothesis was based on the potential alteration in the relationship be-tween socioeconomic position and preterm birth (because of increases in iatrogenic preterm birth).
Conclusions
Competing interest
The authors declare they have no competing interests.
Authors’contributions
The study was based on a grant proposal submitted by the authors and funded by the Canadian Institutes of Health Research. Analyses were carried out by KSJ who submitted SAS programs to the office of the Small Area and Administrative Data Division of Statistics Canada in Ottawa. All authors reviewed the preliminary and final analyses, and the draft and final manuscripts. All authors read and approved the final manuscript.
Acknowledgements
This study was supported by a grant from the Canadian Institutes of Health Research (MOP-82806). KSJ’s work is supported by a salary award from the Child and Family Research Institute and a Chair in maternal, fetal and infant health services research from the Canadian Institutes of Health Research (APR-126338).
Author details 1
Department of Obstetrics and Gynaecology and the School of Population and Public Health, University of British Columbia and the Children’s and Women’s Hospital of British Columbia, 4500 Oak Street, Vancouver, British Columbia V6H 3 N1, Canada.2Reproductive Care Program of Nova Scotia, Halifax, Nova Scotia, Canada.3Department of Psychology, Wilfred Laurier University, Waterloo, Ontario, Canada.4Department of Obstetrics & Gynaecology, Dalhousie University and the IWK Health Centre, Halifax, Nova Scotia, Canada.5Centre for Research on Inner City Health, St. Michael’s Hospital and the University of Toronto, Toronto, Ontario, Canada.6Perinatal Epidemiology Research Unit, Departments of Obstetrics & Gynaecology and Pediatrics, Dalhousie University and the IWK Health Centre, Halifax, Nova Scotia, Canada.7Department of Obstetrics and Gynaecology, University of British Columbia, and the Children’s and Women’s Hospital of British Columbia, Vancouver, British Columbia, Canada.
Received: 8 May 2013 Accepted: 14 March 2014 Published: 27 March 2014
References
1. Tucker J, McGuire W:Epidemiology of preterm birth.BMJ2004,329:675–8. 2. Ananth CV, Vintzileos AM:Epidemiology of preterm birth and its clinical
subtypes.J Matern Fetal Neonatal Med2006,19:773–82.
3. Goldenberg RL, Culhane JF, Iams JD, Romero R:Epidemiology and causes of preterm birth.Lancet2008,371:75–84.
4. Shapiro-Mendoza CK, Lackritz EM:Epidemiology of late and moderate preterm birth.Semin Fetal Neonatal Med2012,17:120–5.
5. Blumenshine P, Egerter S, Barclay CJ, Cubbin C, Braveman PA:
Socioeconomic disparities in adverse birth outcomes: a systematic review.Am J Prev Med2010,39:263–72.
6. El-Sayed AM, Galea S:Temporal changes in socioeconomic influences on health: maternal education and preterm birth.Am J Public Health2012,
102:1715–21.
7. Craig ED, Thompson JM, Mitchell EA:Socioeconomic status and preterm birth: New Zealand trends, 1980 to 1999.Arch Dis Child Fetal Neonatal Ed
2002,86:F142–6.
8. Mortensen LH, Lauridsen JT, Diderichsen F, Kaplan GA, Gissler M, Andersen AM:Income-related and educational inequality in small-for-gestational age and preterm birth in Denmark and Finland 1987–2003.Scand J Public Health2010,38:40–5.
9. Fair M, Cyr M, Allen AC, Wen SW, Guyon G, MacDonald RC:An assessment of the validity of a computer system for probabilistic record linkage of birth and infant death records in Canada.Chronic Dis Can2000,21:8–13. 10. Joseph KS, Fahey J:Validation of perinatal data in the Canadian Institute for Health Information’s Discharge Abstract Database.Chron Dis Canada
2009,29:96–100.
11. Kramer MS, Platt RW, Yang H, Haglund B, Cnattingius S, Bergsjo P:
Registration artifacts in international comparisons of infant mortality.
Paediatr Perinat Epidemiol2002,16:16–22.
12. Joseph KS, Liu S, Rouleau J, Lisonkova S, Hutcheon JA, Sauve R, Allen AC, Kramer MS, Fetal and Infant Health Study Group of the Canadian Perinatal Surveillance System:Influence of definition based versus pragmatic birth
registration on international comparisons of perinatal and infant mortality: population based retrospective study.BMJ2012,344:e746. 13. Joseph KS, Fahey J, Dendukuri N, Allen VM, O’Campo P, Dodds L, Liston RM,
Allen AC:Recent changes in maternal characteristics by socioeconomic status.J Obstet Gynaecol Can2009,31:422–33.
14. Annual Estimates for Census Families and Individuals (T1 Family File).Ottawa: Statistics Canada; 2014. www.statcan.ca/cgi-bin/imdb/p2SV.pl?Function= getSurvey&SDDS=4105&lang=en&db=IMDB&dbg=f&adm=8&dis=2. 15. Low income cutoffs from 1991 to 2000 and low income measures from
1990 to 1999.InIncome Statistics Division.Ottawa (Canada): Statistics Canada; 2001. Catalogue No. 75F0002MIE-01007 (http://www.publications. gc.ca/Collection/Statcan/75F0002MIE/75F0002MIE2001007.pdf). Accessed March 20, 2014.
16. Smith GD, Shipley MJ, Rose G:Magnitude and causes of socioeconomic differentials in mortality: further evidence from the Whitehall Study.
J Epidemiol Community Health1990,44:265–70.
17. Breslow NE, Day NE:Statistical methods in cancer research: Vol. I - The analysis of case–control studies.Lyon: IARC; 1980. Scientific Publ. No 32.
18. Kramer MS, Séguin L, Lydon J, Goulet L:Socio-economic disparities in pregnancy outcome: why do the poor fare so poorly?Paediatr Perinat Epidemiol2000,143:194–210.
19. Ananth CV, Savitz DA, Luther ER, Bowes WA Jr:Preeclampsia and preterm birth subtypes in Nova Scotia, 1986 to 1992.Am J Perinatol1997,14:17–23. 20. Meis PJ, Michielutte R, Peters TJ, Wells HB, Sands RE, Coles EC, Johns KA:
Factors associated with preterm birth in Cardiff, Wales. II. Indicated and spontaneous preterm birth.Am J Obstet Gynecol1995,173:597–602. 21. Meis PJ, Goldenberg RL, Mercer BM, Iams JD, Moawad AH, Miodovnik M,
Menard MK, Caritis SN, Thurnau GR, Bottoms SF, Das A, Roberts JM, McNellis D:The Preterm Prediction Study: Risk factors for indicated preterm births. Maternal-Fetal Medicine Units Network of the National Institute of Child Health and Human Development.Am J Obstet Gynecol1998,178:562–567.
22. Gardner MO, Goldenberg RL, Cliver SP, Tucker JM, Nelson KG, Copper RL:
The origin and outcome of preterm twin pregnancies.Obstet Gynecol
1995,85:553–557.
23. Ananth CV, Vintzileos AM:Maternal-fetal conditions necessitating a medical intervention resulting in preterm birth.Am J Obstet Gynecol2006,
195:1557–1563.
24. Morken NH, Källen K, Hagberg H, Jacobsson B:Preterm birth in Sweden 1973-2001: rate, subgroups, and effect of changing patterns in multiple births, maternal age, and smoking.Acta Obstet Gynecol Scand2005,
84:558–65.
25. Joseph KS, Dodds L, Allen AC, Jones DV, Monterrosa L, Robinson H, Liston RM, Young DM:Socioeconomic status and the receipt of obstetric services in Canada.Obstet Gynecol2006,107:641–50.
26. Joseph KS, Liston RM, Dodds L, Dahlgren L, Allen AC:Socioeconomic status and perinatal outcomes in a setting with universal access to essential health care services.CMAJ2007,177:583–90.
27. Canada H:Canadian Perinatal Health Report, 2000.Ottawa: Minister of Public Works and Government Services Canada; 2000.
28. Armson BA, Dodds L, Cervin C, Christie-Haliburton S, Rinaldo K:A preterm birth prevention project in Nova Scotia, Canada.Matern Child Health J
2001,5:189–97.
29. Joseph KS, Allen AC, Dodds L, Vincer MJ, Armson BA:Causes and consequences of recent increases in preterm birth among twins.
Obstet Gynecol2001,98:57–64.
30. Moutquin JM:Classification and heterogeneity of preterm birth.BJOG
2003,110(S20):30–3.
31. McElrath TF, Hecht JL, Dammann O, Boggess K, Onderdonk A, Markenson G, Harper M, Delpapa E, Allred EN, Leviton A, ELGAN Study Investigators:
Pregnancy disorders that lead to delivery before the 28th week of gestation: an epidemiologic approach to classification.Am J Epidemiol
2008,168:980–9.
32. Savitz DA:Invited commentary: disaggregating preterm birth to determine etiology.Am J Epidemiol2008,168:990–2. discussion 993–4.
doi:10.1186/1471-2393-14-117