Open Access
Proceedings
Dealing with missing phase and missing data in phylogeny-based
analysis
Claire Bardel*
1,2, Pascal Croiseau
2,3and Emmanuelle Génin
2,3Address: 1UMR 5145 – Génétique des Populations Humaines – CNRS MNH, Université Paris VII, 17 Place du Trocadero, Paris, 75016 France, 2INSERM U535, BP 1000, Villejuif, 94817 France and 3Universite Paris-Sud UMR-S535, Villejuif, 94817 France
Email: Claire Bardel* - [email protected]; Pascal Croiseau - [email protected]; Emmanuelle Génin - [email protected] * Corresponding author
Abstract
We recently described a new method to identify disease susceptibility loci, based on the analysis of the evolutionary relationships between haplotypes of cases and controls. However, haplotypes are often unknown and the problem of phase inference is even more crucial when there are missing data. In this work, we suggest using a multiple imputation algorithm to deal with missing phase and missing data, prior to a phylogeny-based analysis. We used the simulated data of Genetic Analysis Workshop 15 (Problem 3, answer known) to assess the power of the phylogeny-based analysis to detect disease susceptibility loci after reconstruction of haplotypes by a multiple-imputation method. We compare, for various rates of missing data, the performance of the multiple imputation method with the performance achieved when considering only the most probable haplotypic configurations or the true phase. When only the phase is unknown, all methods perform approximately the same to identify disease susceptibility sites. In the presence of missing data however, the detection of disease susceptibility sites is significantly better when reconstructing haplotypes by multiple imputation than when considering only the best haplotype configurations.
Background
In the last few years, various phylogeny-based approaches have been developed to test for association between a can-didate gene and a disease [1-4]. These tests are based on the grouping of haplotypes according to their evolution-ary relationships represented by a phylogenetic tree. This grouping reduces the degree of freedom of the association
tests and thus, increases their power. Interestingly, the haplotype phylogeny can also be used to precisely identify loci involved in the determinism of the disease. We recently described a new method to localize disease sus-ceptibility loci (DS loci), based on the definition of a co-evolution index (Vi) between the markers and the disease. The markers showing the highest Vi are assumed to be
from Genetic Analysis Workshop 15
St. Pete Beach, Florida, USA. 11–15 November 2006
Published: 18 December 2007
BMC Proceedings 2007, 1(Suppl 1):S22
<supplement> <title> <p>Genetic Analysis Workshop 15: Gene Expression Analysis and Approaches to Detecting Multiple Functional Loci</p> </title> <editor>Heather J Cordell, Mariza de Andrade, Marie-Claude Babron, Christopher W Bartlett, Joseph Beyene, Heike Bickeböller, Robert Culverhouse, Adrienne Cupples, E Warwick Daw, Josée Dupuis, Catherine T Falk, Saurabh Ghosh, Katrina A Goddard, Ellen L Goode, Elizabeth R Hauser, Lisa J Martin, Maria Martinez, Kari E North, Nancy L Saccone, Silke Schmidt, William Tapper, Duncan Thomas, David Tritchler, Veronica J Vieland, Ellen M Wijsman, Marsha A Wilcox, John S Witte, Qiong Yang, Andreas Ziegler, Laura Almasy and Jean W MacCluer</editor> <note>Proceedings</note> <url>http://www.biomedcentral.com/content/pdf/1753-6561-1-S1-info.pdf</url> </supplement>
This article is available from: http://www.biomedcentral.com/1753-6561/1/S1/S22 © 2007 Bardel et al; licensee BioMed Central Ltd.
putative DS sites [4]. Simulations have shown that the method performs well at identifying DS loci, especially when several DS loci exist.
To reconstruct the phylogenetic tree, haplotype informa-tion is used. In most situainforma-tion, this informainforma-tion is not available from the data and needs to be inferred. In our method, this was done by determining the most probable haplotypes of the different individuals and analyzing them as if they were the known haplotypes. However, this approach may lead to incorrect inferences because it does not take into account the uncertainty of the phase that might be very large, especially in the presence of missing data. In this context, the use of multiple imputation to reconstruct missing phase and missing data might be an interesting alternative. In this paper, we used the simu-lated data of Genetic Analysis Workshop 15 (GAW15) to compare the relative power of these two approaches to haplotype reconstruction to correctly identify the simu-lated DS sites when using a phylogeny-based analysis.
Methods
Data
We analyzed the 100 replicates simulated for GAW 15 (Problem 3). To apply a phylogeny-based method, we need to work on a candidate region where the disease sus-ceptibility site is typed, and where the recombination rate is low. We used the answers to choose a 200-kb region of chromosome 6 around the DR locus that contained two DS sites: the DR locus and locus C. In this region, nine sin-gle-nucleotide polymorphisms (SNPs) (including locus C) were selected. A tenth biallelic locus was added, corre-sponding to the DR locus in which the lower risk alleles DR1 and DRX were pooled. The linkage disequilibrium is low within these ten sites: the highest r2 is between locus
C and SNP 4 (r2 = 0.65) and it is the only pair of loci with
an r2 above 0.2.
For each replicate the first affected child of the first 500 families was selected to obtain 500 trios. Missing data were generated on the different loci (with the same per-centage of missing data on each locus) on both parents and children. In each replicates, the same individuals had their genotypes missing at the same loci in order to ensure a similar pattern of missing data over replicates.
Reconstruction of missing data and missing phases
Missing phases and missing genotypes were reconstructed either only by an algorithm to infer the most probable haplotypes without missing data for each individual, or by a multiple imputation method. For both methods, the first step was the inference of all the possible haplotypic configurations and their probabilities. It was performed with the software ZAPLO [5]. The first method then con-sists of picking the most likely haplotypes for each
indi-vidual. The only families kept for the analysis were those with a low level of haplotype uncertainty; i.e., families with a best configuration posterior probability >50% and at least 25% difference between the posterior probabilities of the best and second best configuration. Similar results were obtained with other cut-off values (data not shown). The multiple imputation procedure is the same as the one described in Croiseau et al. [6]. Briefly, it consists of repeating two steps: 1) given the current values of two parameters (population haplotype frequencies and affected child genotype frequencies), sampling a complete data set according to the posterior probabilities of each genotypic configuration and 2) given the current data set, updating the two parameters. After a burn-in period of 1000 iterations, every 1000 iterations, the current com-plete data file was retained. We ran the algorithm until we obtained ten complete data sets.
Identification of the susceptibility sites
The identification of the DS sites was performed with the software ALTree [7]. At first, 1000 equiparsimonious unrooted trees were reconstructed for the 30 most fre-quent haplotypes using the parsimony method imple-mented in the software PAUP*, version 4.0b10 [8]. To ensure that various tree configurations were explored, PAUP* was launched 10 times, 100 trees being retained each time. Then, a new character called S, which repre-sents the disease status, was defined for each haplotypes. The state of this character depends on the proportion of cases carrying a given haplotype (state 1 for a large propor-tion of cases and 0 otherwise). The character state changes were optimized on the tree for each character (including
S) using the deltran option. A correlated evolution index (Vi) was calculated between the changes of each site i and the changes of the character S. This index was defined as the difference between the number of observed and expected co-mutations between site i and character S, divided by the square root of the number of expected co-mutations [4]. To take into account the 10 imputed data sets, we calculated the median of the Vi over these 10 data sets. Finally, the sites with Vi ≤ 0 were discarded and the two site(s) with the highest Vi are retained as putative DS sites.
Results
The power to identify the DS sites is measured as the per-centage of replicates among the 100 replicates available in which the simulated DS sites have the highest Vi.
Missing phase
infer missing data. The results show no significant differ-ence between the three methods.
Missing data
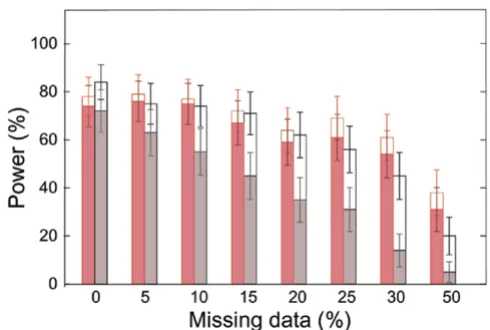
Figure 1 shows that for different rates of missing data, the percentage of replicates in which the site with the highest
Vi (best site) is one of the two true DS site. Interestingly,
this percentage remains very similar for the different rates of missing data when using multiple imputation. This is not the case when considering only the most likely haplo-types with more than 15% of missing data. With the mul-tiple imputation, there are fewer errors on the second best site and more replicates in which no other site is detected than when using the most likely haplotypes (Figure 1).
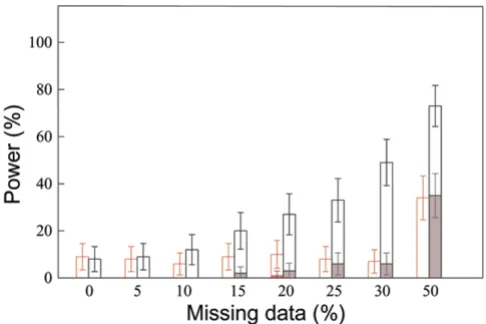
Figure 2 shows the percentage of replicates in which the two best sites are the two simulated DS sites. For up to 20% of missing data, there is no difference of power when using the most likely haplotypes or the multiple imputa-tion method. For higher rates of missing data, the multi-ple imputation method leads to higher power but this is not significant at the 5% level because the 95% confi-dence intervals overlap. The multiple imputation method is found to be more accurate: it is significantly more pow-erful to identify only the two DS sites (no other site having a Vi > 0).
The error rate, defined as the percentage of replicates in which the true DS sites are not correctly identified, is pre-sented in Figure 3. With the multiple imputation method, the locus with the highest Vi is always either DR or locus
Power to identify the two susceptibility sites for different rates of missing data
Figure 2
Power to identify the two susceptibility sites for dif-ferent rates of missing data. Missing data and missing phases are reconstructed using a multiple imputation method (in red) or the most likely haplotypes obtained with ZAPLO (in black). The percentage of replicates in which the two sites with the highest Vi values are DR and locus C are reported in
the two situations in which there are other sites with Vi > 0 (open bars) or there is no other site with Vi > 0 (colored bars).
Table 1: Power to identify the true susceptibility loci using different methods to infer phases
% Power (95% confidence interval)
Method Phaseda Most likely haplotypesb Imputationc
2 sites 81 (73.3–88.7) 84 (76.8–91.2) 78 (69.9–86.1)
1 site onlyd 12 (5.6–18.4) 8 (2.7–13.3) 13 (6.4–19.6)
1 site + 1 error 7 (2.0–12.0) 8 (2.7–13.3) 9 (3.4–14.6)
a The phase given in the data is used.
b The phase is inferred using ZAPLO (selection of the most likely haplotypes). c The phase is inferred using ZAPLO and multiple imputation.
d Only one site has a V
i > 0 and it is a true DS site.
Power to identify one of the two susceptibility sites for dif-ferent rates of missing data
Figure 1
C (more often DR). There is also significantly less error on the two best sites (sum of the error on the best site and on the second best site) than when the most likely haplo-types are used. Indeed, this two best site error rate is stable at around 10% for up to 30% of missing data and increases to 35% for 50% missing data. On the contrary, when the most likely haplotypes are used, the two best site error rate constantly increases and reaches 70% for 50% of missing data.
Discussion
The analysis of the GAW15 simulated data allowed us to confirm the power of phylogeny-based tests to identify several DS sites located in the same region. We have shown that the method is particularly powerful to identify locus DR as a susceptibility site. This may be explained by the very high risks attributed to individuals carrying the DR4 allele. The method also allowed us to detect locus C, generally as the second best site and with a lower power than DR (Figure 3 shows more errors on the second best site than on the best site). However, this locus only increases the risk in women, and our analysis has been performed regardless of the sex of the individuals.
Our results show that the use of a multiple imputation method to reconstruct haplotypes allows a better detec-tion of the DS sites in the presence of missing data than the use of the best haplotypic configuration. In particular, it is more accurate (the DS sites are often the only one
detected) and it drastically decreases the error rate for the DS site identification. In this study, in the absence of miss-ing data, no difference between the three phase imputa-tion methods was found, but this is probably a particular situation where phase is not very ambiguous thanks to the familial information available. Indeed, when we use the most likely haplotypes, only a mean of 12.48 families (over 500 families in the sample) are discarded from the analysis because of their high level of phase uncertainty. The relative performance of the three methods might be different using case-control data with no familial informa-tion available.
To tackle the problem of phase resolution, two types of strategies were suggested. In one-stage procedures, the phase inference and the analysis are performed simultane-ously. In two-stage procedures, haplotype frequencies that are estimated in the first stage are used as weights in the second stage. Concerning phylogeny-based analyses, a one-stage procedure will be very difficult to develop because haplotypes need to be known to reconstruct the phylogenetic tree. This probably explains why only two-stage procedures have been proposed [2,9]. The problem with these different two-stage methods is that the phylo-genetic tree is reconstructed on all possible haplotypes, even if they do not really exist. This can significantly increase the number of haplotypes considered, and thus, lead to an increase in the computation time (especially for parsimony-based tree reconstruction) and possibly, to a loss in power. With the multiple imputation method, ten imputed files are analyzed, which will also increase the computation time, but only the haplotypes observed in these files are used in the phylogenetic reconstruction. Further work will need to be done to compare the multi-ple imputation approach with these two-stage procedures.
Conclusion
In conclusion, the analysis of the GAW15 simulated data shows that multiple imputation can be of great value in dealing with missing genotypes prior to a phylogeny-based analysis. In comparison with a strategy using only the most likely haplotypes, it increases the chances to cor-rectly identify disease susceptibility loci.
Competing interests
The author(s) declare that they have no competing inter-ests.
Acknowledgements
This article has been published as part of BMC Proceedings Volume 1 Sup-plement 1, 2007: Genetic Analysis Workshop 15: Gene Expression Analysis and Approaches to Detecting Multiple Functional Loci. The full contents of the supplement are available online at http://www.biomedcentral.com/ 1753-6561/1?issue=S1.
Error in the identification of the susceptibilityloci for differ-ent rates of missing data
Figure 3
Publish with BioMed Central and every scientist can read your work free of charge
"BioMed Central will be the most significant development for disseminating the results of biomedical researc h in our lifetime."
Sir Paul Nurse, Cancer Research UK
Your research papers will be:
available free of charge to the entire biomedical community
peer reviewed and published immediately upon acceptance
cited in PubMed and archived on PubMed Central
yours — you keep the copyright
Submit your manuscript here:
http://www.biomedcentral.com/info/publishing_adv.asp
BioMedcentral
References
1. Templeton AR, Maxwell T, Posada D, Stengard JH, Boerwinkle E, Sing CF: Tree scanning: a method for using haplotype trees in phenotype/genotype association studies. Genetics 2005,
169:441-453.
2. Seltman H, Roeder K, Devlin B: Evolutionary-based association using haplotype data. Genet Epidemiol 2003, 25:48-58.
3. Durrant C, Zondervan KT, Cardon LR, Hunt S, Deloukas P, Morris AP: Linkage disequilibrium mapping via cladistic analysis of single nucleotique polymorphism haplotypes. Am J Hum Genet
2004, 75:35-43.
4. Bardel C, Danjean V, Hugot JP, Darlu P, Génin E: On the use of hap-lotype phylogeny to detect disease susceptibility loci. BMC Genet 2005, 6:24.
5. O'Connell J: Zero-recombinant haplotyping: application to fine mapping using SNPs. Genet Epidemiol 2000, 19(Suppl 1):S64-S70.
6. Croiseau P, Génin E, Cordell HJ: Dealing with missing data in family-based association studies: a multiple imputation approach. Hum Hered 2007, 63:229-238.
7. Bardel C, Danjean V, Génin E: ALTree: association detection and localization of susceptibility sites using haplotype phylo-genetic trees. Bioinformatics 2006, 22:1402-1403.
8. Swofford DL: PAUP*: Phylogenetic Analysis Using Parsimony 2002 [http:/ /paup.csit.fsu.edu/]. Sunderland, MA: Sinauer Associates
9. Durrant C, Morris A: Linkage disequilibrium mapping via cla-distic analysis of phase-unknown genotypes in the Genetic Analysis Workshop 14 simulated data. BMC Genet 2005,