Yang Liu
, Shiyou Xu, Zengping Chen and Bin Yuan
Abstract
In this paper, we present a detailed analysis on the performance degradation of inverse synthetic aperture radar (ISAR) imagery with the polar format algorithm (PFA) due to the inaccurate rotation center. And a novel algorithm is developed to estimate the rotation center for ISAR targets to overcome the degradation. In real ISAR scenarios, the real rotation center shift is usually not coincided with the gravity center of the high-resolution range profile (HRRP), due to the data-driven translational motion compensation. Because of the imprecise information of rotation center, PFA image yields model errors and severe blurring in the cross-range direction. To tackle this problem, an improved PFA based on integrated cubic phase function (ICPF) is proposed. In the method, the rotation center in the slant range is estimated firstly by ICPF, and the signal is shifted accordingly. Finally, the standard PFA algorithm can be carried out straightforwardly. With the proposed method, wide-angle ISAR imagery of non-cooperative targets can be achieved by PFA with improved focus quality. Simulation and real-data experiments confirm the effectiveness of the proposal.
Keywords:MTRC compensation; Polar format algorithm; Performance degradation; Integrated cubic phase function; High-resolution ISAR imaging
1 Introduction
Inverse synthetic aperture radar (ISAR) can generate two-dimensional (2D) images for a non-cooperative moving target, which has wide military (e.g., military tar-get classification and recognition) and civil (e.g., civil air-craft control) applications. The high range resolution is proportional to the bandwidth of the transmitted signal. And the high cross-range resolution is achieved using a synthetic antenna aperture respecting to the radar line of sight from the target rotation [1]. The range reso-lutionρris defined byρr=c/(2B), wherecis the velocity
of light, and B is the signal bandwidth. And based on the 2D rotational model, the cross-range resolutionρais
usually defined as ρa=λ/(2Θ), where λ is the signal
wavelength, andΘis the target rotation angle within the coherent processing interval (CPI).
Several useful ISAR imaging algorithms have been pro-posed in the literatures, such as the Range-Doppler
algorithm (RDA) [2], the Keystone algorithm for precise de-coupling [3-6], and the polar format algorithm (PFA) [7-10]. The RDA is applicable when the rotation angle is small to ensure there is no significant migration through resolution cells (MTRC) and time-varying Doppler in the echoed signal. The Keystone algorithm is optimal to correct the linear MTRC caused by the rotation for all scattering centers. However, its performance is also lited by the rotation angle. In high-resolution ISAR im-aging (always needs a wide rotation angle), high-order MTRC together with the linear one are present, where the Keystone algorithm would degrade significantly. The PFA was first used to compensate the MTRC in SAR im-aging [7]. It was introduced in ISAR imim-aging later. The PFA algorithm firstly interpolates the observed signal from polar sector support region to the Cartesian rect-angular region. And the fast Fourier transform (FFT) is followed to focus the ISAR image [10,11]. Since both the range and the Doppler curve are permitted in the PFA, its applicable rotation angle is significantly wider than those of both the RDA and the Keystone algorithm. * Correspondence:[email protected]
ATR National Defense Science and Technology Key Laboratory, National University of Defense Technology, Changsha 410073, China
In practical ISAR processing, PFA requires accurate infor-mation of the rotation parameters before the interpolation. However, those parameters are usually unavailable in ad-vance. Due to the uncooperative characteristic of ISAR targets, translational motion compensation [12-14] is also necessary to eliminate the translational range shift and phase errors in the echoes. This processing is usually data-driven. As a result, after translational compensation, the rotation center (RC) is commonly deviated from the mea-sured reference range of the radar. In this case, serious blur and defocus are also present in the cross range of a PFA image.
This paper first introduces the standard PFA process-ing for ISAR imagprocess-ing and then analyzes the performance degradation caused by the imprecise rotation center. From the analysis, one can find that the PFA image by using an inaccurate rotation center is equivalent to the response of a disturbance system with the ideal PFA image as the input. Therefore, for real applications of PFA, an accurate and robust method for rotation param-eter estimation is necessary.
Many approaches have been proposed for the rotation parameter estimation in ISAR imaging. In ref. [15], the adaptive S-method is applied to reduce the effect of quadratic phase errors in each slant-range cell by calcu-lating the conjugate correlation of signal sequences. However, it also suffers from the cross terms. In ref. [16], a method was proposed to estimate the rotation angle and center using a correlation-based function. It needs careful choosing and tracking of two scattering centers in the range-compressed phase history, which may be difficult for high-resolution ISAR. In ref [17], a method based on a concept of rotation correlation is proposed, which searches the rotation parameters by it-eratively interpolating the RD image. This method may also be invalidated if the prominent scattering points are seriously interfered by their neighbors. The algorithms in ref. [18] are utilized for uniform rotation compensa-tion in ISAR imaging, but only the rotacompensa-tion angle can be estimated in the processing. In ref. [19] and [20], two nonparametric methods, which utilize golden section search to estimate the rotation angle and center, are pro-posed. The methods use entropy as criterion and require an initial rotation angle, and the simulated and measure-ment data moderately show the validity. However, the concomitant risk of divergence cannot be avoided in the iteration and the computational load may become very large once the 2D map of the entropy is flat. In this paper, a method based on integrated cubic phase func-tion (ICPF) is proposed for PFA to eliminate the effect of the disturbance system and the rotation center can be derived precisely. The ICPF extends the standard cubic phase function (CPF) and provides improved estimation performances of multi-component chirp signals at a cost
of a moderate complexity increase. Accordingly, the signal after the translational compensation can be transformed into the standard polar format, and a well-focused image is finally obtained using the standard PFA algorithm. Ex-perimental results were carried on both of the simulated and real data to demonstrate the accuracy of the analysis and the effectiveness of the improved method.
The rest of the paper is organized as follows. The sig-nal model of ISAR imaging and the standard PFA pro-cessing are introduced in Section 2. Section 3 describes the PFA performance degradation from the imprecision of rotation center and makes a detailed analysis on the disturbance system. The improvement of PFA imaging based on ICPF is presented in Section 4. Experimental results and analysis are reported in Section 5, followed by conclusions in Section 6.
2 Signal model and standard PFA algorithm for ISAR imaging
2.1 Signal and geometry model
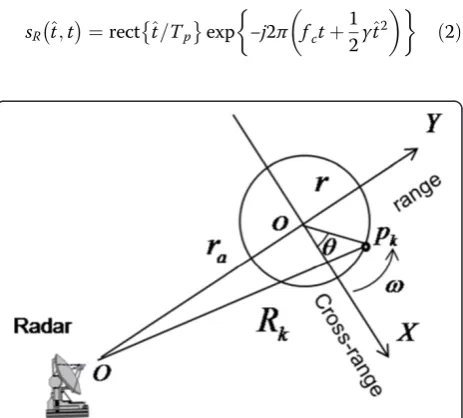
The geometry of the ISAR imaging is depicted in Figure 1, where the 2D rotation geometry with point scattering model is used [11]. The instantaneous distance from a scattering point pk with position (xk,yk) to the radar can
be approximated as:
Rkð Þ ¼t rað Þ þt xksinθð Þ þt ykcosθð Þt ð1Þ
where ra is the range from target RC to the radar and θ(t) is the rotation angle at instantaneous timet.
In the ISAR imaging system, a linear frequency modu-lated (LFM) waveform is usually utilized and it can be formulated as:
that the target consists of K point scatterers, and the returned signals can be expressed by:
sR ^t;t ¼
where σk, c, and fc are the backward scattering
coeffi-cient, light speed, and carrier frequency, respectively. For the target without high velocity, the ISAR imaging process satisfies the go-stop model [11], thus the full time t in (4) can be replaced by the slow time tm. In
order to reduce the receiver bandwidth, the echo is often dechirped on reception [21]. Suppose that the reference point (RP) isoand its range to radar isr0(tm). Then after
the dechirping, the received signal is written as:
sR2 ^t;tm
and ψ(tm) is the residual video phase (RVP). Generally,
the RVP can be removed easily [22], when dealing with small targets.
Let’s denote f ¼γ ^t−2r0ð Þtm =c
, and by substitutingf
into Equation (5), one can obtain:
sR3ðf;tmÞ ¼
Assuming that the RP are located at the RC, i.e., r0
(tm) =ra(tm), then one can obtainRps_kfrom (1):
whereB=γTpdenotes the signal bandwidth.
2.2 Standard polar format algorithm model for ISAR imaging
In order to obtain 2D ISAR image, FFT is usually carried on the slow time tm to yield the range-Doppler (RD)
image of a target. However, in high-resolution ISAR im-aging, RD algorithm will be invalid because of the pres-ence of the MTRC and time-varying Doppler. The Keystone algorithm can correct the linear MTRC, but it is invalid for the high-order MTRC and phase errors. After the correction of linear MTRC, the ISAR image with large rotation angle would be still blurred. Since both the range and Doppler curve are permitted in the PFA, both range-azimuth coupling and time-varying Doppler can be compensated well and yields a well-focused image. In this subsection, the standard PFA al-gorithm will be introduced and the maximum rotation angles of PFA will be analyzed with comparison to RDA and Keystone algorithm. The efficiency of PFA in MTRC compensation will be also illustrated.
LetKR=−(4π/c) (fc+f), then the phase term of (7) can
coordinate system. If the total target rotation angle Θ is known, the target image can be reconstructed from 2D Fourier transform (2D-FT). However, the FT algorithm re-quires a rectangular raster distribution of the data points, and the signal model can acquire a sector support region. Therefore, the interpolation of the observed signal on a polar sector support region to a Cartesian rectangular sys-tem is required.
As it is shown in Figure 2, the radial wavenumber KR
KR∈½KR1;KR2 ¼
The azimuth wavenumber is (4π/λ)⋅Θ.
An illustration of the PFA algorithm is shown in Figure 3. IfKR2cosΘ≤KR1, the interpolation error will rise withΘ
increasing, which results in a large vacant space in the wavenumber spectrum filled with stripe in Figure 3. To avoid this phenomenon, the maximum rotation angle for PFA imaging is constrained as:
ΘPFA ¼2 cos−1KR1 KR2
¼2 cos−1 1−0:5μ
1þ0:5μ; ð12Þ whereμ=B/fc. According to (10),ΘPFAis merely a
func-tion of μ independent of the target size and the range resolution. For comparison, the maximum rotation an-gles for RD and Keystone are given below. In order to avoid the MTRC, the maximum rotation angle for the RD algorithm in ISAR imaging should satisfy [2]:
1
where LX and LY denote the target size on the cross
range and slant range, respectively. For a fixed size tar-get, the maximum rotation angle for RD algorithm is:
ΘRD¼ min 2ρr
When the rotation theta Θin CPI is larger thanΘRD,
the MTRC and time-varying Doppler will occur failing RDA to generate optimal images.
The linear MTRC can be compensated using the Key-stone algorithm [5,6]. Given the target size LX and LY,
the Keystone algorithm restricts the maximum rotation angle by:
To present the analysis in an explicit manner, ISAR images of a simulated aircraft with the three different al-gorithms are presented in Figure 4. The aircraft is com-posed of 49 point scatterers with equal reflectivity. The size of the aircraft shown in Figure 4a is 20 m × 20 m. The radar transmits LFM signals with a carried fre-quency of 15 GHz and a bandwidth of 2 GHz. The range resolution is ρr= 0.075. From Equations (12), (14), and
(15), the maximum rotation angles of RD, Keystone, and PFA for the target in Figure 4 are ΘRD= 0.0075 rad =
0.43°,ΘKeystone= 0.032 rad = 1.82°, andΘPFA= 1.01 rad =
57.91°, respectively. Obviously,ΘPFAis much larger than
ΘRDand ΘKeystone. It must be declared that, it is difficult
to realize a uniform rotation for an azimuth angle of ΘPFA= 57.91°. In practical ISAR processing, a rotation
angle 6°∼10° is adaptive to obtain a relevant cross-range resolution. Even though, the value of the rotation angle is over the limitations of the RD algorithm and Keystone transform. When the radar observes the target flying sta-bly, the rotation velocity can be approximate as constant in the range of 6°∼10°. Therefore, the PFA is more
efficient and significant than RD algorithm and Keystone transform in high-resolution ISAR imaging.
In the above analysis, an underlying assumption is that the translational motion is compensated ideally and only the rotational motion is involved. With the development of the translational motion compensation algorithm, the assumption can be satisfied in much case. In order to obtain high cross-range resolution matching with the range resolution, the target coherent rotation angle is set to Θ= 0.2 rad and the rotational velocity is set to ω= 0.01 rad/s. In the dataset, the pulse repetition frequency (PRF) is 50 Hz, i.e., 1,024 pulses within dwell time [−10, 10] (s) are used. Meanwhile, the number of range bins in high-resolution range profile (HRRP) is N= 1,000. The RC and RP are both located at (0 m, 0 m) in the target coordinate system.
Figure 4b shows the ISAR image achieved by RDA. Since the rotation angle Θis larger than ΘRD, the
blur-ring effects caused by MTRC and time-varying Doppler can be found in both of the range cell and Doppler cell. The obtained ISAR image using the Keystone algorithm is shown in Figure 4c. It can be seen that the blurring in range cells caused by MTRC is compensated, but the blur in the Doppler dimension still remains. Figure 4d presents the ISAR image obtained by the PFA algorithm, where all target scatterers are optimally focused.
According to the algorithm analysis and simulations, the PFA has advantage on MTRC compensation with the resolution of radar increasing.
3 Analysis of the disturbance system in PFA 3.1 The performance degradation of PFA whenΔr≠0 According to Equations (8 to 10), one notes that when the RC locates at the cell of the RP, the phase term of the dechirped signals can be expressed in the polar format. Thus we can use the standard PFA algorithm to obtain a focused ISAR image, as shown in Figure 4. However, in practical applications, since the target is non-cooperative and the error of range measurement is unavoidable in the radar system, after translational motion compensation, RC is usually not coincided with RP. Assuming that the range difference between RC and RP is Δr=ra−r0, Equations
(8) and (9) can be expressed as:
R′ps
k ¼Δrþxksinθð Þ þtm ykcosθð Þtm ; ð16Þ
s′R4ðf;θÞ ¼ XK
k¼1 σkrect
f B
exp −j4π
c ðfcþfÞ Δrþxksinθð Þ þtm ykcosθð Þtm
: ð17Þ
Taking scattering pointpkfor example, its echo can be
formulated as:
s′R4kðf;θÞ ¼σkrect
Then, the phase term of Equation (18) is expressed by:
Φ′
Equation (19) indicates that the disturbed phase term
KRΔrcan cause the performance degradation when the
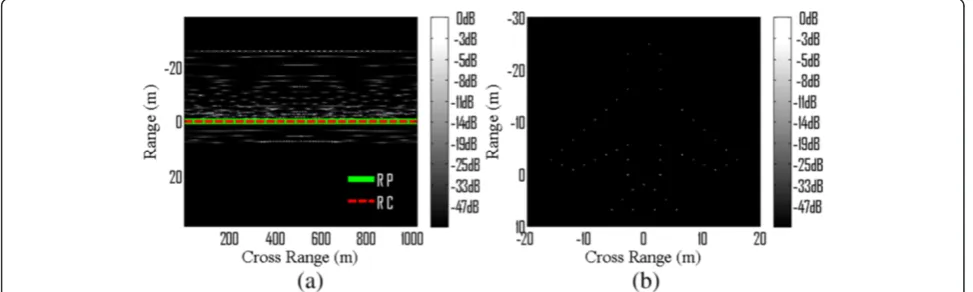
PFA algorithm is applied. For clarity, we provide some simulation results in Figure 5 to indicate the degradation of PFA image from the imprecise RC. The target is the one in Figure 4. The new given dechirped signals in Figure 5 have the RC highlighted by the red dashed line, which lo-cates at (0 m, 10 m) in the target coordinate system. The RP is highlighted by the white solid line in Figure 5a, lo-cating at (0 m, 0 m). The ISAR image achieved by the RDA is shown in Figure 5b and the imaging result achieved by PFA is given in Figure 5d. Compared to the image in Figure 4d, the blur in Figure 5b was not fully overcome by PFA.
3.2 Analysis and simulation of the disturbance system in PFA
According to the simulation above, the blur in the cross-range dimension of the image by PFA occurs when the RC is deviated from the RP. In this subsection, the influ-ence of the disturbed phase term KRΔr on PFA will be
analyzed in detail, by adopting the equivalence of a dis-turbance system. From Equation (10), since:
Kx¼KRsinθ
Supposing that the PFA interpolation has been carried on the echo in Equation (18), the echo s′R4k Kx;Ky
of (Kx,Ky) in a Cartesian coordinate system can be obtained.
Taking 2D FFT on the s′R4k Kx;Ky
, one can obtain the 2D spectrum of scattering pointpk:
S′R4kðX;YÞ ¼
Obviously, when Δr= 0, the 2D spectrum in Equation (22) has the form of the 2D Sinc function:
S′R4kðX;YÞΔr¼0¼sinc
where operation symbol⊗denotes the operator of the 2D convolution. The characteristics of Ψ(X, Y) are the key point of the analysis of the influence on S′R4kðX;YÞ.
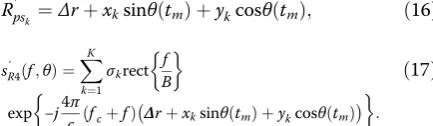
As a result, whenΔr≠0, the degraded PFA is equivalent to the output of the standard PFA model passing through a disturbance system denoted by Ψ(X,Y). The schematic diagram of the disturbance system Ψ(X,Y) is shown in Figure 6.
According to Figure 3, the value zone of Kx and Ky
Kx∈½Kx1;Kx2 ¼½−KR1⋅tanðΘ=2Þ;KR1⋅tanðΘ=2Þ Ky∈ Ky1;Ky2
¼½KR1;KR2⋅cosðΘ=2Þ :
ð27Þ
Since ψ(Kx, Ky) have the symmetrical format with
re-spect toKxandKy, we only need to analyze the FFT
dis-tribution of either one. The formulag(x) with respect to
xis given by:
g xð Þ ¼ expnjΔr⋅pffiffiffiffiffiffiffiffiffiffiffiffiffiffiffia2þx2o; ð28Þ whereaandΔrare constant. WhenΔr> 0, the FFT ofg (x) is given by:
G Xð Þ ¼
Z x2
x1
expnjΔr⋅pffiffiffiffiffiffiffiffiffiffiffiffiffiffiffia2þx2oe−j2πX⋅xdx: ð29Þ Figure 7a,b shows the curves of the g(x) phase term under the conditionsx2>x1≫0 andx2=−x1, respectively.
Figure 6The schematic diagram of the disturbance systemΨ(X,Y).
Figure 8The simulation results of scattering pointpk(13, 9). (a)The location of scattering pointpk(13, 9).(b)The ISAR image of RDA.(c)The ISAR image under standard PFA model.(d)The 2D distribution ofΨ(X,Y).(e)The 2D spectrum of the FFT results on theKxdimension.(f)The 1D slice of the 2D spectrum in(e).(g)The 2D distribution of the FFT transform result onKydimension.(h)The 1D slice of the 2D spectrum in(g). (i)The ISAR image after PFA interpolating withΔr≠0.
By comparing between Figure 7a and b, one can observe that the phase term is approximately linear toxwhenx2>
x1≫0, while it has quadratic phase if x2=−x1. Further-more, the smallerxis, the more distinct the quadratic fea-ture ofg(x) phase term is. For a limited time signal with linear phase and rectangular envelope, its spectrum per-forms as a Sinc function [23], since the signal can be ap-proximated by a point frequency signal. The signal with quadratic phase is somewhat like a LFM signal, and its spectrum will be widened around the center frequency. In a nutshell, the spectrum ofG(X) is related with the integral region [x1,x2]. Simulations in Figure 8 are given to analyze of the disturbance systemΨ(X,Y). Take the signal model in Section 3.1 for example, the interval ofKxand Ky can be
calculated as:
Kx∈ −½ KR1⋅tanðΘ=2Þ;KR1⋅tanðΘ=2Þ ¼½−58:84;58:84
Ky∈½KR1;KR2⋅cosðΘ=2Þ ¼½586:43;666:85 :
ð30Þ
For generality, we take the scattering point pk at (xk, yk) = (13, 9) for example, as shown in Figure 8a. By
ap-plying RD and PFA algorithms to the simulated standard
PFA signal, the obtained ISAR images ofpkare shown in
Figure 8b,c, respectively. The blurring in range cells and Doppler cells caused by the MTRC in the RD model is compensated. The 2D spectrum of disturbance system Ψ(X,Y) is shown in Figure 8d. Figure 8e,f,g,h illustrates the one-dimensional (1D) distributions of Ψ(X,Y) along cross-range axesXand range axesY. SinceKy2>Ky1≫0
andKx2=−Kx1, one can see from Figure 8d, e, f, g, h that
the spectra in the cross range are much wider than the ones in the slant range. According to the definition and characteristics of 2D convolution [24,25], the output
S′R4kðX;YÞjΔr¼0 of the ideal PFA image will be widened
in the cross range caused by the disturbance system Ψ(X, Y). As a result, the final output is blurred in the cross range and focused in slant range, (Figure 8i).
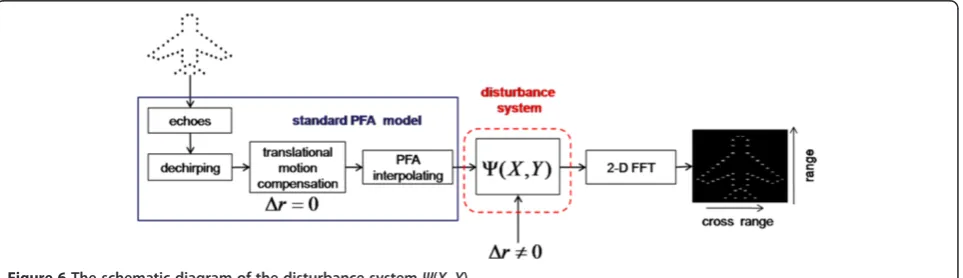
Furthermore, the influence of Δrand Θvalues on the disturbance system Ψ(X, Y) is analyzed. When Θ= 0.2 rad is fixed, the distributions of Ψ(X) and Ψ(Y) under different values ofΔrare shown in Figure 9, whereΔr∈
{2, 6, 10, 14, 18} m. With the distance of RC and RP in-creasing, Ψ(X, Y) is widened in the cross range and shifted in the slant range. The distributions ofΨ(X) and Ψ(Y) under different values of rotation angleΘis shown
Figure 10The influence of the value ofΘonΨ(X,Y). (a)Distributions ofΨ(X) under different values ofΘ.(b)Distributions ofΨ(Y) under different values ofΘ.
in Figure 10, where Θ ∈ {0.05, 0.1, 0.15, 0.2, 0.25, 0.3} rad and Δr= 10 m. Similarly to the results in Figure 9, Ψ(X,Y) is widened in the cross range and shifted in the slant range withΘincreasing. Particularly, when the ro-tation angleΘis small enough, the spectrum of Ψ(X,Y) in the cross range trends to the impulse function. At this level, one can obtain the formulas
Kx¼KRsinθ≈KR⋅θ
Ky ¼KRcosθ≈KR⋅ 1−θ2=2
ffiffiffiffiffiffiffiffiffiffiffiffiffiffiffiffiffi
K2 xþK2y q
≈Ky
:
8 > < > :
ð31Þ
Then, the phase term of Pk echo is approximately
equal to:
Φkð Þ ¼θ KR Δrþxksinθþykcosθ
¼KRΔrþKxxkþKyyk
≈Ky⋅ΔrþKxxkþKyyk
: ð32Þ
Apparently, Δr only produces translation in the cross range without the blurring in the slant range. Actually, the signal model becomes the RD model whenΘis small.
From the analysis and simulations above, we can note that, because of the range measurement errors and the target's non-cooperative motion, the disturbed phase term remained after data-driven translational compensa-tion and the blur in the cross-range dimension is in-duced. Furthermore, with the increasing of Δr and Θ, the blur in the cross-range dimension becomes serious. As a conclusion, the accurate rotation center is essen-tially significant for PFA imaging for ISAR targets and only accurate estimation of RC can overcome the blur after PFA.
4 PFA revision based on integrated cubic phase function
According to the theoretical analysis of the PFA algorithm, if the RC on the slant range is not overlapped with the RP,
the blur in cross-range cells remains after. In order to solve this problem, the dechirped signals after the transla-tional compensation are shifted in the slant range, and the RC is located at the center of the HRRP. As a result, the effect of the disturbance system caused by Δr can be eliminated.
It is well known that the RP is located at the center of the HRRP. Therefore, the location of RC in HRRP is r′a
t
ð Þ ¼Δr¼rað Þt −r0ð Þ. When the estimation valuet Δ^r of
Δris obtained,s′R4ðf;θÞis shifted in the slant range, and the new dechirped signalssR5(f,θ) can be written as:
sR5ðf;θÞ ¼sR4′ ðf;θÞ⋅exp −j
4π
c ðfcþfÞΔ^r
¼X K
k¼1 σkrect
f B
expj4π
c ðfcþfÞ½ Δr−Δ^r
þ xksinθð Þ þtm ykcosθð Þtm
g
:
ð33Þ
If the value of Δ^r is equal toΔr, thenΔr−Δ^r¼0. The shifted signals in Equation (33) become:
Figure 11Coefficient of quadratic phase estimated by ICPF method.
sR5ðf;θÞ ¼s′R4ðf;θÞ⋅exp −j
From formula (34), the shifted signals have the same format as Equation (9). s′R4ðf;θÞ is converted into a standard PFA formation. When the PFA algorithm is performed on the revised signal sR5(f, θ), the MTRC of s′R4ðf;θÞcan be compensated accurately.
Note that, in Equation (33), the RC should be esti-mated firstly. Herein, we propose a method based on ICPF to estimate the rotation motion information. The ICPF extends the CPF and provides improved estimation of multi-component chirp signals [26].
By applying the FFT to the dechirped signal, the HRRP is obtained.
During the CPI, if the rotation angle of the target is not too large (e.g., Θ< 20°), cos θ(t) and sin θ(t) can be approximated by the second-order Taylor expansion. Only accounting the second-order phase terms, the sig-nal expression can be rewritten as:
S Yð ;tmÞ ¼sinc
Based on the uniform rotation assumption, the rota-tion angle θ(t) can be expressed asθ(t) =ωt, whereω is
It can be noted that the signal in a certain range cell is a chirp signal in azimuth, with chirp rate Γ= 2ykω2/λ.
For the rotation center, the chirp rate of the signal equals to zero, due to yk= 0. When RC is distant from
RP, the location of RC in ISAR image can be marked as
pRC(xRC,Δr). Therefore, RC can be estimated by
search-ing the range cell with the minimum chirp rate. The cubic phase function is a 2D bilinear mapping operator
to estimate the parameters of a chirp signal [14]. For a single-component cubic phase signal, stantaneous chirp rate is given by:
ICR¼d 2ϕð Þt
dt2 ¼2ða2þ3a3tÞ: ð39Þ
The cubic phase function is defined as a 2D bilinear transform of the signal as:
CPFðt;ΩÞ ¼
where Ω represents the instantaneous chirp rate index for the spectrum of the cubic phase function. Obviously, CPF (t,Ω) reaches the peaks along the curveΩ= 2(a2+
3a2t). Thus, the peaks of the CPF can be used for the
ICR estimation. The instantaneous chirp rate estimate is:
ICR^ ¼ arg max
Ω ½CPFðt;ΩÞ: ð41Þ
For a chirp signal, the energy of the CPF is concen-trated along straight lines Ω= 2a2 in the t−Ω domain. The CPF has been verified to be highly efficient in ana-lyzing the mono-component signal even at low signal-to-noise ratio. However, when the algorithm is applied to multi-component signals, the distinct cross terms and
spurious peaks will occur. The auto terms of the CPF are distributed around the straight lines which are paral-lel to the time axis. The interference including cross terms and spurious peaks disperse over the time and fre-quency rate domain. For multi-component chirp signals, the number of cross terms isK2−K, and that will merge into (K2−K)/2 spurious peaks in the time and chirp rate domain, whereKis the number of the signal components.
To enhance the auto terms and suppress the cross terms, ICPF is proposed [26,27]. For either single- or multi-component linear frequency modulated signals, ICPF provides improved estimation accuracy and better performance in cross-term rejection than the standard CPF-based approach. In this paper, the ICPF is exploited to estimate the chirp rate of the multi-component linear frequency modulated signals. ICPF integrates the energy of auto terms, yielding distinct peaks in the time and fre-quency rate domain, by which, the chirp rate can be eas-ily determined by finding the highest peak.
ICPFð Þ ¼Ω
The procedure of the RC estimation based on ICPF is summarized as follows. First, conventional translational motion compensation, including range alignment and the phase compensation [28-31], should be performed. Sec-ond, the Keystone transform is used to correct the linear MRTC as much as possible. It should be emphasized that, in the wide-angle ISAR imaging, the Keystone usually can-not correct the distinctive high-order MRTCs, but it still plays a significant role for a better estimation of the chirp rate with ICPF. Then, the estimate of the quadratic phase for the multi-component linear frequency modulated sig-nals in different range cells can be obtained by:
^
Γð Þ ¼n 1
2ICR^ ð44Þ
wheren∈[1,N] denotes the serial number of the range cell and Nis the number of range cells. Therefore, the position of RC can be estimated by:
Δr¼ arg min CPI can be calculated by:
Θn¼ω⋅Tp¼
It should be noted that in some slant-range cells there are no presence of dominant scatterers, where significant estimate error would involve. To improve the accuracy of the estimatedΘ, the least mean square error (LMSE) method can be applied for fitting a linear function of the chirp rate, and an improvedΘ^ is achieved.
^
Θ¼ELMSEð ÞΘn ð47Þ
Figure 11 shows the estimated coefficient of quadratic phase terms along the slant range with the ICPF. By the proposed LMSE fitting, the RC is determined at the range gate 10.1 m and the estimated rotation angle isΘ^ ¼11:2∘.
As it is shown in Figure 12a, the RC was shifted to the center of the HRRPS according to the estimated RC in Figure 11. Taking PFA on the shifted signals, the com-pensated ISAR image is obtained in Figure 12b. Since the disturbance of the echoes in Section 3 is revised, the MTRC was fully compensated and the PFA image was well focused.
5 Experiment and performance analysis
In the first experiment, simulated data of aircraft (MIG-25) [1] were used. The aircraft is composed of 120 point scatterers with equal reflectivity. The radar transmits LFM signals with a carried frequency of 9 GHz and a bandwidth of 512 MHz. It was assumed that the aircraft only has rotational motion.
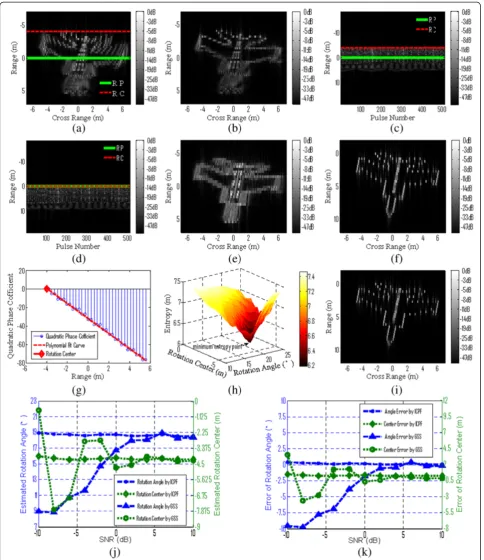
Figure 13a shows the image obtained by using RDA without MTRC and time-varying Doppler compensation, where the blurring effects are evident. The RC is located at −4.1 m, which was estimated by ICPF in Figure 13g and highlighted by a dashed line in Figure 13c. The esti-mated rotation angle is Θ^ ¼18:5∘. Figure 13b presents the ISAR image after MTRC compensation with the Keystone transform, where the blur in the cross-range direction still exists. As shown in Figure 13e, since the RC was not located at the same position as the RP, the image obtained by straight forward application of PFA was blurred. With the proposed ICPF estimation of RC, the HRRPs of shifted signals are shown in Figure 13d and the image with PFA is shown in Figure 13f, where compensation of both rotation induced MTRC and time-varying Doppler is achieved in an optimal manner. (See figure on previous page.)
And well-focused ISAR imagery of the aircraft is ob-tained. By these result, the effectiveness of the proposed RC estimation for PFA imaging is justified clearly.
For comparison, another method using PFA presented in ref. [20] was used to compensate the simulated data. The method presented in [20] is a non-parametric algo-rithm via golden section search (GSS), which applies the PFA on the translational compensated data iteratively to search the optimization solution based on minimum en-tropy criterion. The accurate rotation angle and center are obtained when the entropy of the ISAR image is minimized. Meanwhile, the MTRC can be compensated and the ISAR image will be best focused. Figure 13h de-picts the ISAR image entropy after MTRC compensation with different rotation angles and centers. The minimum entropy is achieved at the position (18.3°, −4.2 m, 6.24), where 18.3° and−4.2 m are the rotation angle and cen-ter, respectively. After 2D iteratively searching, the esti-mated rotation center and angle are −4.2 m and 18.3° and the compensated image is shown in Figure 13i. Comparing Figure 13f with Figure 13i, we can note that the two methods have similar compensational perform-ance. However, in the aspect of computational efficiency, as the interpolation in PFA is time-costly, the method in ref. [20] is much less efficient than the proposed one. The consuming CPU time of the method in ref. [20] and proposed one is 35.39 s and 6.23 s, respectively. Addition-ally, we plot the estimated results and errors correspond-ing to different SNRs in Figure 13j, k, in order to show the robustness of the proposed method. The true values of the rotation angle and center are 18.5° and −4.1 m, respect-ively. The estimated error is denoted by the difference be-tween the estimated value and the true value. From Figure 13j,k, we note that effective rotation parameter esti-mation is achievable even if SNR decreases down to−10 dB and the estimate accuracy degrades slightly with the in-crease of strong noise. Contrarily, the estimation by the method in ref. [20] is sensitive to the strong noise, leading to serious errors in the result.
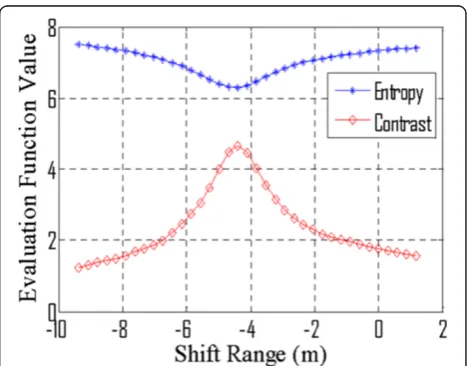
In order to show the importance of precise RC for PFA imaging, we performed the following test. Figure 14 depicts the entropy and contrast of the ISAR images from polar format interpolating with different shift ranges. The more focused the image is, the smaller the entropy is and the larger the contrast is [14,31,32]. From Figure 14, the minimized entropy and the maximized contrast are achieved when the shift range is −4.1 m. It illustrates that, the closer the shift range and RC are, the more focused the compensated ISAR image is and con-sequently the more efficient the PFA is.
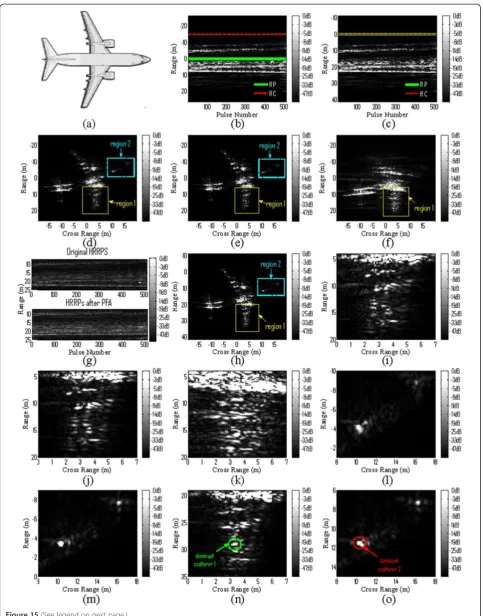
In the second experiment, the real data provided by ATR National Defense Science and Technology Key La-boratory were used to analyze the performance of the proposed method. The data were collected by a ground-based imaging radar. The target is a stably flying airplane of Boeing 737, whose model is shown in Figure 15a. The carrier frequency is 10 GHz and the bandwidth is 1 GHz, providing a range resolution of 0.15 m. In order to obtain high cross-range resolution matching with the range resolution, the rotation angle in CPI should exceed 5.7°. Thus 512 pulses are used in the dataset and Θ is about 8°.
Herein, the translational compensation was firstly carried on the echoes. The aligned profiles are shown in Figure 15b. By using the ICPF algorithm, the estimated rotation angle is Θ^ ¼8:03∘ and the RC locates at range−15 m, which is highlighted in Figure 15b. As it is shown in Figure 15c, the RC was shifted to the center of the HRRPS according to the estimated RC. For comparison, the RDA, Keystone al-gorithm, and traditional PFA were carried on the data in Figure 15b, and the images are shown in Figure 15d, e, f.
Figure 16PSF images corresponding to different algorithms of two dominant scattering centers. (a)Images of scatterer 1 along cross-range dimension.(b)Images of scatterer 2 along range dimension.
Table 1 Entropy and contrast evaluation
Evaluation function
RDA Keystone Traditional
PFA
Improved PFA
Entropy 9.23 8.92 12.3 8.37
From Figure 15d, the blurring effects caused by MTRC in both of the range and Doppler cell can be found in the RD image. The image using the Keystone algorithm in Figure 15e illustrates that the MTRC in the slant-range mension is compensated but the blur in the Doppler di-mension still remains. As shown in Figure 15g, when one utilizes PFA on the dechirped signals directly, the image is blurred in the cross-range direction. The aligned pro-files and 2D image after PFA interpolation on the shifted data are shown in Figure 15g, h. In order to be clearer, the detailed exhibitions of the local regions are given in Figure 15i, j, k, l, m, n, o. Comparing Figure 15i, j, k , l, m with Figure 15n, o, one can observe that more focused image was obtained by the proposed method.
From Figure 15n, o, two dominant scatterers are chosen in range 29.3 m and 11.5 m. We plot the dom-inant scatterers corresponding to different algorithms respectively along the cross-range and range dimen-sions in Figure 16, in order to show the improvement on the point spread function (PSF) by the use of the improved PFA. From Figure 16, we note that the blur caused by MTRC both in range and cross-range dimen-sions was compensated by the proposed method.
What is more, we use image entropy and contrast value to evaluate the focused images in Figure 15, which are presented in Table 1. It is notable in Table 1 that a well focused ISAR image was obtained by using the im-proved PFA.
6 Conclusions
In this paper, the limitations of the PFA algorithm for high-resolution ISAR imaging are analyzed. The difference between RC and RP produces a disturbance system and results in the distribution of the 2D scatterer mismatch in the polar format. As a result, the image is blurred in the cross range from PFA. To solve this problem, RC estima-tion via ICPF is proposed before PFA interpolaestima-tion. Then the dechirped signals after translational compensation are shifted along the slant range in order to make the rotation center be located at the center of the HRRP. Conse-quently, well-focused wide-angle ISAR images can be ob-tained with PFA. Experiments with both simulated and real data show that the proposed method provides a promising performance. However, this model restricts the rotational motion model, leading to limitations on specific scenarios, such as the space target and the civil aviaton aircraft moving stably. The complex motion of maneuver-ing target, such as battleplane and missile, could include 3D rotation and deviation. In this case, the MTRC com-pensation in high-resolution ISAR imaging is still open. Thereby, extending the analysis and compensation to the 3D plane or non-uniform rotation is a significant and con-tinual work in the future.
Competing interests
The authors declare that they have no competing interests.
Acknowledgements
This work was supported in part by the National Natural Science Foundation of China (No. 61002025). The authors would also like to thank the editors and the anonymous reviewers for their helpful comments and suggestions.
Received: 6 August 2014 Accepted: 21 November 2014 Published: 13 December 2014
References
1. CC Chen, H.C. Andrews, Target motion induced radar imaging. IEEE Trans. Aerosp. Electron. Syst.16, 2–14 (1980)
2. F Zhou, X Bai, M Xing, Z Bao, Analysis of wide-angle radar imaging. IET Radar. Sonar. Navig.5, 449–457 (2011)
3. M Xing, R Wu, J Lan, Z Bao, Migration through resolution cell compensation in ISAR imaging. IEEE Geosci. Remote Sens. Lett.1, 141–144 (2004)
4. Y Wang, YC Jiang, A novel algorithm for estimating the rotation angle in ISAR imaging. IEEE Geosci. Remote Sens. Lett.5, 608–609 (2008) 5. H Ruan, YH Wu, X Jia, Novel ISAR imaging algorithm for maneuvering
targets based on a modified keystone transform. IEEE Geosci. Remote Sens. Lett.11, 128–132 (2014)
6. JB Zheng, WT Zhu, QH Liu, ISAR imaging of targets with complex motions based on the Keystone Time-Chirp rate distribution. IEEE Geosci. Remote Sens. Lett.11, 1275–1279 (2014)
7. WG Carrara, RS Goodman,Spotlight Synthetic Aperture Radar Signal Processing Algorithms(Artech House Inc, MA, Boston, 1995), pp. 152–154 8. JM LeCaillec, SAR remote sensing analysis of the sea surface by polynomial
filtering. IEEE Trans. Signal Process.24, 105–107 (2007)
9. T Yu, MD Xing, B Zhen, The polar format imaging algorithm based on double chirp-Z transforms. IEEE Geosci. Remote Sens. Lett.5, 610–614 (2008) 10. ZM Yang, GC Sun, YF Wu, MD Xing, A new fast back projection algorithm
using polar format algorithm. J. Electron. Inf. Technol.36, 373–376 (2013) 11. DL Mensa,High Resolution Radar Imaging(Artech House Inc, Dedham, MA,
1981), pp. 87–89
12. HQ Wu, D Grenier, GY Delisle, Translational motion compensation in ISAR image processing. IEEE Trans. Image. Proc.4, 1561–1571 (1995) 13. L Zhang, JL Sheng, J Duan, Translational motion compensation for ISAR
imaging under low SNR by minimum entropy. EURASIP J. Adv. Signal. Process.33, 1–17 (2013)
14. M Martorella, F Berizzi, S Bruscoli, Use of genetic algorithms for contrast and entropy optimization in ISAR autofocusing. EURASIP J. Adv. Signal. Process
87298, 11 (2006)
15. L Stanković, T Thayaparan, V Popovi, I Djurović, M Daković, Adaptive s-method for SAR/ISAR imaging. EURASIP J. Adv. Signal. Process593216, 10 (2008) 16. F Prodi, ISAR cross-range scaling using a correlation based functional, in
Radar Conference, 2008. RADAR '08(IEEE, Rome, 2008), pp. 1–6
17. M Yeh, J Xu, YN Peng, XT Wang, Cross-range scaling for ISAR based on image rotation correlation. IEEE Geosci. Remote Sens. Lett.6, 597–601 (2009) 18. JM Hu, W Zhou, YW Fu, Uniform rotational motion compensation for ISAR
based on phase cancellation. IEEE Geosci. Remote Sens. Lett.8, 636–641 (2011) 19. Y Liu, JW Zou, SY Xu, ZP Chen, Nonparametric motion compensation
technique for high-resolution ISAR imaging via golden section search. Prog Electromagnetics Res M.36, 67–76 (2014)
20. Y Liu, H Li, N Li, SY Xu, ZP Chen, MTRC compensation in high-resolution ISAR imaging via improved polar format algorithm, in2014 Security & Defence Conference(Proceedings of SPIE, Amsterdam, Netherlands, 2014). doi:10.1117/ 12.2066089
21. JJ de Witt, WAJ Nel, Range Doppler dynamic range considerations for dechirp on receive radar, inProceeding of 5th European Radar Conference
(Amsterdam, Netherlands, 2008), pp. 136–139
22. DY Zhu, A novel approach to residual video phase removal in spotlight SAR image formation, inRadar Systems, 2007 IET International Conference(IET, Edinburgh, UK, 2007), pp. 15–18
23. BP Lathi,Signal Processing and Linear Systems(Oxford University Press, New York, 1998), pp. 256–265
30. F Berizzi, G Corsini, Autofocusing of inverse synthetic aperture radar images using contrast optimization. IEEE Trans. Aerosp. Electron. Syst.32, 1185–1191 (1996)
31. J Wang, X Liu, Z Zhou, Minimum-entropy phase adjustment for ISAR. IEE Proc. Radar Sonar Navig.151, 203–209 (2004)
32. JF Wang, D Kasilingam, Global range alignment for ISAR. IEEE Trans. Aerosp. Electron. Syst.39, 351–357 (2003)
doi:10.1186/1687-6180-2014-179
Cite this article as:Liuet al.:MTRC compensation in high-resolution ISAR imaging via improved polar format algorithm based on ICPF. EURASIP Journal on Advances in Signal Processing20142014:179.
Submit your manuscript to a
journal and benefi t from:
7 Convenient online submission 7 Rigorous peer review
7 Immediate publication on acceptance 7 Open access: articles freely available online 7 High visibility within the fi eld
7 Retaining the copyright to your article