long-period ground motions. Finite difference (FD) simulations by our three-dimensional underground structure model agree well with long-period observed ground motions at several rock sites in the Kinki area. We found that a sedimentary wedge structure along the Nankai trough amplifies and elongates long-period ground motions from this event. We also examine the effect of source depth for this event by comparing the observed with synthetic waveforms. These results suggest that precise modeling of the shallower parts of the underground structure, such as the sedimentary wedge, are quite important for long-period ground motion simulation of the hypothetical Nankai and Tonankai earthquakes.
Key words: Long-period ground motion simulation, foreshock of the 2004 off the Kii peninsula earthquakes, Kinki area, FDM, underground structure model.
1.
Introduction
Two large earthquakes withMJ 7.1 and 7.4 rocked
Hon-shu from Kanto to KyuHon-shu on 5 September 2004 (Japan Me-teorological Agency, 2004). These events occurred off the Kii Peninsula in the shallower part of the subducting Philip-pine Sea Plate. They are located as the source region of the expected Tonankai earthquakes. During those events, many strong ground-motion records were obtained by the nationwide networks K-NET and KiK-net of NIED (The National Research Institute for Earth Science and Disas-ter Prevention), and local networks such as CEORKA (The Committee of Earthquake Observation and Research in the Kansai Area). Well-developed, long-period ground motions were commonly observed at the stations in large sedimen-tary basins such as the Osaka basin and the Kanto basin (e.g., Iwataet al., 2004; Miyake and Koketsu, 2005).
The characteristics of long-period ground motion in sed-imentary basins during a large earthquake are one of the most important issues for mitigating earthquake ground motion disaster. Recently, many oil tanks at Tomako-mai, located in the Yufutsu sedimentary basin, were dam-aged by the long-period ground motions during the 2003 Tokachi-oki earthquake (Coffin and Hirata, 2003), although Tomakomai is about 200 km away from the source region. The amplification and elongation of long-period ground motions generated from this large event occurred because of propagation effects within the large sedimentary basin (e.g., Koketsuet al., 2005).
The Osaka sedimentary basin is located about 150 km
Copy right cThe Society of Geomagnetism and Earth, Planetary and Space Sci-ences (SGEPSS); The Seismological Society of Japan; The Volcanological Society of Japan; The Geodetic Society of Japan; The Japanese Society for Planetary Sci-ences; TERRAPUB.
away from the source regions of the hypothetical Tonankai and Nankai earthquakes. From now on, will just call these regions the ‘source regions’. The headquarters for earth-quake promotion reported that a long-term evaluation of oc-currence potentials of the next Nankai and Tonankai earth-quakes are 50 to 60 percent within 30 years from 2005. Modern mega-cities such as Osaka and Kobe in the Os-aka sedimentary basin have never experienced long-period ground motions from an M8-class earthquake. There-fore, it is very important to predict long-period ground motions in this area during hypothetical large earthquakes along the Nankai trough. To accomplish quantitative long-period ground-motion simulations, we need to construct a three-dimensional underground structure model includ-ing the source regions and the Kinki area. The under-ground structure models in this area have been constructed by several researchers (e.g., Kagawaet al., 2002; Yamada and Iwata, 2004). However, it has been hard to validate them because of little ground-motion data from events in or near the source region, especially from the viewpoints of long-period ground motion (e.g., Yamada and Iwata, 2004; Hayakawaet al., 2005).
Sufficient-quality ground-motion data in the wide period range from the 2004 off the Kii peninsula earthquakes en-able us to confirm the validity of the underground structure model. In this paper, we simulate the long-period ground motions in the Kinki area during the MJ 7.1 foreshock of
a sequence of the 2004 off the Kii peninsula events. They will be used to predict long-period ground motions from the hypothetical Nankai and Tonankai earthquakes.
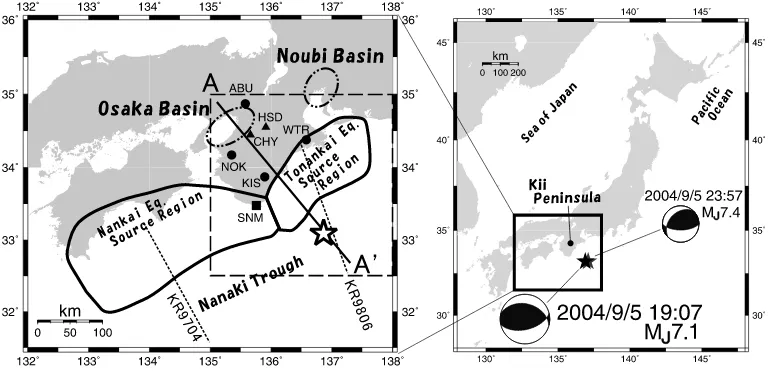
Fig. 1. Maps of the study area. (Right) Locations of the epicenters and mechanism solutions are shown. The target event is the foreshock ofMJ7.1. The
main shock ofMJ7.4 earthquake occurred five hours after the foreshock (Japan Meteorological Agency, 2004). (Left) Detailed map of the rectangular
area in the right figure. Station positions are indicated by the closed square (ERI), circles (NIED) and triangles (CEORKA), respectively. The star denotes the epicenter of the target event. The rectangular area with broken lines indicates an FD calculation area for long-period ground-motion simulation, and the area with bold curves indicate the source region of the hypothetical Nankai and Tonankai earthquakes. The A-Aline shows the location of the profile in Fig. 2. KR9704 and KR9806 indicate the exploration survey lines by Nakanishiet al. (2002) and Obanaet al. (2003).
Fig. 2. Schematic cross-section of the underground structure along the A-Ain Fig. 1. The star denotes the hypocenter of theMJ7.1 event, and the
thick line indicates the source region of the hypothetical Tonankai earthquake. The layer numbers correspond to those shown in Tables 1 and 4.
2.
Construction of 3D Propagation-Path Model
Although the characteristics of long-period ground mo-tion in a sedimentary basin such as the Osaka basin are con-trolled by not only the basin input motions but also the basin structure, we focus our attention on the former. The input motions are further controlled by the three-dimensional un-derground structure model between the source region and the Osaka basin, which we will call the ‘3D propagation-path model’. As shown in Fig. 1, we construct the 3D propagation-path model in the region enclosed within the broken square. We also show rock site stations in this fig-ure.
For the 3D propagation-path model, we refer to several previous studies—the depth contour map of Philippine Sea plate provided by Nakamuraet al. (1997), the depth of the Conrad and Moho discontinuities obtained by Zhaoet al. (1994), and the results of seismic explorations along the lines KR9704 and KR9806 in Fig. 1 (Nakanishiet al., 2002; Obanaet al., 2003). We also refer to the 3D underground structure models by Furumuraet al. (2003) and Yamada and Iwata (2004). In our propagation-path model, we assumed eight homogeneous layers. Figure 2 shows a schematic cross-section of the propagation-path model along the
A-Aline in Fig. 1. The density, P-wave velocity (V p) and S-wave velocity (V s) of each layer are shown in Table 1. ForV pand density we follow the previous studies, andV s is derived assumingV p/V s =1.7.
We introduce the sedimentary wedge produced by the subduction of the Philippine Sea plate to the 3D propagation-path model, as shown by layer 1 in Fig. 2. It lies parallel to the Nankai trough and its maximum thick-ness of the wedge is about 7 km, as reported by Nakanishi et al. (2002). The distributions of several layer boundaries of the 3D propagation-path model are shown in Fig. 3. Fig-ure 4 shows the north-south profile of this model by the discreted data with 1 km for FD calculation along the line through the hypocenter. We don’t consider seawater and surface topography in our model.
3.
Ground Motion Simulation
Fig. 3. Depth contour maps of layer boundary in the 3D propagation-path model. Each contour corresponds to the basement of the sedimentary wedge, Conrad discontinuity, Moho discontinuity, and the top of the Philippine Sea Plate, respectively. The ground motion simulation area is surrounded by a thick rectangle. The dotted line indicates the line of profile in Fig. 4. Numbers on contour lines show the depth in km.
Fig. 4. Vertical cross-section of the 3D FD velocity model along the north-south profile crossed the hypocenter of theMJ 7.1 event. The
numbers correspond to the layer numbers, as shown in Table 1.
The target event is theMJ 7.1 foreshock of the 2004 off the
Kii peninsula earthquake on 5 September at 19:07 (JST). The epicenter and source mechanism are shown in Fig. 1 and their parameters are listed in Table 3. Referring to the source-time function obtained by Yagi (2004), we assumed a point source with a simplified source-time function con-sisting of two continuous isosceles triangles, with a com-mon base time length of 7.5 s. We compare the source time function of Yagi (2004) with that we assumed in Fig. 5. The M0 is set to be 5.3×10¹⁹ Nm. We locate the source at a
depth of 18 km, which corresponds to the hypocenter depth
Model dimensions 299×292×75 Grid spacing 1.0 km
Time step 0.061859 s Total time step 3880 (240.0 s)
Table 3. Source parameters for the simulation.
latitude 33.09 logitude 136.63
depth 18 km
strike N280◦E
dip 42◦
rake 105◦
point source source duration 15.0 s (7.5 s×2)
Fig. 5. The source time function obtained by Yagi (2004) is the broken line (hand-digitized), and the assumed simplified source time function that consists of two continuous isosceles triangles is the solid line in this ground motion simulation.
of Yagi (2004).
Fig. 6. Comparisons of observed ground-velocity records with simulated ones for the 3D propagation-path model. All traces are band-pass filtered from 5 to 20 s, with same amplitude scale. Top and bottom traces for each station show the observed motion and the synthetics, respectively. The peak velocity amplitude of each trace is shown at below each trace in cm/s. The epicentral distances in km are put below each station code. Station locations are indicated in Fig. 1.
Fig. 7. Comparisons of observed ground velocities with synthetics at SNM and KIS for four different source depth cases. All traces are band-pass filtered from 5 to 20 s, and scaled to the same amplitude. From top to bottom, the observation and the synthetics of the four cases are shown.
the long-period feature of the observed ground motions at the rock sites is recovered well. It is noted that the observed record even at SNM, which the closest station to the epicen-ter, has duration as long as several minutes. As the source duration is 15 s (7.5 s×2), this long duration may be caused by the very thick sedimentary wedge between the source and stations.
Here we show effects of the source depth and the veloc-ity structure on the synthetics to confirm the validveloc-ity of our
Fig. 8. Comparisons of observed ground velocities with synthetics at SNM, KIS, and WTR for five different velocity models as shown in Table 4. All traces are band-pass filtered from 5 to 20 s, and scaled to the same amplitude. From top to bottom, the observation and the synthetics of the five cases are shown.
Table 4. S-wave velocity in km/s of each layer for five different underground structure models.
Layer No. Model 1 Model 2 Model 3 Model 4 Model 5 (reference model)
1 3.23 1.10 3.23 1.65 1.10
2 3.23 3.23 3.23 3.23 3.23
3 3.53 3.53 3.53 3.53 3.53
4 3.94 3.94 3.94 3.94 3.94
5 4.60 4.60 4.60 4.60 4.60
6 2.90 4.70 4.70 2.90 2.90
7 4.00 4.70 4.70 4.00 4.00
8 4.70 4.70 4.70 4.70 4.70
synthetics for the depth of 39 km. On the contrary, the syn-thetics for the depths of 13 and 18 km reproduce the obser-vations well. Therefore, we adopted the source depth of 18 km for the simulations in Fig. 6.
Second, we test the effects of the medium velocities in the 3D propagation-path model on the synthetic waveforms. We introduce five different velocity models whose V s are listed in Table 4. The ratio of V p and V s is kept at 1.7 in the whole model. We are mainly concerned with the effects of the sedimentary wedge and the oceanic crust, so that only the velocities at these parts are varied. ‘Model 5’ is a reference model, which was used for the simulation in Fig. 6. Model 1 does not include a sedimentary wedge,
observed waveforms. Models 4 and 5 have differentV sin the sedimentary wedge. The later-phase arrivals at about 60 to 80 s for the lowerV smodel (Model 5) agree better with those of the observations.
4.
Conclusion
We performed long-period (5–20 s) ground motion sim-ulations during the MJ 7.1 foreshock of the 2004 off the
Kii peninsula earthquake in the Kinki area. We constructed a 3D propagation-path model that included the source re-gion and Osaka basin area. It consists of the subducting Philippine Sea slab, crust, and sedimentary wedge. Our 3D propagation-path model with an appropriate source model reproduces well the observed long-period ground motions at several rock sites in the Kinki area. We also found that the sedimentary wedge amplifies and extends the duration of long-period ground motions from this event. These re-sults suggested that the precise modeling of the shallower part in the underground structure including the sedimen-tary wedge is quite important for long-period ground mo-tion simulamo-tion of hypothetical Nankai and Tonankai earth-quakes. On a basis of this simulation, we are now starting to simulate ground motions using the more appropriate 3D propagation-path model including Osaka basin in order to explain observed long-period ground motion in the Osaka basin.
Acknowledgments. We thank the organizations who provided some observed records: National Research Institute for Earth Sci-ence and Disaster Prevention (NIED); the Committee of Earth-quake Observation and Research in the Kansai Area (CEORKA); and Earthquake Research Institute, University of Tokyo (ERI). We also thank Prof. K. Koketsu and Dr. R. W. Graves for their careful reviews of the manuscript and their useful suggestions. This study is partially supported by Special Project for Earthquake Disaster Mitigation in Urban Areas of the Ministry of Education, Science and Culture, Japan. Some figures were made using the GMT plot-ting package (Wessel and Smith, 1995).
References
Coffin, M. and N. Hirata, Large earthquake strikes Hokkaido, Japan,EOS Trans. AGU,84, 442, 2003.
Furumura, T., B. L. N. Kennett, and K. Koketsu, Visualization of 3D wave propagation from the 2000 Tottori-ken Seibu, Japan, Earthquake: Observation and numerical simulation,Bull. Seism. Soc. Am.,93, 870– 881, 2003.
Graves, R. W., Simulating seismic wave propagation in 3D elastic media using staggered-grid finite differences,Bull. Seism. Soc. Am.,86, 1091– 1106, 1996.
Hayakawa, T., T. Furumura, and Y. Yamanaka, Simulation of strong ground motions caused by the 2004 off the Kii peninsula earthquakes, Earth Planets Space,57, this issue, 191–196, 2005.
Iwata, T., K. Asano, N. Yamada, and W. Suzuki, Long-period ground motion characteristics in Osaka basin during the 2004 Kii-Hanto-Nanto-Oki earthquake,Ann. Meeting of Seism. Soc. Japan, PK21, 2004 (in Japanese).
Japan Meteorological Agency, Monthly report on earthquake and volca-noes in Japan, December 2004, 142 pp., 2004 (in Japanese).
Kagawa, T., B. Zhao, K. Miyakoshi, and T. Akazawa, A procedure of modeling basin structure used for trong ground motion evaluation from any amount of given information—Case study for the Osaka basin, Proc. 11th Japan Earthquake Engineering Symposium, 497–500, 2002 (in Japanese).
Koketsu, K., K. Hatayama, T. Furumura, Y. Ikegami, and S. Akiyama, Damaging long-period ground motions from the 2003 Mw 8.3 Tokachi-oki, Japan, earthquake,Seism. Res. Lett.,76, 58–64, 2005.
Miyake, H. and K. Koketsu, Long-period ground motions from a large off-shore earthquake: The case of the 2004 off the Kii peninsula earthquake, Japan,Earth Planets Space,57, this issue, 203–207, 2005.
Nakamura, M., H. Watanabe, T. Konomi, S. Kimura, and K. Miura, Char-acteristics activities of subcrustal earthquakes along the outer zone of southwestern Japan,Annuals of Disas. Prev. Res. Inst., Kyoto Univ.,40 B1, 1–20, 1997 (in Japanese).
Nakanishi, A., N. Takahashi, J. Park, S. Miura, S. Kodaira, Y. Kaneda, N. Hirata, T. Iwasaki, and M. Nakamura, Crustul structure across the coseismic rupture zone of the 1944 Tonankai earthquake, the central Nankai Trough seismogenic zone, J. Geophys. Res., 107, doi:10.1029/2001JB000424, 2002.
Obana, K., S. Kodaira, Y. Kaneda, K. Mochizuki, M. Shinohara, and K. Suyehiro, Microseismicity at the seaward updip limit of the western Nanki Trough seismogenic zone, J. Geophys. Res.,108, 2459, doi: 10.1029/2002JB002370, 2003.
Yagi, Y., http://iisee.kenken.go.jp/staff/yagi/eq/Japan20040905/ Japan20040 905 1-j.html, 2004 (in Japanese).
Yamada, N. and T. Iwata, Long-period ground motion simulation in Kinki area,Annals of Disas. Prev. Res. Inst., Kyoto Univ.,47 C, 149–155, 2004.
Yamada, N. and H. Yamanaka, Comparison of performance of 3D subsur-face structural models in the southern part of the Kanto plain for strong ground motion—Examination using an earthquake (MJ M A4.1) in the
west of Kanagawa prefecture of May 22, 1999,Zisin (J. Seism. Soc. Japan),53, 313–324, 2001 (in Japanese).
Wessel, P. and W. H. F. Smith, New version of the generic mapping tools released,EOS Trans. AGU,76, 329, 1995.
Zhao, D., A. Hasegawa, and H. Kanamori, Deep structure of Japan sub-duction zone as derived from local, regional, and teleseismic events,J. Geophys. Res.,99, 22313–22329, 1994.