P R O C E E D I N G S
Open Access
Challenges and directions: an analysis of Genetic
Analysis Workshop 17 data by collapsing rare
variants within family data
Peng Lin, Michael Hamm, Sarah Hartz, Zhehao Zhang, John P Rice
*From
Genetic Analysis Workshop 17
Boston, MA, USA. 13-16 October 2010
Abstract
Recent studies suggest that the traditional case-control study design does not have sufficient power to discover rare risk variants. Two different methods—collapsing and family data—are suggested as alternatives for discovering these rare variants. Compared with common variants, rare variants have unique characteristics. In this paper, we assess the distribution of rare variants in family data. We notice that a large number of rare variants exist only in one or two families and that the association result is largely shaped by those families. Therefore we explore the possibility of integrating both the collapsing method and the family data method. This combinational approach offers a potential power boost for certain causal genes, includingVEGFA,VEGFC, SIRT1,SREBF1,PIK3R3, VLDLR,PLAT, andFLT4, and thus deserves further investigation.
Background
Genome-wide association studies have accelerated the dis-covery of genetic variants that cause disease. Thus far, nearly 600 genome-wide association studies have exam-ined about 150 distinct diseases or traits, and more than 800 single-nucleotide polymorphism (SNPs) associated with these diseases or traits have been identified [1]. Recent studies have suggested that rare variants contribute to common diseases, but the case-control study design does not have sufficient power to discover rare causal variants.
Two common approaches are used to increase the power to detect rare variants. One method is to collapse rare variants on the basis of predetermined criteria. By grouping risk variants together, the frequency of rare risk variants can be increased in the data set. Extensive research on collapsing has been done for population-based data [2]. Another approach is to examine family data. The potential advantage of family data is that a par-ticular rare variant found in an affected individual is
more common in that individual’s family than in subjects randomly sampled in the population.
Genetic Analysis Workshop 17 (GAW17) is a colla-borative effort among researchers to improve our current understanding of genetic architecture. It provides simu-lated data based on real exon sequence data and thus offers a unique and relatively realistic opportunity to evaluate statistical genetic methods that are relevant to current analytical problems. For this workshop, we designed a study to (1) test both the collapsing method and the family design in data sets generated with the same biological model and (2) assess the power of com-bining these two approaches (collapsing rare variants within family data). This study will help guide researchers to design and analyze future studies for the detection of rare genetic variants.
Methods
Family-based association testing
To test genetic associations in family data, investigators need to address the correlation among family members. Several methods are available [3-5]. We accounted for cor-related genotypes by using the modified quasi-likelihood score test (MQLS) developed by Thornton and McPeek [4]. * Correspondence: john@zork.wustl.edu
Department of Psychiatry, Washington University, 660 S. Euclid Ave., Campus Box 8134, St. Louis, MO 63110, USA
This method is implemented in the computer program MQLS.
MQLSis an improvement on the previous quasi-likeli-hood score test,WQLS, developed by Bourgain et al. [6]. It accounts for the correlations among related individuals by using a defined kinship matrix and assigns optimal weights depending on the pedigree information, thus providing an efficient estimator of allele frequency under the null hypotheses. Interested researchers should refer to Thorn-ton and McPeek’s paper for more details [4].
Collapsing rare variants within family-based association testing
A causal gene can be shared by more than one or two families, although this gene can have different rare risk variants in those families. Traditional family-based associa-tion tests fail to combine signals from different rare var-iants. To address this issue, we proposed to collapse these rare variants. Many collapsing methods are available. Some methods simply account for the presence or absence of rare variants, whereas others assign an adjustable weight to different types of rare variants, based on biological func-tion or minor allele frequency, and then calculate a final score for each gene [2]. Currently, there is no conclusive evidence to argue for or against a particular collapsing method. To generate data that can be analyzed byMQLS, we created a gene indicator that collapses rare variants within the same gene. Similar to SNPs, the gene indicator is a dichotomous variable that indicates presence or absence of any rare variant within the region of interest, so it can be processed by the MQLSprogram. A gene indi-cator variableGfor thenth subject is defined as:
Gn= AB
if any predefined rare variants exist in a particular gene, if no predefined rare variants exist in a particu
AA llar gene.
⎧ ⎨
⎩ (1)
Although genotype BB can be defined when both alleles of a particular SNP are the rare alleles, the likeli-hood of this situation is small, because we are dealing with rare variants.
We have developed a SAS macro to implement our method with the MQLS program. The SAS macro is available to interested investigators.
Power analysis
A subset of genes that had sequence data available in the 1000 Genomes Project was included in this GAW17 project. GAW17 simulated the phenotype based on a predefined simulation model and generated 200 different phenotype files under the same model. Thus the 200 replicate phenotype files provide a unique opportunity to estimate power. We tested associations under differ-ent conditions and calculated the power of differdiffer-ent approaches. Power is defined as the proportion of times that a particular test reaches the significance threshold.
Results
Distribution of rare variants within family data
The GAW17 data set has 697 subjects (209 case subjects and 488 control subjects) from 8 families. A total of 24,487 SNPs were simulated for 3,205 genes. Fully infor-mative identical-by-descent (IBD) scores were also pro-vided for each gene.
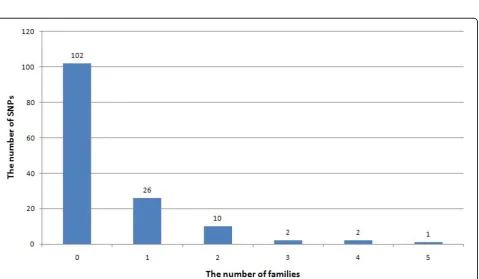
We defined a SNP as rare if its minor allele frequency (MAF) in the population was less than 0.01. By this defini-tion, in the GAW17 data there are 18,131 rare SNPs, 56.4% of which do not exist in the family data. According to the simulation model, 162 SNPs underlie the disease status. Among them, 145 are rare SNPs. Unfortunately, more than 70% of these rare SNPs do not exist in the family data. In addition, a large proportion (85%) of the remaining SNPs exist in only one or two families (Figure 1).
Moreover, many existing rare variants are not passed on in the family. Analysis of the family data shows that 30 of the 42 rare variants that exist in founders are not passed on to offspring. In fact, only 10 of the 42 rare SNPs (7% of all the causative rare SNPs) have an allele frequency (fre-quency in family data) greater than 0.01.
Family-based association test
Because 85% of the 36 rare SNPs found in families exist in only one or two families, it is expected that only one or two families can contribute to the final association result. Among the 145 rare SNPs that underlie the dis-ease status, most signals exist in only one or two families. The distribution of signals is shown in Figure 2, and it matches the distribution of rare SNPs within families well.
In addition, combining families that have a particular risk allele with families that do not have the particular risk allele unintentionally diminishes the power. We compared the association result from all families and the association result from each family. Seventy-seven percent of rare causal SNPs have more significant P-values from one family than from all data analyzed together.
Collapsing rare variants within family-based association test
As we have shown, for a particular rare risk variant, only one or two families contribute to the signal, but one gene may have multiple risk variants, each of which may be possessed by different families. Cystic fibrosis transmem-brane conductance regulator (CFTR) is a good example. SinceCFTRwas identified, more than 1,000 mutations have been found for cystic fibrosis [7]. And similar to CFTR, a causal gene may have multiple mutations, and different families may have different risk mutations within the same gene. Because these different mutations can be designated by a risk gene indicator, we believe Linet al.BMC Proceedings2011,5(Suppl 9):S30
http://www.biomedcentral.com/1753-6561/5/S9/S30
Figure 1Distribution of rare causal SNPs within families.In the GAW17 data set, 145 of 162 casual SNPs are rare variants. Of these 145 rare variants, 103 do not exist in the family data. Eighty-five percent of the existing rare variants exist in only one or two families. The number above each bar indicates the exact number of rare SNPs in this category. It partly explains why many rare variants cannot be discovered using family data.
that collapsing those different mutations to a gene indica-tor may provide an additional boost on power.
We tested collapsing within family data using the method described in the Methods section. One particular question we want to address here is whether there is any benefit to collapsing within families compared to collap-sing in population-based data, which has been extensively researched.
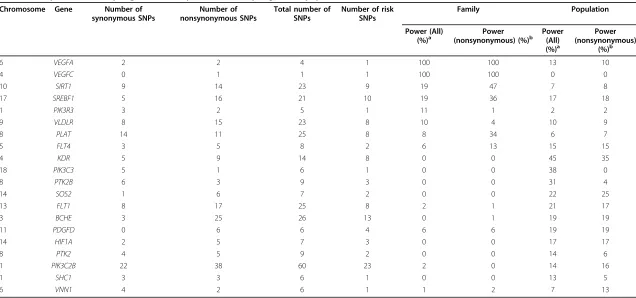
We set our significance level to a loose level ofP< 0.05 for power calculation and repeated our analysis in the 200 phenotype data sets. We collapsed all rare SNPs (MAF < 0.01) within genes. The SNP forGCKRhas a MAF greater than 0.01 and thus was excluded from analysis. Among 35 available genes, 17 reached the significance threshold. The power for these genes is shown in Table 1. For compari-son, we did similar analyses in the population data with two dummy variables to adjust for ancestry. From the table, we notice that family-based collapsing is more useful for certain genes.
Among those genes for which the family-based collap-sing has power, we set our significance threshold to the stringent level of 0.05/3,205 = 1.56 × 10⁻⁵. The power for VEGFCandVEGFAis 99% and 94.5%, respectively. Popu-lation-based collapsing, however, has no power to detect these two genes. Among the 200 phenotypes, the popula-tion-based collapsing reported a medianP-value of 0.98 forVEGFCand 0.54 forVEGFA.
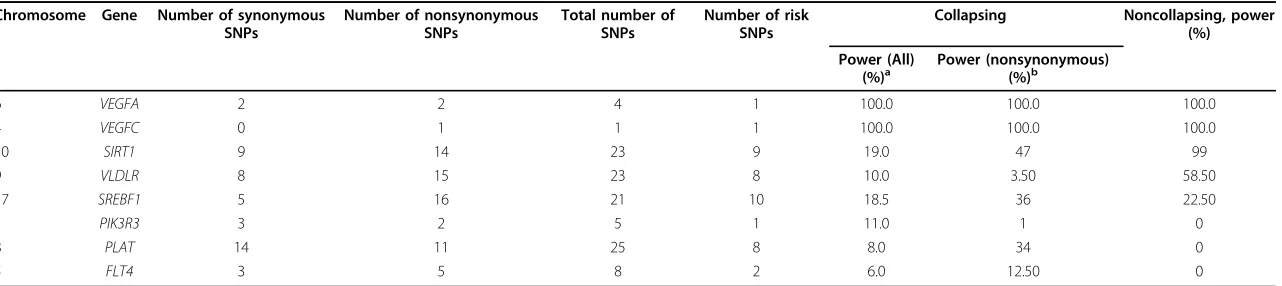
Another issue we want to address is whether there is any gain in power for collapsing within families compared to the family approach without collapsing. We tested each SNP usingMQLSwithin family data. The result is shown in Table 2. The comparison shows that collapsing may be useful for some variants and may be detrimental for some other variants. In fact, collapsing a causal variant with a noncausal variant will diminish power. We found that SIRT1andVLDLRhave a power drop, but for some other genes, such asSREBF1,PIK3R3,PLAT, andFLT4, there are considerable power gains. Further analysis shows that among those genes that have power gains by the family-based collapsing, many families that possess different risk variants have contributed to the signal.
Discussion
Recent advances in genome-wide association studies have identified hundreds of common SNPs that are associated with different diseases, but collectively they can explain only a small fraction of variation. Many investigators believe that the missing heritability may be partly explained by the rare variants, which are difficult to dis-cover in the common case-control study design. One rea-son that the existing study design does not have sufficient power is simply because these rare variants are rare. In general, for any statistical test, a certain number of sub-jects who possess this particular rare variant are required
in order to obtain enough power. From this perspective, the family design and the collapsing approach, both of which are potential methods for discovering rare variants, aim to increase the presence or the frequency of the risk variant or haplotype in the data set. However, some chal-lenges are associated with these two methods.
It is generally thought that because a rare mutation can be transmitted to offspring, family data may have more copies of rare mutations than can be found in population-based data. However, a large number of rare mutations that are possessed by founders are not passed on in the family data. Among 145 rare SNPs, only 10 have an allele frequency (frequency in family data) greater than 0.01. This may partly explain the general conclusion reached in the GAW17 meeting that family data are not particularly helpful for discovering rare risk variants.
In addition, collapsing should be used with caution. The assumption behind collapsing is that risk alleles tend to be rare. This assumption may be supported by evolution the-ory. If one new variant is generated by mutation and is beneficial, then this new variant will be favored by selec-tion and therefore its frequency will increase over time. Similarly, malicious alleles are selected against, and there-fore their frequency will decrease over time. Moreover, if a nonsynonymous mutation occurs at a conservative gene coding region, it is likely that the mutation will be mali-cious, because that is why the sequence is otherwise con-servative. However, some neutral rare variants can exist in the population as a result of random mutation. Grouping a risk variant with a neutral variant may decrease the power, as we have shown in Table 1.
In GAW17, all risk variants are nonsynonymous SNPs. In Table 1, the power is lower when collapsing all rare variants than when collapsing only nonsynonymous SNPs. It is tempting to argue that we should collapse only nonsynonymous SNPs. In reality, however, synon-ymous SNPs may play a significant role in biological function, for example, alternative splice site, transcription factor binding site, or even chromatin structure protein binding site. Meanwhile, nonsynonymous SNPs may have no function at all. At the protein level, an amino acid change, which is usually the result of nonsynonymous SNPs, often fails to change the secondary structure and tertiary structure of a protein and therefore may have no impact on protein function. Although it is generally diffi-cult to predict whether a synonymous SNP or a nonsy-nonymous SNP is biologically functional or not, we believe that the use of prediction algorithms for function will be helpful. Several function prediction algorithms are available, for example, SIFT and PolyPhen-2 [8,9]. Unfor-tunately, all causal variants in the GAW17 simulation data were chosen based on PolyPhen and SIFT predic-tions of the likelihood that the variant would be deleter-ious. Thus the application of the function prediction Linet al.BMC Proceedings2011,5(Suppl 9):S30
http://www.biomedcentral.com/1753-6561/5/S9/S30
Table 1 Comparison of collapsing within family data and collapsing within population-based data
Chromosome Gene Number of synonymous SNPs
Number of nonsynonymous SNPs
Total number of SNPs
Number of risk SNPs
Family Population
Power (All) (%)a
Power (nonsynonymous) (%)b
Power (All) (%)a
Power (nonsynonymous)
(%)b
6 VEGFA 2 2 4 1 100 100 13 10
4 VEGFC 0 1 1 1 100 100 0 0
10 SIRT1 9 14 23 9 19 47 7 8
17 SREBF1 5 16 21 10 19 36 17 18
1 PIK3R3 3 2 5 1 11 1 2 2
9 VLDLR 8 15 23 8 10 4 10 9
8 PLAT 14 11 25 8 8 34 6 7
5 FLT4 3 5 8 2 6 13 15 15
4 KDR 5 9 14 8 0 0 45 35
18 PIK3C3 5 1 6 1 0 0 38 0
8 PTK2B 6 3 9 3 0 0 31 4
14 SOS2 1 6 7 2 0 0 22 25
13 FLT1 8 17 25 8 2 1 21 17
3 BCHE 3 25 26 13 0 1 19 19
11 PDGFD 0 6 6 4 6 6 19 19
14 HIF1A 2 5 7 3 0 0 17 17
8 PTK2 4 5 9 2 0 0 14 6
1 PIK3C2B 22 38 60 23 2 0 14 16
1 SHC1 3 3 6 1 0 0 13 5
6 VNN1 4 2 6 1 1 2 7 13
Power is calculated based on the thresholdP< 0.05. Because of limited space, only those genes whose power is greater than 10% are shown. a
All rare SNPs were collapsed. b
Only nonsynonymous rare SNPs were collapsed.
Proceedings
2011,
5
(Suppl
9):S30
tral.com/1753
-6561/5/S9/S
30
Page
5
of
Table 2 Comparison of family data with collapsing and family data without collapsing
Chromosome Gene Number of synonymous SNPs
Number of nonsynonymous SNPs
Total number of SNPs
Number of risk SNPs
Collapsing Noncollapsing, power (%)
Power (All)
(%)a Power (nonsynonymous)(%)b
6 VEGFA 2 2 4 1 100.0 100.0 100.0
4 VEGFC 0 1 1 1 100.0 100.0 100.0
10 SIRT1 9 14 23 9 19.0 47 99
9 VLDLR 8 15 23 8 10.0 3.50 58.50
17 SREBF1 5 16 21 10 18.5 36 22.50
1 PIK3R3 3 2 5 1 11.0 1 0
8 PLAT 14 11 25 8 8.0 34 0
5 FLT4 3 5 8 2 6.0 12.50 0
Power is calculated based on the thresholdP< 0.05. Because of limited space, only those genes whose power is greater than 10% are shown. a
All rare SNPs were collapsed. b
Only nonsynonymous rare SNPs were collapsed.
Lin
et
al
.
BMC
Proceedings
2011,
5
(Suppl
9):S30
http://ww
w.biomedcen
tral.com/1753
-6561/5/S9/S
30
Page
6
of
algorithm to the GAW17 simulation data, which were generated using the same function prediction algorithm, may not be illuminating.
One purpose of this study is to cast new light on future study designs. We noticed that in family data, the associa-tion signals exist in only one or two families. We also noticed that combining these families with families that do not possess these risk variants unintentionally diminishes power. Therefore we argue that, given a limited sample size, a large pedigree may be more useful for discovering rare risk variants. Although many rare variants cannot be discovered, a large pedigree is still useful because at least some causal rare variants are more likely to be found.
In conjunction with association testing, linkage can identify regions of interest. Therefore regional sequencing can be done instead of whole genome sequencing. In addi-tion, the selection of the most informative families or family members may further reduce the total genotyping cost. In addition, the use of extremes of a phenotypic dis-tribution may provide tremendous information and reduce the required sample size [10].
In this study, we tested collapsing within family data, which combines the two widely proposed methods: the family design and the collapsing approach. The new com-binational method provides considerable power gain for some genes. Although we noticed that the power gain is obtained at the cost of power for some other genes, this is still useful, especially if the alternative is that nothing can be found. As we have shown in this paper, this method can be useful for discovering novel variants asso-ciated with disease, and thus it merits further study.
Conclusions
Family data are believed to be one way to increase the pre-sence of rare variants in the data set. But a large number of rare risk variants cannot be sampled in the family data. Even for existing rare risk variants, a large proportion of them are not passed on in the family. Many existing rare risk variants are seen in only one or two families, and the result from association is largely shaped by those families. To aggregate signals from different rare variants in differ-ent families, we integrated the collapsing method within the family data method. To our knowledge, this is the first attempt in the literature to do collapsing within family data. This combinational approach offers a promising power boost for certain causal genes and thus deserves further investigation.
Acknowledgments
The research is supported by U.S. Public Health Service (USPHS) grants U24MH68457 and HHSN271200477471C and by National Institutes of Health (NIH) grants T32-MH14677 and UL1RR024992. The Genetic Analysis Workshop is supported by NIH grant R01 GM031575.
This article has been published as part ofBMC ProceedingsVolume 5 Supplement 9, 2011: Genetic Analysis Workshop 17. The full contents of the
supplement are available online at http://www.biomedcentral.com/1753-6561/5?issue=S9.
Authors’contributions
PL designed the method, carried out the analysis and drafted the manuscript. MH carried out the analysis and drafted the manuscript. SH participated in the study design and drafted the manuscript. ZZ participated in performing the statistical analysis. JPR conceived of the study and participated in its design and coordination and helped to draft the manuscript. All authors read and approved the final manuscript.
Competing interests
The authors declare that there are no competing interests.
Published: 29 November 2011
References
1. Manolio TA:Genomewide association studies and assessment of the risk of disease.New Engl J Med2010,363:166-176.
2. Dering C, Pugh E, Ziegler A:Statistical analysis of rare sequence variants: an overview of collapsing methods.Genet Epidemiol2011,X(suppl X):X-X. 3. Li B, Leal SM:Methods for detecting associations with rare variants for
common diseases: application to analysis of sequence data.Am J Hum Genet2008,83:311-321.
4. Thornton T, McPeek MS:Case-control association testing with related individuals: a more powerful quasi-likelihood score test.Am J Hum Genet
2007,81:321-337.
5. Yu J, Pressoir G, Briggs WH, Vroh Bi I, Yamasaki M, Doebley JF, McMullen MD, Gaut BS, Nielsen DM, Holland JB, et al.:A unified mixed-model method for association mapping that accounts for multiple levels of relatedness.Nat Genet2006,38:203-208.
6. Bourgain C, Hoffjan S, Nicolae R, Newman D, Steiner L, Walker K, Reynolds R, Ober C, McPeek MS:Novel case-control test in a founder population identifies P-selectin as an atopy-susceptibility locus.Am J Hum Genet2003,73:612-626.
7. Doull IJ:Recent advances in cystic fibrosis.Arch Dis Child2001,85:62-66. 8. Ng PC, Henikoff S:SIFT: Predicting amino acid changes that affect
protein function.Nucleic Acids Res2003,31:3812-3814.
9. Adzhubei IA, Schmidt S, Peshkin L, Ramensky VE, Gerasimova A, Bork P, Kondrashov AS, Sunyaev SR:A method and server for predicting damaging missense mutations.Nat Meth2010,7:248-249.
10. Guey LT, Kravic J, Melander O, Burtt NP, Laramie JM, Lyssenko V, Jonsson A, Lindholm E, Tuomi T, Isomaa B,et al:Power in the phenotypic extremes: a simulation study of power in discovery and replication of rare variants.
Genet Epidemiol2011,X(suppl X):X-X. doi:10.1186/1753-6561-5-S9-S30
Cite this article as:Linet al.:Challenges and directions: an analysis of Genetic Analysis Workshop 17 data by collapsing rare variants within family data.BMC Proceedings20115(Suppl 9):S30.
Submit your next manuscript to BioMed Central and take full advantage of:
• Convenient online submission
• Thorough peer review
• No space constraints or color figure charges
• Immediate publication on acceptance
• Inclusion in PubMed, CAS, Scopus and Google Scholar
• Research which is freely available for redistribution