Shell structure, emerging collectivity, and valence p-n
interactions
R.B. Cakirli 1,2 1
Department of Physics, University of Istanbul, Istanbul, Turkey 2
Max-Planck-Institut für Kernphysik, Saupfercheckweg 1, D-69117 Heidelberg, Germany
Abstract. The structure of atomic nuclei depends on the interactions of its constituents, protons and neutrons. These interactions play a key role in the development of configuration mixing and in the onset of collectivity and deformation, in changes to the single particle energies and magic numbers, and in the microscopic origins of phase transitional behavior. Particularly important are the valence proton-neutron interactions which can be studied experimentally using double differences of binding energies extracted from high-precision mass measurements. The resulting quantities, called δVpn,
are average interaction strengths between the last two protons and the last two neutrons. Focusing on the Z=50-82, N=82-126 shells, we have considered a number of aspects of these interactions, ranging from their relation to the underlying orbits, their behaviour near close shells and throughout major shells, their relation to the onset of collectivity and deformation, and the appearance of unexpected spikes in δVpn values for a special set of
heavy nuclei with nearly equal numbers of valence protons and neutrons. We have calculated spatial overlaps between proton and neutron Nilsson orbits and compared these with the experimental results. Finally we also address the relation between masses (separation energies), changes in structure and valence nucleon number.
1 INTRODUCTION AND AVERAGE PROTON-NEUTRON INTERACTIONS
AND EMERGING COLLECTIVITY
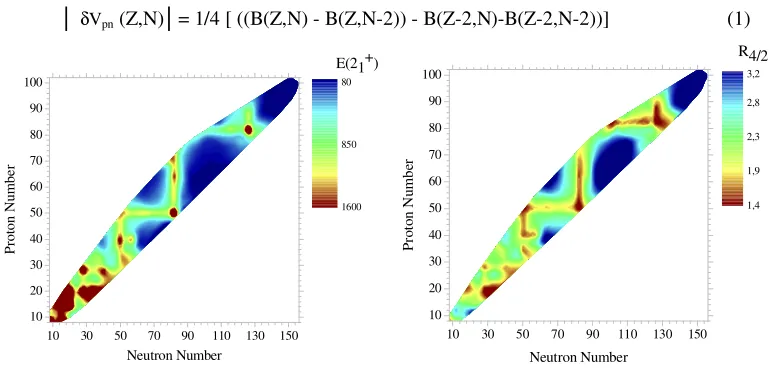
The numbers of protons and neutrons and/or valence protons and neutrons can guide us in understanding special properties about a nucleus or a nuclear region such as the onset of deformation, shape changes and so on. The importance of the number of valence particles is already embodied in concepts such as the NpNn scheme and the P-factor [1]. Concerning actual observables, in particular for even-even nuclei, we as nuclear structure physicists often first look at the energy of the first excited 2+ state E(21+), R4/2 which is a ratio of the first excited 4+ over the first excited 2+ level energies, B(E2;2+→ 0+), charge radii, masses (hence binding and separation energies), etc. To gain an idea about structure, Figure 1 illustrates experimental E(21+) (left) and R4/2 (right) values for almost the entire nuclei chart. The colors change from red around magic numbers (magicity) through blue around mid-shell (deformation). High (small) E(21+) (the R4/2 ratio) values are seen at and also close to
magic numbers. Lower E(21+) (larger R4/2) occur towards midshell as expected. In both panels in Fig.
1, this is clearly seen and the similarity in the two panels is spectacular. One of the most important challenges relating to Fig. 1 is whether this remarkable pattern will continue for nuclei far from
DOI: 10.1051/
C
Owned by the authors, published by EDP Sciences, 2014
/201
stability. For this, future experiments, in particular in the new facilities such as FAIR, FRIB, RIKEN, are needed.
Masses reflect all the nucleonic interactions and thus play a special role as an observable. However, the mass itself does not easily give information on nuclei directly due to its scale (~1 GeV per nucleon). Thus, one works with differences of binding energies (or masses), separation energies. One can then easily see, in particular, shell effects at the magic numbers, or the onset of deformation, for example in the N~90 region. In addition to differences of binding energies for separation energies, a specific double difference of binding energies offers a special filter for proton (p) - neutron (n) interactions between the last two protons and the last two neutrons [2-5]. The p-n interaction is important because it helps to understand, for example, magic numbers, deformation, single particle energies, collectivity, and the development of configuration mixing. There are many studies in the literature on the p-n interaction [6]. In this Proceedings, we will only talk about average valence p-n interactions, called δV
pn, between Z th
and (Z-1)th protons with Nth and (N-1)th neutrons. Equation (1) shows this special filter for p-n interactions using binding energies, B, for even-even nuclei.
│ δVpn (Z,N)│= 1/4 [ ((B(Z,N) - B(Z,N-2)) - B(Z-2,N)-B(Z-2,N-2))] (1)
10 30 50 70 90 110 130 150 10
20 30 40 50 60 70 80 90 100
P
ro
to
n
N
u
m
b
e
r
Neutron Number
80
850
1600
E(21+)
10 30 50 70 90 110 130 150 10
20 30 40 50 60 70 80 90 100
P
ro
to
n
N
u
m
b
er
Neutron Number
1,4 1,9 2,3 2,8 3,2
R4/2
Figure 1. Color coded experimental E(21+) (Left) and R4/2 (Right) values versus neutron number.
Figure 2 (Left) reveals experimental δVpn values around the 208Pb region [3,5]. Since the nuclei
presented in Fig. 2 are close to magic numbers, our simple interpretation here is based on Shell Model orbits, nlj. In the Shell Model, except for the unique parity orbits, each shell begins with high j-low n and ends with low j-high n (see Fig. 2 (Right)). If protons and neutrons fill similar orbits (nlj), the expected overlap between p and n wave functions will be large. The easiest example is a doubly magic nucleus 208Pb in which both protons and neutrons are just below the magic numbers Z=82 and N=126, respectively. Thus the last two protons and the last two neutrons occupy similar orbits (low j-high n), so we observe a large δVpn as expected. As soon as two additional neutrons are added to 208Pb (210Pb),
these two neutrons will cross the N=126 magic number and fill the beginning of the next shell although protons are still at the end of the 50-82 shell. For this case, the valence protons and neutrons in 210Pb will have dissimilar nlj so we see a sudden drop in δVpn at N=128 for Pb [5]. A similar analysis can be done for other nuclei close to magic numbers, but this simple interpretation does not work for deformed nuclei because the orbits occupied by protons and neutrons are complex admixtures of Shell Model configurations. Another facet about the interpretation of δVpn is that some
106 116 126 136
0 150 300 450
δ
V
pn
(
k
eV
)
Rn Ra
Th
U Po
Hg Pb Os
Pt
Neutron Number
Figure 2. (Left) Experimental δVpn values versus neutron number for the 208
Pb region. (Right) A toy scheme considering the Shell Model orbits to reveal how j and n change within a shell and the expected relation to δVpn
values. Based on Refs. [3,5].
84 90 96 102 108 114 120 126
52 56 60 64 68 72 76 80
84 90 96 102 108 114 120 126
52 56 60 64 68 72 76 80
P
ro
to
n
N
u
m
b
er
Neutron Number 250
300 350 δV
pn (keV)
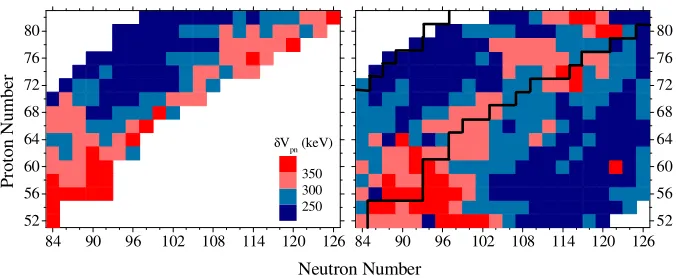
Figure 3. Color coded δVpn values for both experiment (Left) and DFT (Right). Black zig-zag lines are the
boundary of experimentally known δVpn. Based on Ref. [5].
Experimental and calculated δVpn values, using nuclear density functional theory (DFT), for
even-even nuclei in the Z=50-82, N=82-126 shells are presented in Fig. 3. Red and pink colors refer to large
δVpn values and dark and light blue are for low δVpn values. The DFT results clearly have very good
agreement with the experimental results. In general, the largest δVpn values are in the particle-particle
(pp) region in both theory and data and the smallest δVpns are hole-particle (hp). The largest δVpns are located around the diagonal from Z=52, N=84 to Z=82, N=126. Recent Xe mass measurements [7] at CERN-ISOLTRAP provided the first empirical δVpn values for Ba at N=90 and 92. The DFT results
for these recent δV
pn values compare very well with these new data. Calculated δVpn values are also shown for all the nuclei within the expected driplines) in the Z=50-82, N=82-126 shells. Since there is no data in the lower right quadrant (ph), we cannot judge the theory there but clearly this and the right hand side of the (pp) quadrant are prime testing grounds for future exotic beam mass measurements. Thus, some projects are in progress for future mass measurements.
Figures 2 and 3 show heavy nuclei which occupy the large shells (see Fig. 2 (right)) typical of heavy nuclei. In contrast to heavy nuclei, light nuclei fill smaller shells and therefore collective effects appear/disappear quickly so changes in structure occur faster than in heavy nuclei. In addition, light nuclei have cases of nuclei with Z=N. In terms of δVpn, nuclei with equal numbers of proton and
neutron fill the same orbits so maximal spatial-spin overlap of proton and neutron wave functions is expected. Not surprisingly Z=N nuclei exhibit large singularities in δV [8] which have been linked
High j, low n Low j, high n
π
ν
82
50 82
126
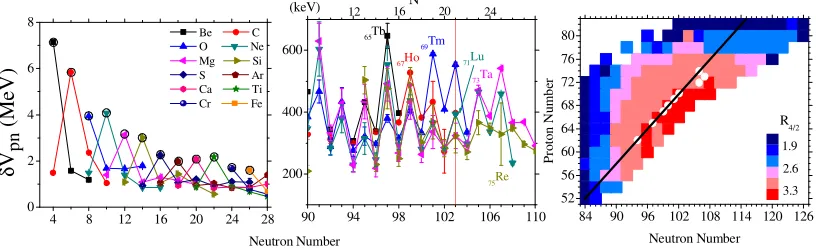
function of neutron number for light nuclei with sharp peaks at Z=N. This clear trend (see the scale) is not expected in heavy nuclei because of the Coulomb force and the spin-orbit force which brings unique parity orbits into each shell. However, for heavy nuclei, we have found that δVpn values also
have sharp peaks, and that they occur when a nucleus has approximately the same number of valence
(val) protons and neutrons [11,12]. Figure 4 (Middle) introduces our point for odd-Z with both even and odd-N nuclei (see also Fig. 3 of Ref. [11] where δVpn in even-even nuclei also show peaks for
Zval~ Nval but the peaks are suppressed and smoother due to pairing effects). The top axis in the middle panel gives the number of valence neutrons. For example, we see a peak in δVpn at N=95 (Nval=15) for
65Tb (Zval=15). Similar examples are seen for Ho and so on. The right panel of Fig. 4 shows the locus of the maximum δVpn values (white circles) on an Z-N contour plot for R4/2 in which structure changes from spherical (blue) through deformed, ellipsoidal shapes (red). The black line is placed to indicate Zval=Nval. As seen in this plot, the nuclei for which we have peaks in the experimental δVpn values, lie where the saturation of collectivity starts so these maxima in δV
pn have a clear link to the evolution of collectivity.
4 8 12 16 20 24 28
0 2 4 6 8 δ Vp n ( M eV ) Neutron Number Be C
O Ne Mg Si S Ar Ca Ti Cr Fe
84 90 96 102 108 114 120 126
52 56 60 64 68 72 76 80 1,9 2,6 3,3 3.3 2.6 P ro to n N u m b er Neutron Number R 4/2 1.9
90 94 98 102 106 110
200 400 600 75Re 73Ta 71Lu 69Tm 67Ho 65Tb
12 16N 20 24
val
(keV)
Figure 4. Experimental δVpn values for light nuclei (Left) and heavy nuclei (Middle). (Right): Color coded R4/2
values. White circles are shown for the nuclei for which there is a maximum in δVpn in the Middle panel. Based
on Refs. [12,13].
One of the most interesting points about these results is that these deformed nuclei where we have peaks at Zval=Nval or Zval=Nval ± 1 usually have a very specific relation between the last filled proton and neutron Nilsson orbits, namely that their quantum numbers are related by δK[δN, δnz, δΛ]
=0[110] (for even-even nuclei, the best example is 168Er which has 7/2[523] (K[N,nz,Λ]) p Nilsson orbit and 7/2[633] n Nilsson orbit with Zval=Nval=18). Is this maximum in δVpn with 0[110] where the saturation of collectivity starts accidental? In order to understand these interactions in a simple way, we calculated [12] spatial overlaps of proton and neutron Nilsson wave functions with three deformations, namely 0.05, 0.22, 0.3. The details of these calculations are given (and updated) elsewhere [13,14]. Here we focus on the interpretation and results.
Figure 5. Nilsson diagrams for the proton Z= 50-82 and neutron N= 82-126 shells (see text for details). Based on Refs. [12,13].
84 90 96 102 108 114 120 126
52 56 60 64 68 72 76 80
84 90 96 102 108 114 120 126
Neutron Number
Overlap
0,71 0,81 0,91
0.71 0.81 0.91
84 90 96 102 108 114 120 126
52 56 60 64 68 72 76 80
Experimental
δVpn (keV)
Nval=Zval
P
ro
to
n
N
u
m
b
er
225 288 350
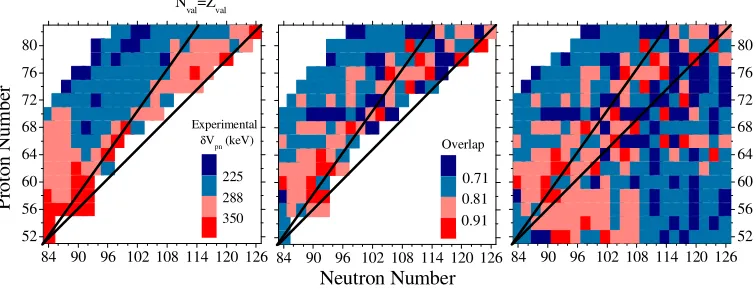
Figure 6. (Left): Color coded empirical δVpn values for the Z= 50-82 and N= 82-126 shells. Large values have
redder colors. (Middle): Similar as (Left) but for calculated overlaps for nuclei where empirical values ofδVpn are
known. (Right): Calculated overlaps for the full major shells (excluding the nuclei beyond the proton dripline at far upper left). (see text for details). Based on Ref. [13].
The calculated overlaps are compared with the experimental δVpn results in Fig. 6. A diagonal line is placed to show where the neutron and proton orbits fill similar fractions of their respective shells. One can fill 32 nucleons into the proton shell and 44 nucleons into the neutron shell. Thus, the figures are designed as square so that, that along the diagonal line similar orbits will be filled so large overlaps (large δVpn) are expected along this line (see explanation above nlj) [4]. The upper black line is placed to show the Zval=Nval nuclei. Overall agreement between the data and theory is very good. As mentioned in the DFT results above, the largest δVpn values are in the pp region and large overlaps
2 RELATION BETWEEN S
2NAND E(2
1+) VALUES USING RECENT
SCHOTTKY MASS MEASUREMENTS
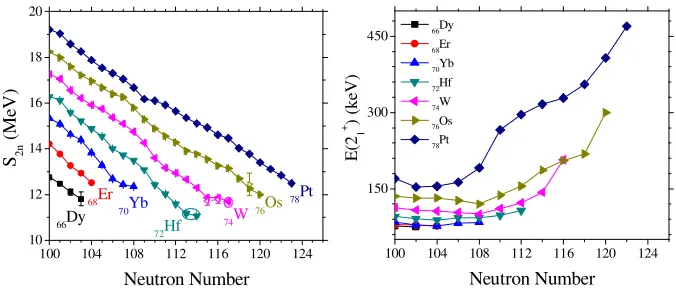
Masses of 181,183Lu, 185,186Hf, 187,188Ta, 191W, and 192,193Re nuclei were measured [14] for the first time using Storage-ring mass spectrometry with neutron-rich 197Au projectile fragments. With the new masses, two-neutron separation energies, S2n, were investigated. Figure 7 (Left) shows a region where the first S2n values using the new masses at Hf with N=113, 114 and W with N=117 are covered with a circle/elipsoid and where the open symbols for S2n in W at N=115 and 116 and Os at N=119 are from the previous literature. In Ref. [14], we improved the previous results. Figure 7 (Right) shows experimental E(21+) values as a function of neutron number. Using these two useful observables, we have identified a link between observed irregularities in the smooth two-neutron separation energies for Hf and W isotopes and changes in collectivity in the corresponding nuclei [14].
100 104 108 112 116 120 124
150 300 450
E
(21
+ )
(k
eV
)
Neutron Number 66Dy
68Er 70Yb 72Hf 74W 76Os 78Pt
100 104 108 112 116 120 124
10 12 14 16 18 20
78Pt 76Os 74W 72Hf
70Yb
68Er
S2n
(
M
eV
)
Neutron Number
66Dy
Figure 7. Experimental two neutron separation energies (Left) and the first excited 2+ energies (Right) as a function of neutron number. Based on Ref. [14].
There is a clear flattening in S2n for W which starts at N=116 and E(21+) at N=116 has a jump. For Pt, from N=108 to 110, we see a similar result as in W. It looks like there is a turning point as a structural change. However, in Os from N=118 to 120, there is a smooth decrease in S2n although there is a visible increase in E(21+). The Pt isotopes around N=120 are the same. Our interpretation here is based on the number of valence nucleons for these nuclei. Figure 8 is helpful to explain our interpretation. It shows a symmetry triangle with a color code in binding energy from the IBA-1 [15]. The three corners show three dynamical symmetries and the triangles are presented for boson numbers of 5 and 16 (valence nucleon numbers 10 and 32). The color code scale is the same for both triangles and the triangles show changes from left to right from small binding energy (yellow) to large (red). What is seen in Fig. 8 is that when we have larger boson numbers, larger binding comes into the triangle. That is, binding energy increases rapidly with valence nucleon number because binding energy depends roughly on the number of valence nucleons squared. In addition, the binding decreases from deformed (axially deformed, SU(3)) to vibrational (U(5)).
Figure 8. The symmetry triangle of the IBA showing the three dynamical symmetries at the vertices. The colors indicate calculated collective contributions in MeV to binding energies for NB = 5 (Left) and NB = 16 (Right).
Based on Refs. [14, 16].
3 CONCLUSION
The average valence proton-neutron interactions, δV
pn, which can be studied experimentally using double differences of binding energies extracted from high-precision mass measurements, are discussed from both experimental and theoretical perspectives by focusing on the Z=50-82, N=82-126 shells. We noted the correlation between large δVpn values and the growth of collectivity and the
unique behaviour of δVpn when crossing magic numbers. Reflecting the clear spikes in δVpn for light nuclei, studies of δVpn for heavy nuclei are discussed in terms of the number of valence nucleons. We obtained a systematic behavior (maxima in δVpn) when a nucleus has equal (or almost equal) numbers
of valence protons and neutrons and noticed a consistent difference between proton and neutron Nilsson orbit quantum numbers, namely 0[110]. Calculated spatial overlaps between proton and neutron Nilsson orbits are presented and compared these with the experimental results. Finally, we also discussed the relation between masses (separation energies) and E(21+) by taking into account the number of valence nucleons.
4 ACKNOWLEDGMENTS
We are grateful to R. F. Casten, K. Blaum, D. Bonatsos, Y. Litvinov and D. Shubina for very useful discussions. This work was supported by the Humboldt Fellowship for R.B.C., by the Max-Planck Society and by the Istanbul University Scientific Research Projects, Numbers. 33027, 26433 and 21658.
References
1. R.F. Casten, D.S. Brenner and P.E. Haustein, Phys. Rev. Lett. 58, 658 (1987).
2. J.D.Garrett and J.-Y.Zhang, Cocoyoc, 1988, Book of Abtsracts ; J.-Y. Zhang, R. F. Casten, and D. S. Brenner, Phys. Lett. B 227, 1 (1989)
3. R. B. Cakirli, D. S. Brenner, R. F. Casten, and E. A. Millman, Phys. Rev. Lett. 94, 092501 (2005); 95, 119903(E) (2005)
4. M. Stoitsov, R. B. Cakirli, R. F. Casten, W. Nazarewicz, and W. Satula, Phys.Rev.Lett. 98 , 132502 (2007).
5. L. Chen et al., Phys.Rev.Lett. 102, 122503 (2009)
Janssens et al., Phys. Lett. B 546, 55 (2002), J. Dobaczewski et al., Phys. Rev. Lett. 60, 2254 (1988), M. V. Stoitsov, J. Dobaczewski, W. Nazarewicz, and P. Borycki, Int. J. Mass Spectrom.
251, 243 (2006)
7. D. Neidherr et al., Phys. Rev. C 80, 044323 (2009).
8. P. Van Isacker, D.D. Warner and D.S. Brenner, Phys. Rev. Lett. 74, 4607 (1995).
9. D.S. Brenner, C. Wesselborg, R.F. Casten, D.D. Warner and J.-Y. Zhang, Phys. Lett. 243 B, 1 (1990).
10. E. P. Wigner, Phys. Rev. 51, 106 (1937).
11. R.B. Cakirli, K. Blaum, R.F. Casten, Phys. Rev. C 82, 061304 (R) (2010)
12. D. Bonatsos, S. Karampagia, R.B. Cakirli, R.F. Casten, K. Blaum, L. Amon Susam, in preparation
13. D. Bonatsos (private communication) 14. D. Shubina et al. (Phy. Rev. C, in press)
15. F. Iachello and A. Arima, The Interacting Boson Model (Cambridge University Press, Cambridge, 1987).