Article
The Influence of Canopy Cover on the Ecological
Function of a Key Autogenic Ecosystem Engineer
Jacqueline B. Pocklington 1,2, *, Michael J. Keough 2, Tim D. O’Hara 1 and Alecia Bellgrove 31 Department of Marine Invertebrates, Museum Victoria, Carlton VIC Australia 3053 2 School of BioSciences, University of Melbourne, Parkville, VIC Australia 3010
3 Deakin University, School of Life and Environmental Sciences, Centre for Integrative Ecology, Warrnambool Campus, PO Box 423, Warrnambool, Victoria 3280, Australia
* Correspondence: [email protected]
Abstract: Intertidal fucoid algae can function as ecosystem engineers across temperate marine regions. In this investigation we assess the function of the alga dominating rocky reefs in temperate Australia and New Zealand, Hormosira banksii. Invertebrate and algal species assemblages were examined within areas of full H. banksii canopy, areas where it was naturally patchy or absent (within its potential range on the shore) and areas where the intact canopy was experimentally disturbed. Differences in species assemblages were detected between areas with natural variation in H. banksii cover (full, patchy, negligible), with defined species associated with areas of full cover. Differences were also detected between experimentally manipulated and naturally patchy areas of canopy cover. Species assemblages altered in response to canopy manipulations, and did not recover even twelve months after initial sampling. Both light intensity and temperature were buffered by full canopies compared to patchy canopies and exposed rock. This study allows us to predict the consequences to the intertidal community due to the loss of canopy cover, which may result from a range of disturbances such as trampling, storm damage, sand burial and prolonged exposure to extreme temperature, and further allow for improved management of this key autogenic ecosystem engineer.
Keywords: Macroalgae, Facilitation; Disturbance, Invertebrates, Intertidal reef.
1. Introduction
Canopy-forming seaweeds can function as autogenic ecosystem engineers on rocky seashores, providing a suitable habitat for species that would otherwise be excluded or only occur in low abundance [1-15]. Many studies referring to species as autogenic ecosystem engineers [16, 17] (or similar theoretical terms such as dominant species [18], facilitators, habitat-forming species [9] and biogenic habitat) have investigated the associated loss of species when this one species is lost through a major disturbance. What hasn’t been examined in full is whether the fucoid intertidal alga Hormosira banksii, functions as an ecosystem engineer under varying densities in the absence of disturbance. Is it dependent on spatial dominance, or can it function as part of a mosaic of habitat density and type? Here we demonstrate through both mensurative and manipulative experiments, how H. banksii functions as an autogenic ecosystem engineer, and how its ability to modify conditions, and thus habitat provision, differs under varying canopy cover. We also show that manipulative experiments alone cannot demonstrate that H. banksii is a autogenic ecosystem engineer [defined as changing the environment via its physical structure, 3] and habitat provider on Victorian rocky shores.
Throughout its range, the fucoid Hormosira banksii is the dominant canopy-forming species on intertidal rocky shores, and unlike studies of fucoids in the northern hemisphere, it has no functional equivalent or ecological successor [2, 5, 6, 9, 12, 19-29], likely due in part to its specialised ability to cope with harsh environmental conditions associated with Austral summers during tidal emersion [30]. Few studies examining the response of H. banksii understorey communities to disturbance have investigated the response of more than a few species or components (e.g. functional groups) of the
system [9, 12, 17, 25, 31]. These studies highlight the potential for H. banksii to be categorised as an autogenic ecosystem engineer, though none have yet examined whether H. banksii also shows this function under naturally reduced densities.
Disturbance studies have shown that damage to H. banksii through trampling or experimental removal causes a decline in the abundance of species usually associated with the canopy [2, 5, 6, 9, 12]. H. banksii canopy-removal experiments in New Zealand [9, 27] found that temperature was lower within the canopy in comparison to areas where it was removed and this was most apparent during the summer months when surface temperatures in removal plots were at least 5°C higher than in control plots [9]. Lilley and Schiel [9] found that understorey algae declined in abundance, and an influx of ephemeral algae occurred (e.g. Ulva spp., Colpomenia sinuosa). The abundance of invertebrates also changed where some species declined in abundance (e.g. Micrelenchus tesselatus,as Cantharidella tesselata) and some increased (e.g. Notoacmea spp.). Trampling experiments in south-eastern Australia have shown that bare rock habitat and its associated fauna weren’t detrimentally impacted by trampling, yet H. banksii was damaged even at low trampling intensities with a lack of recovery even after 400 days in heavy trampling treatments [2]. Invertebrates common to bare areas were found to colonise the heavily damaged areas of H. banksii indicating the possibility of a shift in the community from trampling [2]. In contrast, King [21] found that variable responses to trampling and suggested that seasonal changes potentially obscure the impacts of trampling disturbance. Although both of these trampling studies found low power was a problem in testing the responses of individual species to trampling disturbance [2, 21], they did however show that different species assemblages occupy different parts of the shore, and that high variability is indicative of complexity beyond simple facilitative relationships.
The ecological function of H. banksii may vary in space and time and given the results of disturbance studies [2, 5, 6, 9, 12], the magnitude of its habitat provision could depend on its physical structure or canopy ‘cover’. Previous studies however have not examined the species relationships that occur with naturally reduced ‘patchy’ canopies. Here we examine whether the ability of H. banksii to modulate the understorey environment (e.g. light, temperature, desiccation stress) for associated species [3] varies in relation to canopy cover which is naturally variable on Victorian rocky shores. This study investigated the relationship between H. banksii and co-occurring species using mensurative surveys examining natural patterns and experimental manipulations at multiple sites, to determine whether the amount of canopy cover influences the autogenic ecosystem engineering function of H. banksii on Victorian rocky shores.
2. Materials and Methods 2.1 Study Sites
All sites were moderately wave-exposed sites facing Bass Strait [32]. On Victorian shores (south-eastern Australia), areas within the vertical range of H. banksii can be separated into: full beds (cover above 90%), patchy areas (cover between 20% and 90% interspersed with ‘bare’ rock (devoid of observable biota), sand or alternate biota such as mussels or turfing algae), and areas where it is rare or absent (<19%). All the study reefs were flat calcarenite reef platforms with a mixture of habitat types including extensive Hormosira banksii beds and sections of platform without canopy, comprising turf-forming algae, mussels and ‘bare’ rock (hereafter referred to as ‘negligible’).
Although substratum temperatures often exceed 30C during low tide in the summer months, the study species Hormosira banksii has a high tolerance to desiccation due to its unique fluid-filled beaded morphology and the presence of UV filters (physodes) in the cell walls [30]; thus H. banksii is the only fucoid capable of forming a canopy in the intertidal of mainland temperate Australia. The Victorian coastline has a low tidal range [below 2 m, 33]; all sites were sampled when tides were predicted to be below 0.4m above mean low water (MLW).
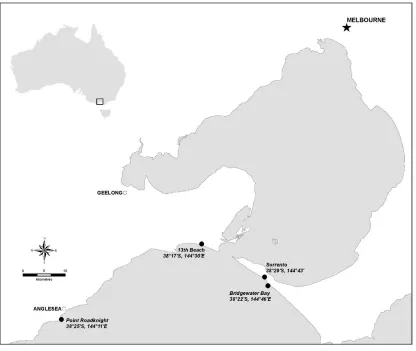
3 of 31 Victoria, Australia are both backed by steep headlands (Figure 1). Bridgewater Bay is a narrower platform (30 m) than 13th Beach (60 m) though both extend for hundreds of metres along the shoreline.
Background Survey Sites: Sorrento Back Beach, Mornington Peninsula, Victoria, Australia [see control area in 29] and Point Roadknight, Anglesea, Victoria, Australia are both very large platforms hundreds of meters long, and approximately 100-m wide (Figure 1). Sorrento Back Beach runs parallel along the coastline, whereas Point Roadknight forms a southerly point.
Figure 1. Map showing study sites (black filled circles) including latitudes and longitudes. Bridgewater Bay and 13th Beach are experiment sites, Sorrento and Point Roadknight are
background sites. All sites on the coast of the Southern Ocean, Bass Strait is directly south (not shown).
2.2 Investigation of species associations with natural variations in canopy cover of Hormosira banksii
To determine the species assemblages associated with the H. banksii canopy, sampling was undertaken at the two background sites and two experimental sites prior to experimental manipulation (see experimental investigation) using haphazardly placed quadrats (0.09m2) within
the area of H. banksii distribution on the platform. Sampling occurred within three distinguished habitat types: Negligible (<5 %), Patchy (40-60 % configured as multiple large clumps separated by ‘bare’ rock without H. banksii), and Full (> 90%) areas of H. banksii canopy. In each habitat, replicate quadrats (0.09 m2) were quantitatively sampled for percentage cover (using 49-point intercepts) of all
‘primary’) and the layer below the canopy (referred to throughout as ‘understorey’). In negligible and removed plots where there is no canopy the ‘understorey’ is equivalent to the primary cover and where described as understorey it is presented to serve comparison. Organisms were identified to the lowest taxonomic level possible. Depth of sand over rock was measured within quadrats at 3 random points to the nearest 2.5 mm. Length of the longest H. banksii fronds were recorded within quadrats from 3 randomly selected fronds to the nearest 2.5 mm. Sampling was undertaken during two visits per site to account for temporal variability in species abundances [Point Roadknight: January and December 2007 (summer); Sorrento: May and December 2007 (autumn and summer respectively)].
2.3 Experimental investigation of the effect of variations in canopy cover of Hormosira banksii on the physical environment and associated species assemblages
To examine whether algal and macroinvertebrate communities are influenced by the presence of full, patchy or absent canopies; an experiment was carried out at two intertidal rock platforms (13th
Beach and Bridgewater Bay). Twenty-five fixed 0.25 m2 plots were established haphazardly across a
reef area approximately 10,000 m2 within three categories of canopy cover and marked with labelled
cattle tags fixed with stainless steel screws. Five plots were in areas where H. banskii was naturally absent (0-5 %), 5 in areas where H. banksii with naturally patchy cover (40-60 %) and 15 were established in areas with full canopies (>95 %, full control plots); later 10 full plots (5 replicates each) were randomly assigned to the experimental manipulations: thinned (40-60 %) and removed (0-5 %). Hormosira banksii cover was reduced by trimming the algal fronds in the experimental plots just above the holdfast using garden secateurs [to prevent long term disturbance by allowing regrowth from holdfasts, Underwood 24]. Any fronds that could overlay the plots from the outside edge were also trimmed. Furthermore, any regrowth above 5 mm was retrimmed as necessary creating a press disturbance (recovery was not a question of interest). Sampling of plots was undertaken as for the background sites using 0.09 m2 gridded quadrats placed in the centre of each plot. Taxa were
identified to species in situ where possible (see Appendix A for full species list). Depth of sand to rock was measured within quadrats at 3 random points to the nearest 2.5 mm. The longest frond of each of 3 randomly chosen H. banksii plants was measured in each quadrat. To examine whether H. banksii modifies the physical environment to the understorey; temperature was recorded on the substratum of each plot using a waterproof thermometer to one decimal place, and relative light intensity on the substratum was recorded using a custom-built meter (JR Pocklington) including a light sensitive diode connected to a standard electrical meter, which measured the degree of shading. Temperature and light readings were taken beneath the canopy within plots (as they were being sampled for species assemblage). All measurements and surveys for all plots were conducted during on low tide, at each sampling time. Sampling intervals roughly followed a logarithmic time series; at 13th Beach:
1, 5, 15, and 379 days after manipulation (23/2/2007, 27/2/2007, 9/3/2007, 13/3/2008; time n = 4); at Bridgewater Bay: 1, 15, 19, and 371 days after manipulation (23/3/2007, 27/3/2007, 10/4/2007, 28/3/2008; time n = 4). The experiment start dates and sampling intervals differed slightly between sites on two occasions due to logistical difficulties. Long intervals across the winter period were due to low tide predictions being too high to expose the H. banksii zone, or only occurring during the night when species assemblages may differ from day records and accurate sampling couldn’t be guaranteed.
2.4 Data analysis
5 of 31 were examined to confirm goodness of fit. Two-factor permutational multivariate analyses of variance (PERMANOVAs) were performed on fourth-root transformed data with 999 permutations for both natural (baseline) and manipulated covers, examining primary cover, understorey cover and mobile invertebrate assemblages separately. For comparisons of assemblages associated with different natural levels of Hormosira cover prior to manipulation, treatments (3 levels: full, patchy, negligible; fixed) and sites (4 levels: 13th Beach, Bridgewater Bay, Point Roadknight, Sorrento; random)
were compared by PERMANOVA, but because logistical constraints prevented starting experiments and sampling all sites at the same times, any temporal differences in assemblages is incorporated into the unexplained residual variation in analyses. To examine the influence of experimental manipulation of Hormosira canopy cover on associated assemblages, treatments (5 levels: full, patchy, negligible, thinned, removed; fixed) and sites (2 levels: 13th Beach, Bridgewater Bay; random) were
compared by PERMANOVA at each of days 1, 5, 15/19, and 371/379 since experimental manipulation. Tests for homogeneity of dispersions within treatment groups were performed using PERMDISP [36] with distance to centroids. When the treatment x site interaction was significant another PERMANOVA was run on the interaction term comparing treatments individually by site. In these cases, the P-value based on Monte Carlo random draws, P(MC) was selected as it is more robust with the reduced number of possible permutations in pairwise tests [36]. Similarity Percentages (SIMPER) was used to assess the contributions (> 10 %) of individual taxa/cover-groups to the separation of treatments. Repeated measures Analyses of Variance (rmANOVA) was then used to determine the differences in abundances of individual taxa/cover-groups identified by SIMPER amongst treatments and between sites over time (at days 1, 5, 15/19, and 371/379 since experimental manipulation). The physical factors of temperature and light intensity; and the covariates sand depth and Hormosira frond length were also analysed using rmANOVA amongst treatments and between sites over time. All univariate analyses were conducted using SYSTAT version 10 and α = 0.05 for all statistical analyses. Assumptions of rmANOVA were assessed by examination of probability and residual plots; the abundance of individual mobile invertebrates were square root transformed, otherwise no data transformations were necessary.
3. Results
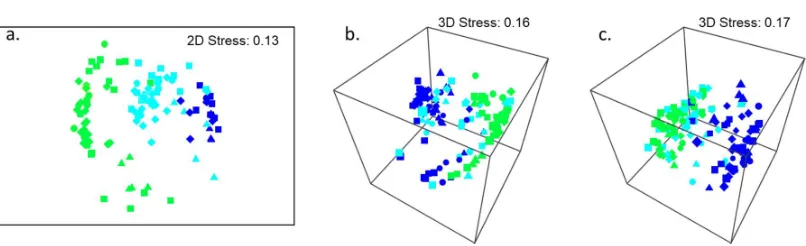
Figure 2. Non-metric multidimensional scaling (nMDS) plots of a) primary cover, b) understorey cover and c) mobile invertebrates assemblages associated with different natural levels of Hormosira cover prior to manipulation (full cover = dark blue, patchy cover = aqua, negligible cover = green) at each of four sites (13th Beach = triangles, Bridgewater Bay = circles, Point Roadknight = squares, Sorrento = diamonds). All data were fourth-root transformed. 3D nMDS plots are shown where stress exceeded 0.20 for 2D plots.
7 of 31
Figure 3. a) Average ± SE densities of mobile invertebrates (per 0.09 m2 quadrat) amongst natural
Hormosira cover treatments for each of 4 sites: a) Chlorodiloma adelaidae, b) Lunella undulata, c) Cominella
lineolata, d) Dicathais orbita, e) Bembicium nanum, f) Limpets (Siphonaria spp, Cellana tramoserica,
Patelloida spp combined). N = 5 for all treatments at 13th Beach and Bridgewater Bay and N = 10 for
Point Roadknight and Sorrento.
3.2 Experimental investigation of the effect of variations in canopy cover of Hormosira banksii on the physical environment and associated species assemblages
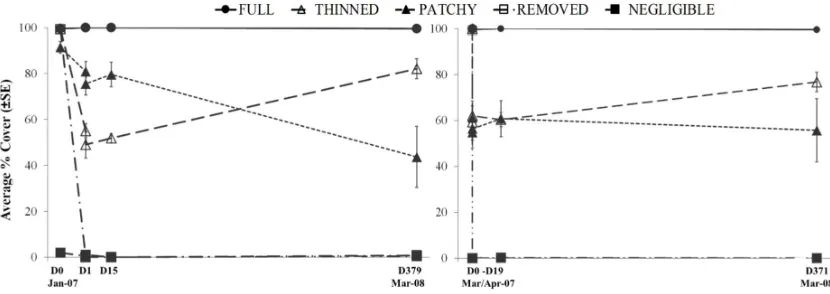
Canopy cover of Hormosira banksii remained within the parameters of the experimental treatments and controls over the course of the experiment (Table 1, Figure ). However, after experimental manipulation of the Hormosira canopy cover, the differences in both understorey cover and mobile invertebrates assemblages associated with canopy-cover treatments were not consistent amongst sites for any time point (PERMANOVA treatment × site interactions; P(perm) < 0.05 for all analyses). In several cases differences between treatments were, at least in part, due to differences in dispersion amongst treatment groups at various time points for both understorey cover (PERMDISP by treatments P(perm) < 0.005 for days 5, 15/19 and 371/379 post manipulation) and mobile invertebrate assemblages (PERMDISP by treatments P(perm) < 0.03 for days 5 and 371/379 post manipulation; Figure , Figure 6).
One day after canopy manipulations, the understorey cover assemblages were significantly different from each other for all pairwise treatment comparisons except for naturally full, patchy and experimentally thinned treatments at 13th Beach, and the plots with the experimentally removed
Hormosira canopy at Bridgewater Bay did not significantly differ from either the patchy or thinned plots (Table 2a, Figure a). By the end of the experiment at 13th Beach (Day 379), significant differences
cover components to all other treatments (Error! Reference source not found., Figure ). Overall the understorey components that contributed most to the separation of treatment groups (as identified by SIMPER, Appendix B) at the end of the experiment were the cover of the turfing C. implexa and small mussel X. pulex (individually and in association with each other as an intertwined complex), the amount of sand covering the substratum and bare rock devoid of visible biota (Error! Reference source not found.).
The abundance of turfing alga Capreolia implexa and small mussel Xenostrobus pulex (combined in analysis due to commonly occurrence as an intertwined complex) showed a consistent pattern throughout the experiment (Error! Reference source not found., Error! Reference source not found.). Both species were consistently most abundant in the negligible plots (75 % at 13th Beach and ~55 % at
Bridgewater Bay, Table 1, Figure 7), at ~ 20% cover in patchy plots and either absent or <3 % cover in all other treatments at both sites (Table 1, Figure 7). Sand cover varied between treatments and sites throughout time, with higher abundance found in full plots when differences occurred (Table 1, Figure 7). Sand depth didn’t correspond with cover and on many occasions deeper sand was recorded in plots with lower overall cover of sand (Table 1 and Appendix D). Deeper sand (0.8-0.4 cm 13th
Beach, 1-0.3 cm Bridgewater Bay) was most frequently recorded in full and patchy treatments (Table 1 and Appendix D). Bare rock cover varied through time, between treatments and sites (Table 1, Figure 7). Removed treatments had the most consistent cover of bare rock throughout the experiment (~30 % 13th Beach, ~ 60 % Bridgewater Bay).
9 of 31
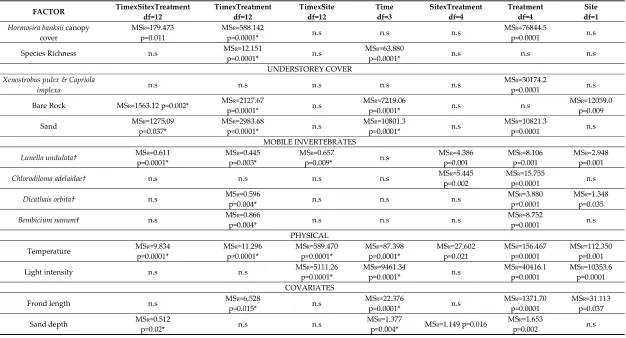
Table 1. Summary rmANOVA results comparing factors of interest and abundances of individual taxa and understorey cover components contributing significantly (identified by SIMPER) to differences amongst Hormosira-canopy treatments, sites and time. Only times when sampling of the two sites were close to each other were included for analysis: days 1, 5, 15/19 and 371/379. MSResidual (as MSR) and degrees of freedom (df) are provided to allow reconstruction of the full ANOVA table. * denotes P-values that were adjusted to Greenhouse-Geisser Epsilon, † denotes data Square-Root transformed to meet assumptions of normality, n.s = not significant (p>0.05).
FACTOR TimexSitexTreatment df=12 TimexTreatment df=12 TimexSite df=12 Time df=3 SitexTreatment df=4 Treatment df=4 df=1 Site
Hormosira banksii canopy
cover MSR=179.473 p=0.011 MSR=588.142 p=0.0001* n.s n.s n.s MSR=76844.5 p=0.0001 n.s
Species Richness n.s MSR=12.151 p=0.0001* n.s MSR=63.880 p=0.0001* n.s n.s n.s
UNDERSTOREY COVER Xenostrobus pulex & Capriola
implexa n.s n.s n.s n.s n.s
MSR=30174.2
p=0.0001 n.s
Bare Rock MSR=1563.12 p=0.002* MSR=2127.67 p=0.0001* n.s MSR=7219.06 p=0.0001* n.s n.s MSR=12059.0 p=0.009
Sand MSR=1275.09 p=0.037* MSR=2983.68 p=0.0001* n.s MSR=10801.3 p=0.0001* n.s MSR=10821.3 p=0.0001 n.s MOBILE INVERTEBRATES
Lunella undulata† MSR=0.611 p=0.0001* MSR=0.445 p=0.003* MSR=0.657 p=0.009* n.s MSR=4.386 p=0.001 MSR=8.106 p=0.001 MSR=2.948 p=0.001
Chlorodiloma adelaidae† n.s n.s n.s n.s MSR=5.445 p=0.002 MSR=15.755 p=0.0001 n.s
Dicathais orbita† n.s MSR=0.596 p=0.004* n.s n.s n.s MSR=3.880 p=0.0001 MSR=1.348 p=0.035
Bembicium nanum† n.s MSR=0.866 p=0.004* n.s n.s n.s MSR=8.752 p=0.0001 n.s
PHYSICAL
Temperature MSR=9.834 p=0.0001* MSR=11.296 p=0.0001* MSR=589.470 p=0.0001* MSR=87.398 p=0.0001* MSR=27.602 p=0.021 MSR=156.467 p=0.0001 MSR=112.350 p=0.001
Light intensity n.s n.s MSR=5111.26 p=0.0001* MSR=9461.34 p=0.0001* n.s MSR=40416.1 p=0.0001 MSR=10353.6 p=0.0001 COVARIATES
Frond length n.s MSR=6.528 p=0.015* n.s MSR=22.376 p=0.0001* n.s MSR=1371.70 p=0.0001 MSR=31.113 p=0.037
Table 2. Pairwise comparisons of a) understorey cover and b) mobile invertebrate assemblages between Hormosira-canopy treatment groups by sites following PERMANOVA on the significant treatment × site interaction terms. P(MC) is the P-value based on Monte Carlo random draws provides a more robust significance value with the reduced number of possible permutations in pairwise tests; statistical significance (α = 0.05) is indicated in bold.
a. Understorey Cover
13th Beach Day 1 Day 5 Day 15 Day 379
Groups t P(MC) t P(MC) t P(MC) t P(MC) Negligible, Full 2.7355 0.005 3.1076 0.001 3.4761 0.003 3.0716 0.002 Negligible, Patchy 2.261 0.011 2.0689 0.016 2.556 0.007 1.6355 0.048 Negligible, Removed 3.7294 0.001 4.1516 0.002 3.8215 0.002 4.1695 0.001 Negligible, Thinned 2.999 0.002 2.3286 0.004 2.7993 0.005 2.7044 0.002
Full, Patchy 1.32 0.175 1.7143 0.061 1.5254 0.099 1.4554 0.112
Full, Removed 1.7988 0.037 2.4151 0.007 2.684 0.005 5.3762 0.001 Full, Thinned 1.4372 0.124 1.2142 0.23 1.4212 0.144 1.3216 0.178 Patchy, Removed 2.2744 0.01 1.954 0.026 1.974 0.017 2.3982 0.007 Patchy, Thinned 1.5898 0.094 0.28847 0.956 1.4853 0.108 1.0035 0.4 Removed, Thinned 2.1327 0.02 1.6114 0.082 2.0228 0.035 3.4919 0.001
Bridgewater Bay Day 1 Day 5 Day 19 Day 371
Groups t P(MC) t P(MC) t P(MC) t P(MC) Negligible, Full 3.9928 0.001 3.472 0.003 4.3075 0.001 3.3129 0.003 Negligible, Patchy 2.2683 0.01 1.791 0.055 2.9745 0.007 0.99608 0.416 Negligible, Removed 2.6292 0.002 2.8406 0.005 5.0578 0.002 1.8123 0.029 Negligible, Thinned 3.6341 0.003 3.4366 0.003 3.5378 0.001 2.0145 0.017 Full, Patchy 3.0028 0.004 1.9309 0.043 1.9964 0.031 2.4889 0.009 Full, Removed 3.1564 0.002 2.5595 0.007 2.0738 0.04 2.8531 0.005 Full, Thinned 4.3495 0.001 1.3148 0.199 1.857 0.08 1.0017 0.399 Patchy, Removed 1.4045 0.14 1.5003 0.111 1.7736 0.053 1.3559 0.127 Patchy, Thinned 2.3606 0.013 1.2967 0.187 1.7255 0.072 1.3792 0.15 Removed, Thinned 1.0678 0.347 1.5106 0.099 0.47141 0.848 1.7502 0.033
b. Mobile Invertebrates
13th Beach Day 1 Day 5 Day 15 Day 379
11 of 31
Bridgewater Bay Day 1 Day 5 Day 19 Day 371
Groups t P(MC) T P(MC) t P(MC) t P(MC) Negligible, Full 3.8373 0.002 3.3296 0.002 2.8513 0.002 2.8735 0.001 Negligible, Patchy 1.7435 0.028 2.0275 0.016 1.5883 0.052 0.84361 0.554 Negligible, Removed 2.2146 0.02 2.2748 0.01 1.8333 0.028 1.0569 0.366 Negligible, Thinned 2.2084 0.003 2.1693 0.005 1.3721 0.111 1.7979 0.02 Full, Patchy 2.5234 0.003 1.9401 0.021 2.0477 0.013 1.9566 0.016 Full, Removed 2.4472 0.006 2.3379 0.003 2.291 0.019 1.9659 0.017 Full, Thinned 1.436 0.111 1.6196 0.069 1.8522 0.015 1.3402 0.174 Patchy, Removed 1.8608 0.026 1.5259 0.107 1.7104 0.03 0.92669 0.524 Patchy, Thinned 1.3634 0.132 1.4108 0.123 1.1969 0.231 0.98985 0.419 Removed, Thinned 1.5459 0.048 1.2201 0.226 1.1947 0.24 1.2061 0.209
Figure 5. Non-metric multidimensional scaling (nMDS) plots of understorey cover assemblages associated with different levels (full cover = dark blue, patchy cover = aqua, negligible cover = green, thinned = pink, removed = grey) of Hormosira cover a) 1 day, b) 5 days, c) 15/19 days and d) 371/379 days following manipulation at each of two sites (13th Beach = triangles, Bridgewater Bay = circles). All data were fourth-root transformed. 3D nMDS plots based on Bray-Curtis dissimilarities are shown where stress exceeded 0.20 for 2D plots.
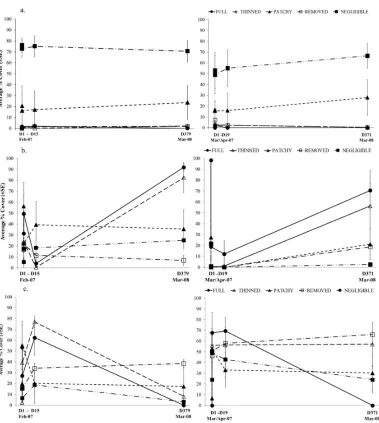
Figure 7. Average ± SE percentage cover of a) C. implexa & X. pulex, b) sand c) bare rock for each treatment over time since manipulation of the canopy. 13th Beach on left hand site of panel, Bridgewater Bay on right hand side. N = 5 for all treatments.
For the mobile invertebrate assemblages associated with the different levels of Hormosira-canopy cover, there were significant differences in assemblages amongst all treatments one day after manipulation, except patchy vs both full and thinned at 13th Beach and thinned vs both patchy and
full at Bridgewater Bay (Table 2, Figure 6). However by the end of the experiment, whilst there were no significant differences in the mobile invertebrate assemblages associated with full, patchy and thinned treatments at 13th Beach, full and patchy treatments were significantly different with respect
13 of 31
, juvenile littorinids and limpets not shown).
The turbinid Lunella undulata was consistently most abundant in the full canopy plots at both sites through time (Table 1,
), with approximately double the average abundance at Bridgewater Bay compared with 13th Beach.
Lunella undulata was found in patchy and thinned canopy plots at Bridgewater Bay but not at 13th
Beach (Table 1,
). The trochid Chlorodiloma adelaidae, was most abundant in the full canopy plots at both sites through time, though more were found in patchy and thinned treatments at 13th Beach during day 15 sampling
(Table 1,
). The predatory whelk Dicathais orbita varied in abundance between treatments and time, though was most often more abundant in patchy, full and thinned canopy treatments and in higher overall abundance at 13th Beach (Table 1,
15 of 31
).
Species richness ranged from an average of 4.5-9 at 13th Beach and 4.5-10.5 at Bridgewater Bay,
differing between treatments and sites though time with no consistent pattern (Table 1, Figure 9). Temperature remained lower under full canopies (average 20°C) compared with all other treatments on all but one occasion at one site (Day 5, Bridgewater Bay) during the experiment (Table 1, Figures 10). Negligible and/or removed canopy treatments had the highest temperatures (average 24°C) with patchy and thinned canopy plots having intermediate temperatures (average 22°C and 21°C respectively, Table 1, Figure 10). Light intensity was consistently lower in full canopies compared with all other treatments throughout the experiment (Table 1, Figure 11). Negligible canopy plots usually had the highest relative levels of light, though this wasn’t always statistically significant and is likely influenced by intermittent cloud cover during sampling (Table 1, Figure 11). Light levels in patchy and thinned treatments were generally intermediate between the two extremes of canopy cover (Table 1, Figure 11). Hormosira banskii frond length was found to be longer in full canopy plots at both sites (average 14 cm 13th Beach, 11 cm at Bridgewater Bay, Table 1, Appendix E). Frond length
averaged 9 cm in patchy and thinned plots at 13th beach; 10 and 7 cm at Bridgewater Bay, respectively
Figure 8. Mean ± SE percentage cover of a) Lunella undulata b) Chlorodiloma adelaidae, c) Dicathais orbita
d) Bembicium nanum, for each treatment over time since manipulation of the canopy. 13th Beach on left
17 of 31
Figure 9. Average species richness ±se between treatments and over time at 13th Beach (left hand side) and Bridgewater Bay (right hand side).
Figure 10. Average temperature (°C) ±se between treatments and over time at 13th Beach (left hand side) and Bridgewater Bay (right hand side).
4. Discussion
4.1 Hormosira banksii as an Ecosystem Engineer
The results of this study support the suggestion of Keough & Quinn [5] that ‘established’ H. banksii canopies function as ecosystem engineers on Victorian rocky shores by providing environmentally buffered refuges (cool and shaded) for particular species [see also 2, 9, 12, 21, 27]. We found differences in assemblages associated with different natural states of the canopy (full, patchy, negligible cover) across four sites; and like other studies [2, 5, 9, 12, 21] a loss of species occurred with the removal and part-removal of full canopies at two sites. Canopies that were naturally patchy did not function in the same way as full canopies, the environmental parameters measured under these canopies and the associated species assemblages were generally intermediate between those found under full canopies and in the absence of a canopy. This study builds on the findings of studies undertaken in Victoria and New Zealand [2, 5, 9, 12, 17, 21] by examining the role of H. banksii canopies not only in response to disturbance but also on areas of the shore that have naturally patchy canopies. This demonstrates that the assemblages associated with patchy canopies result from the reduced canopy cover and not disturbance per se.
The understorey and macroinvertebrate assemblages in areas of naturally negligible canopy cover (which were between or adjacent to canopy habitats with no differences in rock type, exposure or height on shore should) differed to those where the canopy was removed. Naturally negligible cover areas on the shore were dominated by grazing snails including limpets and periwinkles, and often aggregations of the mussel Xenostrobus pulex and the turfing alga Capreolia implexa. Since the disturbance treatments did not have assemblages that matched the natural controls (negligible areas) it suggests that it takes longer than 1 year for an alternative community such as the Xenostrobus pulex & Capreolia implexa complex to establish. This is consistent with studies showing variable recruitment [e.g. 37].
The physical conditions and associated assemblages within thinned canopy treatments and patchy canopies varied throughout time and between sites with negligible and full canopy areas varying from discrete to similar (consistent with studies in South Australia [26] and in New Zealand [12]). As found in New Zealand [9] no replacement of H. banksii occurred in this study. In contrast to similar studies in the northern hemisphere [e.g. 7], no other dominant canopy forming perennial algae extend into the intertidal region of Victorian rocky shores. In contrast to Lilley and Schiel [9], other fucoids were rarely recorded in the understorey of H. banksii, and were generally only observed in very low areas of the shore, rarely exposed by tides (e.g. Cystophora torulosa). This may be due to differences in H. banskii frond length (up to 18 cm in our study, up to 25 in Lilley and Schiel [9], see also [38]) or climatic differences in extreme temperatures during tidal emersion between Victorian and southern New Zealand shores. The results of this study demonstrate that dense and patchy canopies support different species assemblages and have differing effects on the physical environment. Thus although H. banksii dominates reef platforms, the magnitude of its ecosystem engineer function for associated communities is influenced by the amount of canopy cover.
4.2 Species associations with cover
2 of 31 trampling intensity [21]. In our study L. undulata and C. adelaidae consistently differed in abundance between treatments indicating disturbance and canopy cover investigations aren’t equal. Although H. banksii canopies studied by Underwood [24] correspond to the ‘patchy’ areas in this study (similar frond length and cover), he found no difference in the abundance of the grazing gastropod B. nanum between canopy and non-canopy treatments. In our study they were most abundant in negligible areas on all except one sampling day suggesting either site-specific/latitudinal effects or that this species has different habitat preferences in the absence of disturbance.
Despite the lack of coralline turf, the fleshy turf-forming alga Capreolia implexa was common in both patchy (all sites) and negligible-cover plots (at both experimental sites) and was observed to form large mats discrete from H. banksii often in conjunction with the mussel Xenostrobus pulex. Hormosira banksii was rarely observed growing within the C. implexa turf suggesting this species may be competitively excluding H. banksii from growing on some areas of the shore [as found for coralline turf elsewhere, 39], though this would need to be tested experimentally.
4.4 Alternate habitat types and stable states
What was evident during this study was that discrete habitats are occurring on Victorian rocky shores, made up of stable, full-canopy H. banksii beds, areas of patchy (possibly disturbed) areas of canopy mixed with a range of other habitats, and ‘bare’ (negligible canopy) areas that consist of rock with abundant grazers, and substrate dominated by aggregating mussels, or turfing algae. Despite such habitats commonly referred to in the literature as vertical ‘zones’, the results of this study support the earlier refutation of vertical zonation on temperate Australian shores by Underwood [40], as all these discrete habitats occurred without variation in exposure, height on shore or other observable abiotic factors. The multiple habitats occurring on the shores investigated in this study and their different species assemblages support the concept of multiple stable states (though planned manipulative experiments are necessary to test this). The differences in assemblages associated with patchy or dense H. banksii cover demonstrates that it functions as an autogenic ecosystem engineer at least at the covers investigated. Since removed and negligible-cover plots supported alternative assemblages, it is evident that not all species on the shore are dependent on canopy cover as habitat. It was clear that the presence of these multiple habitats across a shore allows a higher overall shore biodiversity than would exist with only one or few habitats, even extensive and dense H. banksii. Since predictable assemblages were associated with easily identifiable habitat areas, rapid assessment of reef health could be possible if applied to areas of high conservation value.
4.5 The influence of sand
banksii canopies may be contributing to the comparatively lower abundances of understorey algae and invertebrates recorded in observations of other canopies such as Ascophyllum nodosum in the northern hemisphere where sand cover was not found in significant amounts [see 44]. Further well-planned investigations into the role of sand on intertidal rocky reefs [45] may well provide valuable insight into this finding.
5. Conclusions
Full canopies (within the vertical range of H. banksii) provided habitat for species that are not found elsewhere on the reef at four sites. Low canopy cover (both natural and disturbed) resulted in different species than found within an intact canopy, correlating with a reduction in the ability of the canopy to buffer temperature and light stress. Patchy canopies (between 40-60 % cover) have species assemblages and physical conditions intermediate between full canopies and areas where H. banksii was absent on the shore.
Appendix A. Species and component list by site and type (> 78 species).
Bridgewater Bay 13th Beach Sorrento Back Beach Point Roadknight
Primary Algae
Capreolia implexa Cladophora sp. Coralline Turf Hormosira banksii Scytosiphon lomentaria
Ulva sp.
Capreolia implexa Ceramium sp. Cladophora sp. Colpomenia sinuosa
Coralline Turf Encrusting Coralline
Hormosira banksii Sargassum sp. Laurencia filiformis
Laurencia spp. Ulva sp. Unidentified Reds
Capreolia implexa Cladophora sp. Coralline Turf Hormosira banksii
Laurencia sp. Rivularia sp. Ulva sp.
Capreolia implexa Coralline turf Diplocladia patersonis Encrusting Coralline Hormosira banksii Notheia anomala Scytosiphon lomentaria Ulva sp.
Understorey Algae
‘Coralline Turf’ is likely Corallina officinalis but due to compact form was not able to be positively identified in the field.
Caulocystis cephalornithos Ceramium sp. Chaetomorpha sp.
Cladophora sp. Colpomenia sinuosa Coralline Turf Diplocladia patersonis Encrusting Coralline Gelidium australe Laurencia botryoides Laurencia filiformis Laurencia spp. Notheia anomala Scytosiphon lomentaria
Sargassum sp. Ulva sp. Unidentified Encrusting Black Unidentified Epiphytes Unidentified Reds Encrusting green Capreolia implexa Caulerpa brownii
Ceramium sp. Chaetomorpha sp.
Cladophora sp. Colpomenia sinuosa Coralline Encrusting
Coralline Turf Cystophora spp. Laurencia botryoides
Laurencia filiformis Laurencia spp. Notheia anomala Pachydictyon sp. Sargassum sp.
Ulva sp. Unidentified Reds
Capreolia implexa Ceramium sp. Cladophora sp. Cystophora sp. Coralline Turf Diplocladia
patersonis Encrusting
Coralline Laurencia sp. Rivularia sp. Ulva sp.
Capreolia implexa Ceramium sp. Cladophora sp. Coralline Turf Diplocladia
patersonis Encrusting
2 of 31
Invertebrates Bridgewater Bay 13th Beach Sorrento Back Beach Point Roadknight
Bivalves Brachidontes rostratus Xenostrobus pulex Unidentified Bivalve
Xenostrobus pulex
Unidentified Bivalve Xenostrobus pulex Xenostrobus pulex
Polycheates Galeolaria caespitosa Galeolaria caespitosa Galeolaria caespitosa Galeolaria caespitosa
Limpets
(and false limpets) Cellana tramoserica Lottia mixta Montfortula rugosa Notoacmea alta Notoacmea flammea Onchidella nigricans Patelloida alticostata Patelloida latistrigata Siphonaria diemenensis Siphonaira zelandica Juvenile limpets (unidentified) Cellana tramoserica Lottia mixta Notoacmea flammea Notoacmea sp. Onchidella nigricans Patelloida alticostata Siphonaria diemenensis Siphonaria zelandica Juvenile limpets (unidentified) Cellana tramoserica Lottia mixta Notoacmea alta Notoacmea flammea Notoacmea petterdi Notoacmea sp. Patelloida alticostata Patelloida latistrigata Siphonaria diemenensis Siphonaria funiculata Siphonaria zelandica Juvenile limpets (unidentified) Cellana tramoserica Montfortula rugosa Notoacmea sp. Notoacmea flammea Notoacmea petterdi Patella peroni Patelloida alticostata Patelloida latistrigata Siphonaria diemenensis Siphonaria zelandica Siphonaria funiculata Juvenile limpets (unidentified)
Gastropods Austrocochlea constricta Austrocochlea porcata Austrolittornia unifasciata Bembicium nanum Cantharidius pulcherimus Chlorodiloma adelaidea Chlorodiloma odontis Cominella lineolata Dicathais orbita Littorinid juvenile (unidentified) Mitre sp.
Phasianotrochus eximus Austrocochlea constricta Bembicium nanum Cantharidius pulcherimus Chlorodiloma adelaidea Chlorodiloma odontis Cominella lineolata Cystophora sp. Dentrimitrella pulla Dicathais orbita Lepsellia vinosa Littorinid juvenile (unidentified) Mitre cabonaria Austrocochlea constricta Austrolittorina unifasciata Bembicium nanum Chlorodiloma adelaidae Cominella lineolata Dicathais orbita Littorinid juvenile (unidentified) Nerita atramentosa Lunella undulata Austrocochlea constricta Austrocochlea juvenile Bembicium nanum Chlorodiloma adelaidae Cominella lineolata Dicathis orbita Lepsiella vinosa Littorinid juvenile (unidentified) Mitre sp.
3 of 31
Thalotia conica Lunella undulata
Phasianotrochus eximus Thalotia conica
Lunella undulata Waimatea obscura Echinoderms Meridiastra calcar
Parvulastra exigua Meridiastra calcar Meridiastra calcar Parvulastra exigua
Crustaceans Chthalaumus antennatus Paragrapsus quadradentatus Guinusia chabrus
Naxia aurita
Unidentified Amphipods Unidentified Copepods Unidentified Harpactocoids Unidentified Isopods
Chthalaumus antennatus Naxia aurita
Nectocarcinus turbculosa Paragrapsus quadradentatus Guinusia chabrus
Unidentified Amphipods Unidentified Copepods Unidentified Harpactocoids Unidentified Isopods
Cthalaumus antennatus Paragrapsus quadradentatus Paragrapsus sp.
Unidentified Isopods Unidentified Amphipods
Chthalaumus antennatus Paragrapsus quadradentatus Unidentified Isopods
Anemones Actinia tenebrosa Anthothoe albocinta Aulactinia verartra Oulactis mucosa Oulactis sp.
Unidentified anemones
Anthothoe albocinta Oulactis mucosa Oulactis sp.
Oulactis mucosa Oulactis sp.
Unidentified Anemone
Actinia tenebrosa Aulactinia verartra
4 of 31
Appendix B Summary SIMPER table: Average dissimilarity of treatment pairs for understorey cover combining Bridgewater Bay and 13th Beach. Contributions >
10 % given by understorey component/species.
Negligible,
Full Negligible, Patchy Negligible, Removed Negligible, Thinned Patchy Full, Removed Full, Thinned Full, Removed Patchy, Thinned Patchy, Removed, Thinned
Day 1 % contribution
Average dissimilarity 85.69 86.79 92.19 95.80 71.50 93.79 86.46 89.44 86.46 79.29
Sand 31.06 24.75 11.39 41.64 34.32 35.03 23.11 35.03 34.13
Bare rock 24.28 25.10 14.49 16.62 23.92 13.05 23.92
Xenostrobus pulex 22.07 21.22 20.56 33.77
Capreolia implexa 10.43 12.93 12.93
Capreolia implexa & Xenostrobus pulex complex
15.06 13.71 14.11 13.99
Hormosira holdfasts 18.10 17.87 18.77 34.13
Day 5 % contribution
Average dissimilarity 83.06 68.07 76.89 83.50 67.48 65.42 56.82 63.20 58.44 58.43
Sand 10.01 12.00
Bare rock 24.26 26.68 22.74 23.80 26.54 14.69 23.86 29.54 27.27
Xenostrobus pulex 11.70 10.59
Capreolia implexa 10.21
Capreolia implexa & Xenostrobus pulex complex
11.00 10.24
Hormosira holdfasts 14.32 14.17 14.59 15.47
Encrusting Coralline 10.68 11.11
Day 15/19 % contribution
Average dissimilarity 89.42 89.29 89.11 87.75 77.87 76.06 63.50 82.10 79.80 70.73
Sand 10.92 16.44 12.35 13.83
Bare rock 44.76 28.51 33.73 43.19 37.61 52.35 55.86 35.59 49.55 55.25
Xenostrobus pulex 20.14 24.31 20.61 23.00
5 of 31
Capreolia implexa & Xenostrobus pulex complex
15.31 14.15 15.42 14.66
Hormosira holdfasts 15.20 17.96 17.70 15.68
Encrusting Coralline 10.99 10.70 13.59
Day 371/379 % contribution
Average dissimilarity 74.77 65.21 74.84 70.44 66.23 82.67 43.72 73.20 61.17 68.96
Sand 15.79 13.54 13.56 23.91 16.27 11.50 21.08 16.26
Bare rock 15.20 10.61 11.50 16.20 15.49 10.70 13.56 13.36 13.76
Xenostrobus pulex 10.58 12.59
Capreolia implexa 12.29 10.50 13.04
Capreolia implexa & Xenostrobus pulex complex
18.14 20.89 12.81 17.40
Hormosira holdfasts 10.21 11.71 17.40 12.54
Encrusting Coralline 11.18 15.70 11.15
Cladophora sp. 10.37 13.85
Galeolaria caespitosa 13.07
6 of 31
Appendix C. Summary SIMPER table: Average dissimilarity of treatment pairs for mobile macroinvertebrates combining Bridgewater Bay and 13th Beach.
Contributions > 10 % given by species.
Negligible,
Full Negligible, Patchy Negligible, Removed Negligible, Thinned Patchy Full, Removed Full, Thinned Full, Removed Patchy, Thinned Patchy, Removed, Thinned
Day 1 % contribution
Average dissimilarity 100 87.08 95.15 100 87.82 97.60 84.51 94.22 78.41 92.31
Bembicium nanum 13.37 14.73 24.13 17.73
Juvenile littorinid 13.57 19.84 14.48
Chlorodiloma adelaidae 11.98 13.35 21.69 15.77 13.32 10.33
Dicathais orbita 10.37 14.64 19.22 15.71 35.69
Lunella undulata 15.06 14.35 12.40
Siphonaria diemenensis 13.24
Cominella lineolata 12.95
Day 5 % contribution
Average dissimilarity 97.22 87.20 96.04 100 86.40 99.46 90.93 97.98 96.60 100
Bembicium nanum 14.76 16.95 30.93 25.31 12.16 10.15
Juvenile littorinid 15.52 18.26 35.55 27.24
Chlorodiloma adelaidae 12.33 10.02
Dicathais orbita 12.99 12.01 12.33 10.50 23.19 19.25
Lunella undulata 10.98 12.40 11.00 13.02
Oulactis mucosa 15.90 10.34 14.59
Amphipoda 23.80
Anthothoe albocinta 11.90
Day 15/19 % contribution
Average dissimilarity 99.51 89.83 97.03 94.90 81.65 96.39 85.72 95.73 86.69 95.48
Bembicium nanum 10.09 19.65 13.43 16.17
Juvenile littorinid 14.06 14.74 24.87 19.41
Chlorodiloma adelaidae 11.82 18.18 16.94 10.86
Dicathais orbita 11.30 15.35 15.35 15.90
Lunella undulata 10.41 14.44 15.99 14.96 20.61 16.87
7 of 31
Cominella lineolata 12.45 13.20 11.47 18.27
Aulactinia veratra 10.20 10.45
Day 371/379 % contribution
Average dissimilarity 100 84.84 83.78 97.99 87.81 97.15 79.51 88.77 85.52 89.96
Bembicium nanum 14.24 15.96 13.47 15.11
Juvenile littorinid 21.25 25.36 21.07 21.59
Chlorodiloma adelaidae 11.43 17.01 12.97 23.57 15.62 10.04
Dicathais orbita 11.19 11.56 12.29 16.75 12.73 14.11
Lunella undulata 12.95 18.66 14.55 20.70
Siphonaria diemenensis 11.00 10.40 11.55 11.67
Cominella lineolata 11.70 13.89 15.47
Juvenile limpet 14.67 11.15 14.71 12.26
8 of 31
Appendix D. Average sand depth (cm ±se) between treatments and over time at 13th Beach (left hand side) and Bridgewater Bay (right hand side).
Author Contributions: For research articles with several authors, a short paragraph specifying their individual contributions must be provided. The following statements should be used “Conceptualization, J.B.P., A.B.; Methodology, J.B.P; Software, J.B.P, T.O. and A.B; Validation, J.B.P, A.B, M.J.K., T. O.; Formal Analysis, J.B.P and A.B.; Investigation, J.B.P.; Resources, T.O, M.J.K and A.B.; Data Curation, J.B.P. and A.B; Writing-Original Draft Preparation, J.B.P.; Writing-Review & Editing, J.B.P, A. B, T. O, M. J. K.; Visualization, J.B.P.; Supervision, A.B, T.O; M.J.K.; Project Administration, J.B.P. and T.O.; Funding Acquisition, T.O.”
Funding: This research was funded by an Australian National Heritage Trust grant awarded to T.D.O, project no: 202244. JBP was funded by a studentship under this grant and a Melbourne University Graduate Research scholarship.
Acknowledgments: Acknowledgement is given to Sera Cutler, Rebecca Citroen, Trudy Costa, Robert Pocklington and John Pocklington for field assistance. Gerry Kraft assisted with identification of algae. The Marine Research Group (The Field Naturalists Club of Victoria) assisted with invertebrate identification. Dane Balodis created the map of study sites. Trudy Costa, Prue Addison, and Liz Greaves provided discussion and feedback throughout the study. Drafts of this manuscript were improved by feedback from Jorge Gutierrez and two anonymous reviewers. Research in National Parks was carried out under permits (10003820 & 10003879) pursuant to the National Parks Act 1975, research at other sites was carried out under permit (RP699) pursuant to the Fisheries Act 1995.
Conflicts of Interest: The authors declare no conflict of interest.
References
1. Menge, Bruce A. "Predation Intensity in a Rocky Intertidal Community: Effect of an Algal Canopy, Wave Action and Desiccation on Predator Feeding Rates." Oecologia 34 (1978): 17-35.
2. Povey, A., and M. J. Keough. "Effects of Trampling on Plant and Animal Populations on Rocky Shores."
Oikos 61, no. 3 (1991): 355-68.
3. Jones, C G, J H Lawton, and M Shachak. "Organisms as Ecosystem Engineers." Oikos 69, no. 3 (1994): 373-86.
4. Alper, Joseph. "Ecosystem 'Engineers' Shape Habitats for Other Species." Science 280, no. 5367 (1998): 1195-96.
5. Keough, M. J., and G. P. Quinn. "Effects of Periodic Disturbances from Trampling on Rocky Intertidal Algal Beds." Ecological Applications 8, no. 1 (1998): 141-61.
6. Schiel, D. R., and D. I. Taylor. "Effects of Trampling on a Rocky Intertidal Algal Assemblage in Southern New Zealand." Journal of Experimental Marine Biology and Ecology 235, no. 2 (1999): 213-35.
7. Jenkins, S. R., T. A. Norton, and S. J. Hawkins. "Long Term Effects of Ascophyllum nodosum Canopy Removal on Mid Shore Community Structure." Journal of the Marine Biological Association of the United
Kingdom 84, no. 2 (2004): 327-29.
8. Dudgeon, S., and P. S. Petraitis. "First Year Demography of the Foundation Species, Ascophyllum
nodosum, and Its Community Implications." Oikos 109, no. 2 (2005): 405-15.
9. Lilley, S. A., and D. R. Schiel. "Community Effects Following the Deletion of a Habitat-Forming Alga from Rocky Marine Shores." Oecologia 148, no. 4 (2006): 672-81.
10. Schiel, D. R. "Rivets or Bolts? When Single Species Count in the Function of Temperate Rocky Reef Communities." Journal of Experimental Marine Biology and Ecology 338, no. 2 (2006): 233-52.
11. Hastings, A., J. E. Byers, J. A. Crooks, K. Cuddington, C. G. Jones, J. G. Lambrinos, T. S. Talley, and W. G. Wilson. "Ecosystem Engineering in Space and Time." Ecology Letters 10, no. 2 (2007): 153-64. 12. Schiel, D, and S Lilley. "Gradients of Disturbance to an Algal Canopy and the Modification of an
Intertidal Community." Marine Ecology Progress Series 339 (2007): 1-11.
13. Benedetti Cecchi, Lisandro, and Francesco Cinelli. "Canopy Removal Experiments in Cystoseira -Dominated Rockpools from the Western Coast of the Mediterranean (Ligurian Sea)." Journal of
Experimental Marine Biology and Ecology 155, no. 1 (1992): 69-83.
14. Cervin, Gunnar, and Per Åberg. "Do Littorinids Affect the Survival of Ascophyllum Nodosum Germlings?" Journal of Experimental Marine Biology and Ecology 218, no. 1 (1997): 35-47.
15. Pavia, Henrik, Herman Carr, and Per Åberg. "Habitat and Feeding Preferences of Crustacean Mesoherbivores Inhabiting the Brown Seaweed Ascophyllum nodosum (L.) Le Jol. And Its Epiphytic Macroalgae." Journal of Experimental Marine Biology and Ecology 236, no. 1 (1999): 15-32.
16. Coleman, M. A., J. S. Clark, M. A. Doblin, M. J. Bishop, and B. P. Kelaher. "Genetic Differentiation between Estuarine and Open Coast Ecotypes of a Dominant Ecosystem Engineer " Marine and Freshwater
17. Wootton, H. F., and M. J. Keough. "Disturbance Type and Intensity Combine to Affect Resilience of an Intertidal Community." Marine Ecology Progress Series 560 (2016): 121-33.
18. Tait, Leigh W., and David R. Schiel. "Legacy Effects of Canopy Disturbance on Ecosystem Functioning in Macroalgal Assemblages." PLOS ONE 6, no. 10 (2011): e26986.
19. Raffaelli, David. "The Grazer-Algae Interaction in the Intertidal Zone of New Zealand Rocky Shores."
Journal of Experimental Marine Biology and Ecology 38 (1979): 81-100.
20. Underwood, A. J. "The Vertical Distribution and Seasonal Abundance of Intertidal Macroalgae on a Rocky Shore in New South Wales." Journal of Experimental Marine Biology and Ecology 78, no. 199-220 (1984).
21. King, A. Monitoring and Management of Human Activity on Rocky Shores. MSc, Melbourne University, Melbourne, 1992.
22. Bellgrove, A. Recruitment of Intertidal Macroalgae on a Wave-Exposed Rocky Coast. PhD, Monash Clayton, 1998.
23. Ralph, P. J., D. A. Morrison, and A. Addison. "A Quantitative Study of the Patterns of Morphological Variation within Hormosira Banksii (Turner) Decaisne (Fucales: Phaeophyta) in South-Eastern Australia." Journal of Experimental Marine Biology and Ecology 225, no. 2 (1998): 285-300.
24. Underwood, A. J. "Grazing and Disturbance: An Experimental Analysis of Patchiness in Recovery from a Severe Storm by the Intertidal Alga Hormosira banksii on Rocky Shores in New South Wales." Journal
of Experimental Marine Biology and Ecology 231, no. 2 (1998): 291-306.
25. Underwood, A J. "Physical Disturbances and Their Direct Effect on an Indirect Effect: Responses of an Intertidal Assemblage to a Severe Storm." Journal of Experimental Marine Biology and Ecology 232, no. 1 (1999): 125-40.
26. Pocklington, J B. Positive Interactions on Rocky Seashores. Are They Important, or Can They Be Ignored? Honours Thesis, Honours, Flinders University of South Australia, Adelaide, 2003.
27. Lilley, S. A. Removal of Habitat-Forming Species and the Consequences on Community Biodiversity in New Zealand Rocky Shore Ecosystems. MSc, MSc, Canterbury University, Christchurch, 2004. 28. Macinnis-Ng, C. M. O., D. A. Morrison, and P. J. Ralph. "Temporal and Spatial Variation in the
Morphology of the Brown Macroalga Hormosira banksii (Fucales, Phaeophyta)." Botanica Marina 48, no. 3 (2005): 198-207.
29. Addison, P. F. E, R. S Koss, and T. D. O'Hara. "Recreational Use of a Rocky Intertidal Reef in Victoria: Implications for Ecological Research and Management." Australian Journal of Environmental Management 15 (2008): 169-79.
30. Schoenwaelder, M. E. A. "Physode Distribution and the Effect of 'Thallus Sunburn' in Hormosira banksii (Fucales, Phaeophyceae)." Botanica Marina 45, no. 3 (2002): 262-66.
31. Bishop, Melanie J., Tara Morgan, Melinda A. Coleman, Brendan P. Kelaher, Lyndle K. Hardstaff, and Robert W. Evenden. "Facilitation of Molluscan Assemblages in Mangroves by the Fucalean Alga Hormosira banksii." 2009.
32. Short, A D. Beaches of the Victorian Coast & Port Phillip Bay: A Guide to Their Nature, Characteristics, Surf
and Safety. Sydney: University of Sydney & Surf Life Saving Victoria, 2006.
33. Bird, EC. The Coast of Victoria: The Shaping of Scenery. Carlton: Melbourne University Press, 1993. 34. Kruskal, J.B. "Non-Parametric Multidimensional Scaling: A Numerical Method." Psychometrika 29
(1964): 115-29.
35. Clarke, K.R. "Non-Parametric Multivariate Analyses of Changes in Community Structure." Australian
Journal of Ecology 18 (1993): 117-43.
36. Anderson, M.J., R.N. Gorley, and K.R. Clarke. Permanova+ for Primer: Guide to Software and Statistical
Methods, Primer-E. Plymouth, UK, 2008.
37. Bellgrove, A., M. N. Clayton, and G. P. Quinn. "An Integrated Study of the Temporal and Spatial Variation in the Supply of Propagules, Recruitment and Assemblages of Intertidal Macroalgae on a Wave-Exposed Rocky Coast, Victoria, Australia." Journal of Experimental Marine Biology and Ecology 310 (2004): 207-25.
38. Gemelli, F., C. R. Johnson, and J. T. Wright. "Gastropod Communities Associated with Different Morphologies of the Intertidal Seaweed Hormosira banksii." Marine and Freshwater Research 70, no. 2 (2019): 280-91.
39. Bellgrove, A, PF McKenzie, JL McKenzie, and BJ Sfiligoj. "Restoration of the Habitat-Forming Fucoid Alga Hormosira Banksii at Effluent-Affected Sites: Competitive Exclusion by Coralline Turfs." Marine
Ecology Progress Series 419 (2010): 47-56.
3 of 31 41. Airoldi, Laura, and Stephen J. Hawkins. "Negative Effects of Sediment Deposition on Grazing Activity
and Survival of the Limpet Patella Vulgata." Marine Ecology Progress Series 332 (2007): 235-40.
42. McKenzie, Prudence F., and Alecia Bellgrove. "Dislodgment and Attachment Strength of the Intertidal Macroalga Hormosira banksii (Fucales, Phaeophyceae)." Phycologia 48, no. 5 (2009): 335-43.
43. Schiel, D. R., S. A. Wood, R. A. Dunmore, and D. I. Taylor. "Sediment on Rocky Intertidal Reefs: Effects on Early Post-Settlement Stages of Habitat-Forming Seaweeds." Journal of Experimental Marine Biology
and Ecology 331, no. 2 (2006): 158-72.
44. Pocklington, Jacqueline B., Stuart R. Jenkins, Alecia Bellgrove, Michael J. Keough, Tim D. O'Hara, Patricia E. Masterson-Algar, and Stephen J. Hawkins. "Disturbance Alters Ecosystem Engineering by a Canopy-Forming Alga." Journal of the Marine Biological Association of the United Kingdom 98, no. 4 (2018): 687-98.
45. Airoldi, Laura. "The Effects of Sedimentation on Rocky Coast Assemblages." In Oceanography and Marine
Biology, an Annual Review, edited by R. N. Gibson and R. J. A. Atkinson, 161-236. London: Aberdeen