Error assessment in Image Stereo-correlation
M. Fazzini1,a, S. Mistou1 and O. Dalverny1
1
Université de Toulouse, INPT / ENIT, LGP, Avenue d'Azereix, BP 1929 F-65016 Tarbes, France
Abstract. The aim of this work is to estimate errors related to Stereo-correlation technique applied to measurements of displacements. In a first step, the influence of the cameras positions is tested using a standard object. In a second step, an evaluation of the stereo-correlation system is achieved. It is based on the generation of synthetic images representative of real speckle patterns deformed. With these images, various parameters are treated in order to determine their impact on the measurement error.
1 Introduction
Stereo-correlation is an optical full-field measurement technique which is a mix between Digital Image Correlation (DIC) and stereovision. DIC is an optical full-field measurement technique which was appeared twenty years ago [1, 2, 3]. It consists in recording with a camera some digital images of a specimen undergoing an in-plane displacement field and computing the image correlation by an appropriate software. To characterize the DIC system, systematic studies have been recently proposed by the Workgroup “Metrology” of the French CNRS research network 2519 [4] based on synthetic images undergoing a sinusoidal displacement field. In this paper, we will propose methods which allow the characterization of the stereo-correlation. In the first time, we will determine the error of 3D reconstruction using a standard object. After that, we will adopt the same approach taken by the Workgroup “Metrology” of the French CNRS research network 2519 but adapted to the stereo-correlation technique. We propose a procedure which evaluate errors due to parameters specific to the stereo-correlation with real images (image acquisition, calibration, ...).
2 Stereovision
Stereovision is a technique based on the triangulation which calculate the intersection of two projective lines (projection point in the plans of the two CCD sensors), knowing the corresponding one pixel of the first image in the second. Several parameters may affect the accuracy of the measurement. The purpose of this study is to determine the influence of these parameters from the evaluation of the reconstruction error.
2.1 Experimental device
We used a cylinder on which a speckle pattern is bonded. In order to evaluate the influence of the
a
e-mail : [email protected]
camera positions, different configurations were tested: the distance between the two cameras (D1) which can be 200, 300 or 400 mm and the distance between the optical centre of the system and the standard object (D2) located at 250, 300, 400, 500, 600, 700 or 800 mm. The angle between the two cameras is deduced from these two parameters.
Fig. 1. Position parameters of cameras
For each configuration, a theoretical cylinder with a radius 25 mm is fitted by the least squares method on the cloud of measured point. The figure 2 corresponds to the left and right images of the cylinder taken with D1=400 mm and D2=700 mm, and also a 3D reconstruction of the cylinder calculated by stereovision with Aramis 3D software [5]. In order to evaluate the accuracy, systematic, random and RMS error are calculated for each configuration
:
ܴܯܵሺܺሻ ൌ ටσ ሺܺ݊ ݉݁ݏെܺݐ݄ሻʹ
݊ ൌ ට
݊െͳ ݊ ߪ
ʹሺܺሻ οܺതതതതʹ (1)
With - ߪሺܺሻ ൌ ට݊ σ ሺܺ݊ ݉݁ݏെܺݐ݄ሻʹെሺσ ሺܺ݊ ݉݁ݏെܺݐ݄ሻሻ
݊ሺ݊െͳሻ standard deviation: random error
- οܺതതതത ൌ݊ͳσ ሺܺ݊ ݉݁ݏ െ ܺݐ݄ሻ average: systematic error
(a) (b)
Fig. 3. Position parameters of cameras
2.2 Results
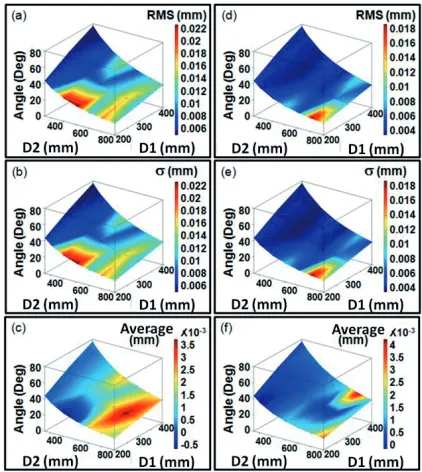
The distribution of RMS error, the standard deviation and the average as a function of the distance between the two cameras, the distance between the optical centre of the system and the standard object and the angle between the cameras for a subset size of 16 pixels is shown in the Figure 4. The distributions (a) (b) (c) of Figure 4 are obtained with all the points while the distributions (d) (e) (f) of Figure 4 are made from the points of the zone Z1. According to the measured area, the distribution is different but in both cases the RMS error is controlled by the standard deviation, the systematic error is low. We note that the maximum RMS error (0.0226 mm) is reached for D1=200mm and D2=500mm (ie angle = 22.6 °) in the case of adjustment on all measured points when he reached 0.0084 mm Z1. In this zone Z1, each configuration leads to statistics based on the same sample. We find that the more we move away from the object, the more the RMS error increases. The study on all measured points leads statistics based on variable samples, larger samples when the angle between cameras is small, a small angle (less than 30 °) produces a larger RMS errors.
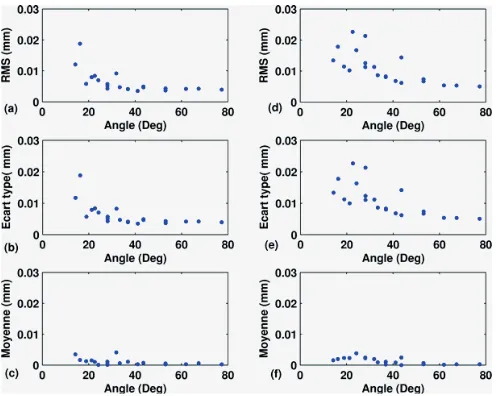
Fig. 5. RMS error, standard deviation and average as a function of theangle with Z1 (a) (b) (c) and for the total area (d) (e) (f)
The graphs in Figure 5 show the influence of the angle between the cameras on the reconstruction error. Whatever the points used (distributions (a) (b) (c) from the points of the zone Z1 and distributions (d) (e) (f) with all points); we note that when we increase the angle between the cameras, we can observe two phenomena: a reduction of RMS error and a decrease of the dispersion of RMS errors. This dispersion is noticeable from an angle of 50 ° and is increasing with the decrease of angle, especially when we use all points of measurement. Dispersion is important in the case of fitted by the least squares method on the 25mm radius from an angle of 30 °. The best reconstructions were performed with an angle greater than or equal to 30 °, the RMS error obtained is less than 0.01 mm on all points and 0,005 mm with Z1. With a large angle, the vision field will be reduced. The compromise is therefore 30 °.
3 Stereo-correlation
The techniques of digital image correlation and reconstruction were evaluated separately, the first in many studies encountered in the bibliography [4, 6, 7, 8, 9, 10], the second in the previous section. To test the DIC part and the reconstruction part simultaneously, we wanted to conduct a study similar to the work of the Workgroup “Metrology” of the French CNRS research network 2519 [4]. The idea is to use perfect synthetic images that we can control some parameters (speckle size, deformation, ...). A computation made by a software of stereo-correlation requires a pair of images from two different cameras and a calibration to determine the positions of the cameras. Two solutions are possible. With our equipment, we are unable to conduct a study in stereo-correlation with synthetic images. We have therefore decided to conduct a study with real images from the synthetic images.
3.1 Experimental device
ܷ൫ݔ൯ ൌ ߙǤ Ǥ ݏ݅݊ ቀʹߨݔ
ቁ ݁ݔ (2)
ܷǡݔ൫ݔ൯ ൌ ߲ܷ ߲ݔ ൌ ʹߨߙǤ ܿݏ ቀ ʹߨݔ ቁ ݁ݔ ൌ ܷǡݔ ܯܽݔܿݏ ቀʹߨݔ
ቁ ݁ݔ (3)
ܷǡݔݔ൫ݔ൯ ൌ ߲ʹܷ ߲ݔʹൌ െͶߨʹߙ Ǥ ݏ݅݊ ቀ ʹߨݔ ቁ ݁ݔ ൌ െܷǡݔݔ ܯܽݔݏ݅݊ ቀʹߨݔ
ቁ ݁ݔ (4)
where p is the period in pixel and Dp the amplitude of deformation. Chosen values for the strain amplitude D and for the period p are respectively D{0.02; 0.01; 0.005; 0.001} and p{10; 20; 30; 60; 130; 260; 510} pixels, for 512x512 pixel images. Note that corresponding values of the maximum displacement gradient are 12.6%, 6.3%, 3.1% and 0.6%, respectively.
(a) (b) (c)
Fig. 6. Example of simulated synthetic images: reference (a) and deformed images (p = 260 pixels, (b) D=0.02, (c) D=0.1).
The use of real images for this study produces some errors. We can mention errors due to non perfect cameras (calibration, distortion, sharpness, ...), the environment (difference in contrast between images, ...) or the test itself. To minimize errors due to the test, we used synthetic images. This choice allows us to control the deformation very precisely. To avoid any rigid body movement during image changes, and then add errors to the correction of these movements, the synthetic images described earlier scrolled on a computer screen (LCD, 1920x1200 pixels) .
Fig. 7. Left and right images and the x displacement field
The left camera is placed parallel to the plane of the screen to use images taken by this camera in digital image correlation. As for the previous study, the results are presented in terms of systematic, random and RMS error.
3.2 Results
(a) (b)
Fig. 8. RMS(U) (a) and RMS(U)/D2UMax,xx (b) as a function of period p for various strain amplitudes Dand a subset size D=16 pixels
The curves of RMS(U) as a function of period p show that the transition between the stereo-correlation and DIC with real images has little influence in our case. Indeed the curves for these two configurations are very close with still better performance for stereo-correlation. This trend can be explained by a misalignment of the left camera used for correlation.
(a) (b)
(c) (d)
Fig. 9. RMS(U) as a function of period p for various strain amplitudes Dand a subset size D=10 pixels (a),
Furthermore, when we compare the results with real images and results with synthetic images, we find that the bias associated with the acquisition of images is not negligible and supplants the error due the stereovision. Another source of errors due to the acquisition may be linked to the images themselves. Indeed, to capture the synthetic images through the cameras, we have scrolls on a computer screen. The refresh rate of screen, the resolution, the scaling of images are parameters that may affect the measurement and could explain the differences between curves.
(a) (b)
(c) (d)
Fig. 10. RMS(U)/D2UMax,xx as a function of period p for various strain amplitudes Dand a subset size D=10 pixels (a), D=16 pixels (a), D=22 pixels (a), D=32 pixels (a).
To test the influence of the subset size, the 28 previous images have been used with 4 subset size D 10, 16, 22 and 32 pixels. The graphs of Figures 9 and 10 representing the RMS (U) and the ratio RMS(U)/D2UMax,xx as a function of period p, reveal an influence of the subset size on the
displacement errors. We find the different regimes described above with a increasing divergence of the curves of the RMS(U)/D2UMax,xx for low strain amplitudes D. The asymptote is reached only for
large subset sizes.
4 Conclusion
By creating well controlled synthetic images, we are able to estimate errors related to Image Stereo-correlation technique applied to measurements of displacements. With deformed images obtained assuming only a unidirectional sinusoidal displacement with different values for the amplitude and the period, we checked relationship between parameters associated with the displacement (amplitude and gradient) for the stereo-correlation.
References
1. Peters W., and Ranson W., Digital imaging techniques in experimental stress analysis, Opt. Eng., 21(3):427-431 (1982).
2. Sutton M., Wolters W., Peters W., and McNiell S., Determination of displacements using an improved digital correlation method, Image and Vision Computing, 1:133-139 (1983).
3. Wattrisse B., Chrysochoos A., Muracciole J.M., and Nemoz-Gaillard, M., Analysis of strain localization during tensile tests by digital image correlation, Experimental Mechanics, 41(1): 29-39 (2001).
4. Bornert M., Brémand F., Doumalin P., Dupré J.C., Fazzini M., Grédiac M., Hild F., Mistou S., Molimard J., Orteu J.J., Robert L., Surrel Y., Vacher P., Wattrisse B., Assessment of measurement errors in local displacements by Digital Image Correlation: methodology and results, Experimental Mechanics, 49, 353-370 (2009).
5. Aramis® software. GOM-Gesellschaft für Optische Messtechnik mbH, Optical Measuring Techniques, http://www.gom.com/EN/index.html.
6. Fazzini M., Développement de méthodes d’intégration des mesures de champs, Thèse de doctorat, INP Toulouse, ENI Tarbes (2009)
7. Lecompte D., Smits A., Bossuyt S., Sol H., Vantomme J., Hemelrijck D.V. and Habraken A. Quality assessment of speckle patterns for digital image correlation, Optics and Lasers in Engineering, 44, 1132 – 1145 (2006).
8. Yaofeng S. and Pang J.H. Study of optimal subset size in digital image correlation of speckle pattern images, Optics and Lasers in Engineering, 45, 967 – 974 (2007).
9. Lava P., Cooreman S., Coppieters S., De Strycker M. and Debruyne D., Assessment of measuring errors in DIC using deformation fields generated by plastic FEA, Optics and Lasers in Engineering47 (7-8), pp. 747-753 (2009).
10. Schreier H. and Sutton M. Systematic errors in digital image correlation due to undermatched subset shape functions, Experimental Mechanics, 42, 303-310 (2002).