Title: Loss of total phenol in two shrub leaf litter species: the dual role
of alpine forest gap disturbance
Wei He2, Wanqin Yang1*
1School of Life Science, Taizhou University, Taizhou 318000, Zhejiang Province, China.
2College of Horticulture and Forestry Sciences/Hubei Engineering Technology Research
Center for Forestry Information, Huazhong Agricultural University, Wuhan 430070, China.
Corresponding author (*): W. Yang (E-mail address: scyangwq@163.com), Tel.: 86-0576-88660339; fax: 86-0576-88660339.
Postal address: School of Life Science, Taizhou University. No. 1139 Shifu avenue, Jiaojiang District, Taizhou 318000, Zhejiang, China
Abstract
Alpine forest gaps can distribute snowfall, solar radiation and rainfall, thus inducing a
heterogeneous hydrothermal microenvironment between the inside and outside areas of forest
gaps. Additionally, the characteristics of the heterogeneous microenvironment could vary
greatly across the gap location properties during winter and the growing season. To determine
the response of total phenol loss (TPL) from the litter to alpine forest gap disturbance during
decomposition, we conducted a field litterbag experiment within a representative fir (Abies faxoniana Rehd.) forest based on the gap location properties. The TPL and abundances of fungi and bacteria from two typical shrub species (willow, Salix paraplesia Schneid., and bamboo, Fargesia nitida (Mitford) Keng f.) were measured during the following periods over two years: snow formation (SF), snow cover (SC) snow melting (ST), the early growing
season (EG) and the later growing season (LG). At the end of the study, we found that the
snow cover depth, frequencies of the freeze-thaw cycle and the fungal copy g-1 to bacterial
copy g-1 ratio had significant effects on the litter TPL. The abundances of fungi and bacteria
decreased from the gap center to the closed canopy during the two SF, SC, ST and LG
periods and reversed during the two EG periods. The TPL closely followed the same trend as
the microbial abundance during the first year of incubation. In addition, both species had
larger TPLs in the gap center during the first winter, first year and entire two years. These
findings suggest that alpine forest gap formation accelerates litter TPL and plays a dual role
during specific critical periods by distributing abiotic and biotic factors directly and indirectly.
In conclusion, reduced snow cover depth and duration during winter warming under current
1. Introduction
Widespread tree mortality resulting from global environmental change, frequent geological
disasters and artificial interferences is accelerating forest gap formation [1-2]. Generally,
more gaps could favor the growth of understory plants and increase their litter production,
implying that the litter decomposition of understory plants will become increasingly
important in bioelement cycles and site fertility maintenance in forest ecosystems [3].
Polyphenols are well known as plant secondary metabolites that are widely distributed in leaf
litter substrates, and these substances can influence the fate of litter decomposition [4]. Little
information, however, has been available regarding how gap formation manipulates the
temporal dynamics of total phenol in decomposing leaf litter in alpine forest ecosystems[5].
Theoretically, the polyphenols in litter can be rapidly lost by eluviation after litter fall [6]. In
most alpine forest ecosystems, however, following the concentration of freshly senesced leaf
litterfall, the coming season is winter, which is accompanied by snow cover accumulation [7].
Previous relevant studies revealed that the release of matter, such as condensed tannins [5],
lignin [8] and cellulose [3], can be accelerated during the whole winter. We acknowledge that
the snow melt period may promote the loss of polyphenols via leaching. However, before
snow melt, how the polyphenols in senesced leaf litter are affected during periods of snow
formation and coverage remains unknown. Previous studies indicated that the process of litter
decomposition during winter is not stagnant due to the relatively higher biotic activities
beneath the snow cover, as the insulation provided by snow maintains a sufficiently warm
temperature[7,9-10]. However, whether some realistic relationship exists between the loss of
across gap location properties (from the gap center to the closed canopy) could differ greatly
during each critical period of winter (such as the snow formation, snow cover and snow
melting periods) as a result of sheltering by the canopy [3,8]. These characteristics, with
varied frequencies of freeze-thaw cycles (FFTCs), temperature and microbes, could have
profound repercussions for the loss process of polyphenols in senesced leaf litter. To date, the
available information is scarce and cannot be generalized.
In addition, as decomposition proceeds during the growing season, alpine forest ecosystems
could experience relatively higher solar radiation levels. As a result of sheltering, the
hydrothermal dynamics would differ between the inside and outside of a forest gap, which
would significantly regulate the litter decomposition process[11-12]. Furthermore, the crown
canopy can control transpiration and intercept rainfall, which may directly and indirectly
influence leaching characteristics and microbial activity in situ [13-14]. As mentioned above, the fate of polyphenol loss in leaf litter can vary in the growing season from the gap center to
the closed canopy. In addition, the current consensus also suggests that polyphenols
participate in the formation of recalcitrant complexes through protein and cellulose
precipitation, fungal toxicity gradation and oxidative condensation, all of which slow the
litter decomposition process [5,15]. Accordingly, the concentration of polyphenols in litter
and its dynamics, which are associated with litter decomposition and regulated by forest gap
formation, can, in turn, influence litter decomposition and the associated polyphenol loss
[16-17]. After reviewing relevant previous studies, we know that the mechanisms affecting
litter decomposition can differ between winter and the growing season in high-latitude and
location properties following different levels of physical destruction (effects of FFTCs) and
biotic decomposition during winter, the consensus on polyphenol loss during the growing
season is complicated and unpredictable, which precludes generalizations.
The alpine forest located in the upper reaches of the Yangtze River and on the eastern Tibetan
Plateau plays important roles in conserving headwaters and soils, nursing biodiversity and
indicating climate change [3]. Based on our previous investigation, there is a visible gradient
of snow cover depth among the forest gap location properties (deep snow cover in the gap
center and relatively shallow cover under the closed canopy) during winter. Moreover, the
current climate change scenarios predict that the snow cover depth and duration will decline
in some locations, thus influencing the ecological processes in winter [19-20]. Unfortunately,
increasingly well-documented evidence has revealed that this region is extremely sensitive to
global climate change [7,21]. In our previous studies [3,8,11], we found that the effects of
alpine forest gaps can accelerate litter decomposition and some matter loss during winter and
the later growing season, due to the relatively sufficient hydrothermal microenvironment in
the gap center as a result of the forest gap distribution. In contrast, the sufficient
hydrothermal microenvironments along the expanded edge and in the closed canopy during
the early growing season showed the slowed effects of forest gaps on matter loss. Therefore,
we hypothesized that alpine forest gap formation also plays two roles in litter polyphenol loss
during these critical decomposing periods.
To test the hypotheses, we conducted a field litterbag experiment and measured the total
bamboo, Fargesia nitida (Mitford) Keng f.) in five gap locations (the gap center south, the gap center north, the canopy edge, the expanded edge and the closed canopy). Throughout the
two-year study, we focused on the 1) differences in the characteristics of total phenol loss and
the associated bacterial and fungal abundances among the species, the gap location properties
and specific incubation periods. Furthermore, we 2) determined how the degree of the
investigated microenvironment, which is regulated by forest gaps, influenced the total phenol
loss in the litter.
2. Materials and methods
2.1 Description of the study site
We conducted a field litterbag experiment in the Miyaluo Nature Reserve (102°53′–102°57′
E, 31°14′–31°19′ N, 2458–4619 m a.s.l.), which is located in Li County, Sichuan,
southwestern China; the region is a transitional area between the Tibetan Plateau and the
Sichuan Basin. The annual mean temperature ranges from 2 to 4 °C, with maximum and
minimum temperatures of 23 and −18 °C, respectively. The annual precipitation is
approximately 850 mm. The seasonal soil freeze-thaw period begins in early November after
the first snowfall, and the soil remains frozen for 5 to 6 months. The tree canopy is dominated
by Sabina saltuaria and Abies faxoniana. The understory shrubs are dominated by Fargesia nitida, Salix paraplesia, Berberis sargentiana, Rhododendron lapponicum, Rosa sweginzowii,
Sorbus rufopilosa and other species. The herb layer is dominated by Cystopteris montana,
2.2 Design of experiment
The technique of retrieving litterbags over time was used to assess the leaf litter total phenol
loss and the associated abundances of bacteria and fungi in three selected gaps (with similar
canopy densities). Each gap measured 25 m (the circle diameter of the gaps) and was located
within a representative fir (Abies faxoniana Rehd.) forest (102°54.72′ E, 31°15.88′ N; 3582 m a.s.l.) in the nature reserve. Five positions, measuring 4 × 4 m and at intervals of 3–4 m (to
ensure adequate heterogeneous microenvironmental conditions for sampling), were
distributed from the gap center to the closed canopy within each gap (the gap center south,
the gap center north, the canopy edge, the expanded edge and the closed canopy; adequate
details of the study plots can be found in He et al. [3,8].
Leaf litters of freshly senesced willow (Salix paraplesia) and bamboo (Fargesia nitida) were collected from the sampled forest floor in September 2010. After air-drying for at least two
weeks at room temperature, the collected leaf litters were placed in nylon bags (20 × 20 cm,
with a 0.055 mm mesh on the bottom and a 1.0 mm mesh on the surface) according to the
class of species. When the initial litterbags were prepared, five samples of each species were
oven-dried at 65 °C for 48 h to determine the moisture content. The moisture content was
used to convert the initial air-dried mass of the litter type to its oven-dried mass. Accordingly,
the mass of the air-dried leaf litter was equivalent to 10 g of oven-dried litter for each
litterbag. In total, 1500 litterbags (3 gaps×5 positions×2 species×10 sampling dates×5
replicates) were prepared and placed on the forest floor from the gap center to the closed
chemical compositions of the two leaf litter types [23] (Table 1).
To assess the total phenol loss process and the associated temporal dynamics of the bacterial
and fungal abundances, we sampled the litterbags 10 times over 2 years. The 10 sampling
dates covered the critical periods of snow formation, coverage and thawing during winter and
the high and low solar radiation levels during the growing period for each year (Table 2). The
snow thickness was measured with a ruler on each sampling day due to the harsh weather
conditions and the lack of an efficient real-time measurement method (Table 3). Fortunately,
we placed temperature recorders (iButton DS1923-F5, Maxim/Dallas Semiconductor,
Sunnyvale, USA) in the investigated gap locations and recorded the temperature every 2 h.
2.3 DNA extraction and q-PCR quantification
Fresh retrieved litter (0.3 g dry weight) was used for DNA extraction using a DNAout kit
(Tiandz, Beijing, China). Then, the extracted DNA was purified via agarose electrophoresis
using an E.Z.N.A. Gel Extraction kit (Omega Bio-Tek, Norcross, Georgia, USA). These steps
can be found in our previous study by Zhao et al. [24]. Additionally, we used purified leaf
litter sample DNA as a template, which was amplified by PCR using the following primer
and conditions (Table 4). The quantifications of fungi and bacteria were conducted in a
CFX96TM Real-Time system (Bio-Rad), and the product specificity was confirmed using a
melting curve analysis (65-95 °C and 0.5 °C per read with a hold time of 5 s).
2.4 Measurement of total phenol
The total phenol content was determined with Folin–Ciocalteu’s colorimetry with some
transferred to a 15 ml glass tube and suspended in a 70 % acetone solution (the ratio of
acetone to water was 7:3). The tubes were placed in an ultrasonic water bath pot for 40 min
(the temperature, time and power were set to 30 °C , 40 min and 100, respectively). Then, the
mixed solution was transferred to a 10 ml centrifuge tube and centrifuged for 10 min (the
temperature and rotation speed were set at 4 ℃ and 5000 r/min, respectively). After adding
9.5 ml of distilled water and 0.5 ml of Folin–Ciocalteu (the Folin–Ciocalteu was diluted with
distilled water at a ratio of 1:1), 0.5 ml of the centrifuged solution was transferred to a 25 ml
glass tube, and the mixed solution was shaken well. Following the addition of 2.5 ml of
Na2CO3 (100 g/L), the mixture was shaken well again and placed in a dark environment for
40 min. Finally, colorimetry was performed at a wavelength of 725 nm.
2.5 Calculations and statistical analyses
To characterize the differences in the abiotic factors among the gap locations in each
sampling period (defined as the time from the previous sampling date to the current sampling
date), we calculated the average temperature (AT) and FFTC based on the daily mean
temperature and number of freeze-thaw cycles during specific periods (Table 3). One
freeze-thaw cycle was defined as the time period when the temperature dropped below 0 °C
for at least 3 h and was followed by an increase above 0 °C for at least 3 h and vice versa [25].
Each free-thaw cycle was recorded.
The loss of total phenol (R) during each incubation period was calculated as follows:
where C(t-1) and Ct represent the content of total phenol on the previous and current sampling dates, respectively, and Ct0 is the initial content of total phenol.
After the pairwise comparisons tests made upon the MANOVA, the responses of the
variables (total phenol concentration and the loss, and thefungal copy g-1 to the bacterial
copy g-1 ratio) across the gap positions to decomposition time were evaluated with
exponential regression or nonparametric LOESS (locally weighted scatterplot smoothing)
regression with 95 % confidence intervals (95 % CIs). Detailed post hoc mean comparisons
of significant differences in the litter variables (total phenol loss and log numbers of fungal
18S rDNA gene copies and bacterial 16S rDNA gene copies) among gap locations were
performed using Tukey’s honestly significant difference (HSD) test after the general
ANOVA hypothesis was verified. A structural equation model (SEM) was constructed to
determine how the total phenol loss was driven by the investigated abiotic and biotic factors
in the current study. The Jöreskog’s goodness-of-fit index (GFI), root mean square error of
approximation (RMSEA), and Bollen-Stine bootstrap test (high P values indicate that the data fit the model well) were used to test the fit of the data to the model [26]. Models with a
GFI value greater than 0.9, an RMSEA value less than 0.08 and a P value greater than 0.05 were chosen. To satisfy the assumptions of normality and homogeneity of variance, the
abundance data were log (x+1) transformed, and both the abiotic and biotic factor data were
standardized with 0-1 normalization prior to the statistical analyses. All analyses were
conducted in the Statistical Product and Service Solutions program (SPSS 21.0 for Windows;
SPSS Inc., Chicago, IL, USA) and R (R Development Core Team, 2015,
3. Results
3.1 Concentration of total phenol
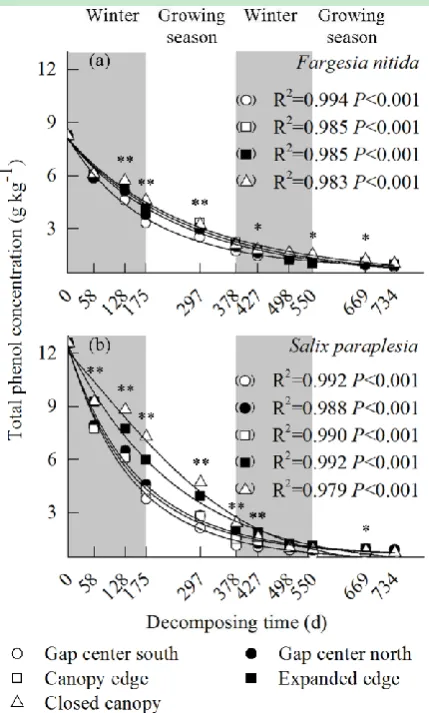
The concentration of total phenol showed an exponential decreasing tendency with
incubation time, regardless of the gap locations and species (Fig. 1). Among the gap locations,
the total phenol concentration was always lower in the gap center than in the expanded edge
and the closed canopy during decomposition. Comparing the two species, the total phenol
concentration was larger in the willow litter than in the bamboo litter during the winter of the
first year (until 128 days of exposure).
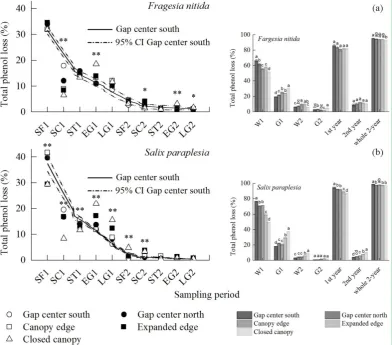
3.2 Loss of total phenol
The total phenol loss showed a decreasing trend from the gap center to the closed canopy
during thesnow formation (SF) 1, snow cover (SC) 1, snow melting (ST) 1, the later growing
season (LG) 1 and ST2 periods, while this tendency was reversed during the SF2, SC2, early
growing season (EG) 1, EG2 and LG2 periods (Fig. 2), regardless of species. Comparing the
ten specific periods, relatively higher total phenol loss was indicated for both species in the
periods of the first year, especially in the SF1 period of the first winter. There was also an
obvious decreasing tendency in total phenol loss from the gap center to the closed canopy for
both species during the W1 period in the first year and whole the 2 year. In contrast, an
increasing trend in total phenol loss was found in the two growing seasons (G1 and G2) from
the gap center to the closed canopy for both species.
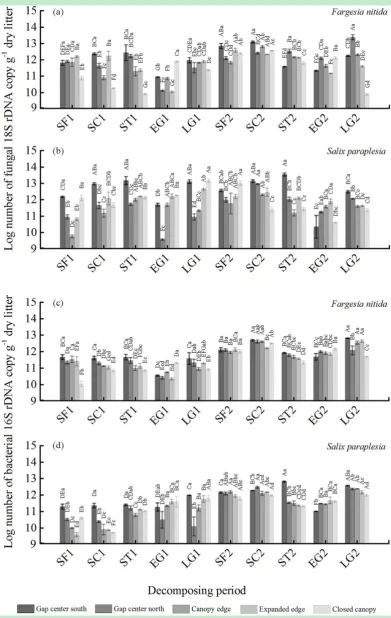
3.3 Fungal and bacterial quantifications and their ratio
both species showed a decreasing tendency from the gap center to the closed canopy during
the two SF, SC, ST and LG periods. The reverse tendency was shown for the gap location
properties during the periods of the two EG periods, although the results varied greatly
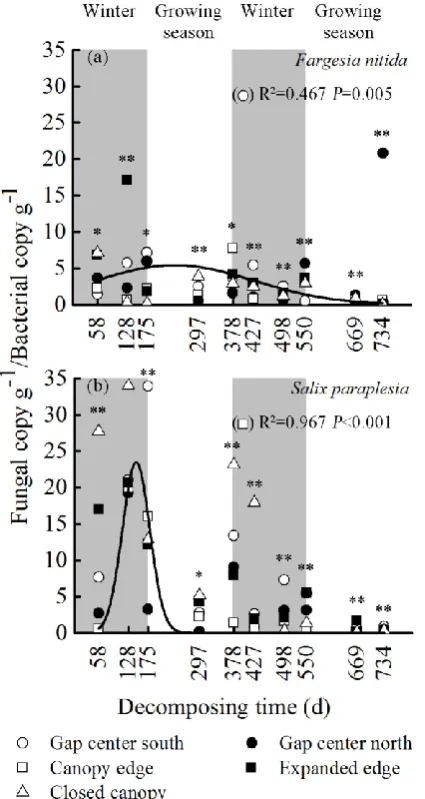
among the gap locations and decomposition periods (Fig. 3). The fungal copy g-1 to bacterial
copy g-1 ratio followed a similar trend as the total phenol loss among the gap location
properties during the ten periods (with the exception of two periods, SF1 and SC1) (Fig. 4).
In addition, relatively larger values of the ratio among the species and gap location properties
occurred in the three periods (SF1, SC1 and ST1) of the first winter.
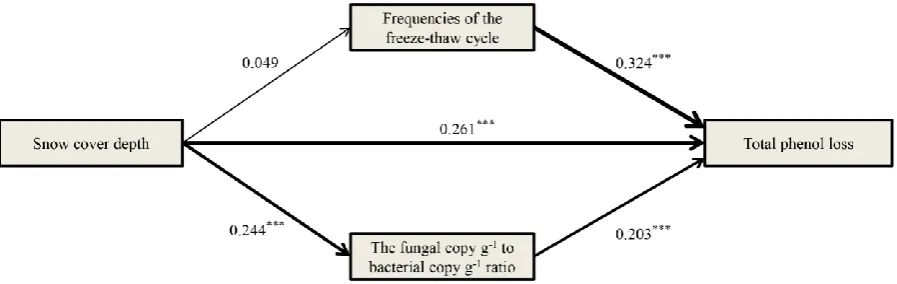
3.4 Effects of the abiotic and biotic factors on the total phenol loss
Path analysis revealed that three factors (snow cover depth, FFTC and fungal copy g-1 to
bacterial copy g-1 ratio) out of the investigated abiotic and biotic factors significantly affected
the total phenol loss (Fig. 5). In addition, the snow cover depth directly regulated the FFTC
and the fungal copy g-1 to bacterial copy g-1 ratio (although the relationship between snow
cover depth and FFTC was not strong), which in turn influenced the total phenol loss.
4. Discussion
Over the one-year and entire two-year decomposition periods, a lower total phenol
concentration and higher total phenol loss were exhibited for both litter species in the gap
center compared to the expanded edge and closed canopy. The results indicated that alpine
forest gap formation could accelerate the total phenol loss of plant leaf litter. In addition,
during the first year, especially the first winter, an obvious decreasing trend in the total
while there was a reverse tendency across the gap location properties during the two growing
seasons. This finding clearly suggests that the pattern of forest gap disturbance on leaf litter
phenol loss significantly differed between the winter and growing season.
4.1 Dual role of alpine forest gap disturbance on total phenol loss
Our hypothesis, i.e., that alpine forest gap formation would accelerate the total phenol loss
during the winter and the later growing season while slowing the total phenol loss during the
early growing season, was well supported by our data during the first incubation year. The
underlying mechanisms could explain the observed phenomenon. First, during the
experimental incubation time of the first winter, we found that there were obvious FFTCs
during three critical specific periods (SF1, SC1 and ST1) in the five gap locations, with the
exception of the gap center south in SC1 (Table 3). We defined one freeze-thaw cycle as the
time period when the temperature was below/above and above/below 0 ℃ for at least 3 h
according to [25]. The findings suggested that the effect of leaching on the total phenol loss
in the litter occurred in the locations where the FFCTs and snow cover were frequent during
specific periods in winter [27]. More importantly, based on our data, there was absolutely no
snow ablation in the location of the gap center south during the snow cover period (SC1),
while the total phenol loss was largest compared to those in the other four locations (Fig. 2).
As expected, during winter, there was an abundance of microbes (fungi and bacteria, Fig. 3)
beneath the gap center and the canopy edge. The snow cover depth and effects of insulation at
these locations was relatively greater than those in the other gap locations [3,11]. In addition,
the path diagrams showed that there was a strong relationship between the fungal copy g-1 to
the findings that fungal degradation can influence polyphenol loss via toxicity [5,15].
Integrating the leaching role, the decreased abundances of bacteria and fungi accompanied by
the reduced snow cover depth from the gap center to the closed canopy (Fig. 3) caused the
decrease in total phenol loss across the gap location properties in winter (Fig. 2).
Second, as decomposition proceeded in the early growing season, the solar radiation level
was higher in the gap center than in the other gap locations [8]. Although the leaching effect
could be stronger in the gap center than in the other locations with crown canopies, we also
found that the total phenol loss in the leaf litters of both species was lower in the gap center
and higher in the expanded edge and closed canopy (Fig. 2). The possible mechanism behind
this finding is that long-term strong solar radiation relative to occasional precipitation caused
evaporation to be greater and the microenvironment to be unstable in the gap center, which
was unsuitable for the microbes [3]; thus, the locations in the expanded edge and closed
canopy, with relatively stable microenvironments and higher levels of microbial activities
(Fig. 3), caused the total phenol loss to be relatively greater during the early growing season.
Comparatively, as decomposition proceeded during the later growing season, the intensity of
solar radiation in the gap center decreased, and precipitation was adequate in that location,
contributing to the microbial actions [28] on the total phenol loss.
However, our hypothesis regarding the role of forest gap disturbance on total phenol loss in
litter during the second year was not well supported (only the data from the second snow
melting and early growing seasons partly supported our hypothesis, Fig. 2). After reviewing
more than 80 % of the initial levels (Fig. 2). The relatively larger proportion of total phenol
loss from the litter is consistent with the consensus that the leaching mechanism can induce
the rapid loss of polyphenols during the early period of litter decomposition [6]. After rapid
loss, the remaining polyphenols can participate in the formation of recalcitrant complexes and
combine with other litter components [29], thus influencing the decomposition process during
the later decomposition period. Regardless, the data presented in the current study
substantially indicated that the forest gaps in alpine biomes play a dual role in total phenol
loss in litter by providing shelter from snowfall, solar radiation and rainfall during critical
decomposing periods as decomposition proceeds.
4.2 Effects of species type and biotic factors on the total phenol loss
Generally, the higher the content of polyphenols in litter is, the lower the decomposition rate
in litter [30-32]. In the current study, we chose two shrub species with significant difference
in initial litter chemical compositions, and higher initial total phenol concentrations were
found in the willow litter (Table 1). However, the decomposition rate was higher in the
willow litter than in the bamboo litter during decomposition (detailed information on the
decomposition rates of the two species can be found in He et al. [3,8]). In addition, we found
that the total phenol concentration was lower in the willow litter than in the bamboo litter
after 128 days of incubation in our experiment (after the first winter). Accordingly, our
findings suggest that the role of leaching and/or the FFTC during the first winter could
significantly affect the total phenol loss in litter with relatively larger leaves and higher
Furthermore, our data also showed the dual role of forest gap disturbance on the abundances
of fungi and bacteria across the gap location properties well (Fig. 3). During the winter,
abundant fungi and bacteria in the gap center clearly substantiated the insulation of snow
cover and maintained a relatively higher level of microbial activity [33-34], contributing to
the total phenol loss. More importantly, especially in the first winter, the insulation provided
by snow combined with an abundance of soluble materials in the freshly senesced leaf litter
selected cold-tolerant microbes [35-36] and induced a higher ratio of fungal copy g-1 to
bacterial copy g-1, which might be the key mechanism for the total phenol loss from litter in
the alpine forest during winter (Fig. 5).
5. Conclusion
Our results obtained in an alpine forest of the eastern Tibetan Plateau clearly showed that
alpine forest gap disturbance significantly redistributed snowfall, solar radiation and rainfall,
thus inducing decreased snow cover depth from the gap center to the closed canopy during
winter and a heterogeneous hydrothermal microenvironment between the inside and outside
areas of the forest gap in the growing season. As a result, the dual role of forest gap
disturbance on total phenol loss from litter was indicated in the rapid total phenol loss periods
(the first year in the present study). Relatively higher levels of microbial activity and a larger
leaching role in the gap center throughout the winter accelerated the total phenol loss from
the litter. Moreover, as the solar radiation changed from intense to mild in the early and later
growing season, the forest gap promoted and slowed total phenol loss from the litter,
respectively. The response of the fungal copy g-1 to bacterial copy g-1 ratio to forest gap
litter. Furthermore, we found that in addition to the first winter, the total litter phenol loss
displayed a decreasing trend from the gap center to the closed canopy throughout the first
year and the entire two years. This result suggests that the snow cover depth (an index
accompanied by the ablation intensity in the snow melting period) and FFTC during winter
can have profound repercussions for the process of litter total phenol loss in alpine biomes.
Accordingly, in the current climate change scenarios, decreases in the snow cover depth and
duration as winters become warmer in the future would inhibit the total phenol loss process in
these biomes, which are sensitive to global climate change.
Acknowledgments
This work was supported by the National Natural Science Foundation of China (No.
31570445 and 31800518).
Author contributions: W. Q. Yang designed the study and proposed the structure of the paper, W. He performed the research and wrote the paper.
Conflicts of Interest: The authors declare no conflict of interest.
Reference
1. Hicke, J.A.; Zeppel, M.J. Climate-driven tree mortality: insights from the pi.on pine
die-off in the United States. New Phytol. 2013, 200, 301-303.
2. Anderegg, W.R.L.; Hicke, J.A.; Fisher, R.A.; Allen, C.D.; Aukema, J.; Bentz, B.; Hood,
J.D.; Stephenson, N.L.; Tague, C.; Zeppel, M. Tree mortality from drought, insects, and
their interactions in a changing climate. New Phytol. 2015, 208, 674-683.
3. He, W.; Wu, F.Z.; Zhang, D.J.; Yang, W.Q.; Tan, B.; Zhao, Y.Y.; Wu, Q.Q. The effects of
forest gaps on cellulose degradation in the foliar litter of two shrub species in an alpine fir
forest. Plant Soil 2015, 393, 109-122.
4. Kraus, T.E.C.; Dahlgren, R.A.; Zasoski, R.J. Tannins in nutrient dynamics of forest
ecosystems - a review. Plant Soil 2003, 256, 41-66.
5. Li, H.; Wu, F.Z.; Yang, W.Q.; Xu, L.Y.; Ni, X.Y.; He, J.; Tan, B.; Hu, Y.; Justin, M.F. The
losses of condensed tannins in six foliar litters vary with gap position and season in an
alpine forest. iForest 2016, 9, 910-918.
6. Zhou, H.C.; Tam, N.F.Y.; Lin, Y.M.; Wei, S.D.; Li, Y.Y. Changes of condensed tannins
during decomposition of leaves of Kandelia obovata in a subtropical mangrove swamp in
China. Soil Biol. Biochem. 2012, 44, 113-121.
7. Tan, B.; Wu, F.Z.; Yang, W.Q.; He, X.H. Snow removal alters soil microbial biomass and
enzyme activity in a Tibetan alpine forest. Appl. Soil Ecol. 2014, 76, 34-41.
8. He, W.; Wu, F.Z.; Yang, W.Q.; Tan, B.; Zhao, Y.Y.; Wu, Q.Q.; He, M. Lignin degradation
in foliar litter of two shrub species from the gap center to the closed canopy in an alpine
fir forest. Ecosystems 2016, 19, 115-128.
9. Wu, Q.Q. Effects of snow depth on acid-unhydrolyzable residue and acid-hydrolyzable
carbohydrates degradation rates during foliar litter decomposition of Pinus koraiensis and
Quercus mongolica. Plant Soil 2018, 428, 389-400.
during the freeze-thaw season. Acta Oecol. 2010, 36, 135-140.
11.He, W.; Wu, F.Z.; Yang, W.Q.; Zhang, D.J.; Xu, Z.F.; Tan, B.; Zhao, Y.Y.; Justine, M.F.
Gap locations influence the release of carbon, nitrogen and phosphorus in two shrub foliar
litter in an alpine fir forest.Sci. Rep-UK. 2016, doi: 10.1038/srep22014.
12.Zhang, Q.S.; Zak, J.C. Potential physiological activities of fungi and bacteria in relation
to plant litter decomposition along a gap size gradient in a natural subtropical forest.
Microb. Ecol. 1998, 35, 172-179.
13.Zhang, Q.S.; Liang, Y.W. Effects of gap size on nutrient release from plant litter
decomposition in a natural forest ecosystem. Can. J. For. Res. 1995, 25, 1627-1638.
14.Zhang, Q.S.; Zak, J.C. Effects of gap size on litter decomposition and microbial activity
in a subtropical forest. Ecology 1995, 76, 2196-2204.
15.Hagerman, A.E.; Riedl, K.M.; Jones, G.A.; Sovik, K.N.; Ritchard, N.T.; Hartzfeld, P.W.;
Riechel, T.L. High molecular weight plant polyphenolics (tannins) as biological
antioxidants. J. Agr. Food Chem. 1998, 46, 1887-1892.
16.Yue, K.; García-Palacios, P.; Parsons, S.A.; Yang, W.Q.; Peng, Y.; Tan, B., Huang,
C.P.; Wu, F.Z. Assessing the temporal dynamics of aquatic and terrestrial litter de
composition in an alpine forest. Funct. Ecol. 2018, 32, 2464-2475.
17.García-Palacios, P.; McKie, B.G.; Handa, I.T.; Frainer, A.; Hättenschwiler, S. The
importance of litter traits and decomposers for litter decomposition: A comparison of
aquatic and terrestrial ecosystems within and across biomes. Funct. Ecol. 2016, 30,
819–829. https:// doi.org/10.1111/1365-2435.12589
Forest gaps retard carbon and nutrient release from twig litter in alpine forest ecosystems.
Eur. J. Forest Res. 2019, Doi: 10.1007/s10342-019-01229-8.
19.Wipf, S.; Stoeckli, V.; Bebi, P. Winter climate change in alpine tundra: plant responses to
changes in snow depth and snowmelt timing. Nat. Clim. Change 2009, 94, 105-121.
20.Campbell, J.L.; Socci, A.M.; Templer, P.H. Increased nitrogen leaching following soil
freezing is due to decreased root uptake in a northern hardwood forest. Glob. Chang Biol.
2014, 20, 2663-2673.
21.Zhu, J.X.; He, X.H.; Wu, F.Z.; Yang, W.Q.; Tan, B. Decomposition of Abies faxoniana
litter varies with freeze-thaw stages and altitudes in subalpine/alpine forests of southwest
China. Scand. J. For. Res. 2012, 27, 586-596.
22.Zhu, J.X.; Yang, W.Q.; He, X.H. Temporal dynamics of abiotic and biotic factors on leaf
litter of three plant species in relation to decomposition rate along a subalpine elevation
gradient. PLoS ONE 2013, 8:e62073.
23.Lu, R. Soil and agro-chemical analytical methods. China Agricultural Science and
Technology Press, Beijing, 1999, 146-195. [in Chinese, English abstract]
24.Zhao, Y.Y.; Wu, F.Z.; Yang, W.Q.; Tan, B.; He, W. Variations in bacterial communities
during foliar litter decomposition in the winter and growing seasons in an alpine forest of
the eastern Tibetan Plateau. Can. J. Microbiol. 2016, 62, 35-48.
25.Konestabo, H.S.; Michelsen, A.; Holmstrup, M. Responses of springtail and mite
populations to prolonged periods of soil freeze-thaw cycles in a sub-arctic ecosystem.
Appl. Soil Ecol. 2007, 36, 136-146.
of autotrophic microbial community along environmental gradients in grassland soils on
the Tibetan Plateau. Appl. Microbiol. Biot. 2015, 99, 8765-8776.
27.Groffman, P.M.; Driscoll, C.T.; Fahey, T.J.; Hardy, J.P.; Fitzhugh, R.D.; Tierney, G.L.
Effects of mild winter freezing on soil nitrogen and carbon dynamics in a northern
hardwood forest. Biogeochemistry, 2001, 56, 191-213.
28.Prescott, C.E. Litter decomposition: what controls it and how can we alter it to sequester
more carbon in forest soils? Biogeochemistry, 2010, 101, 133-149.
29.Haase, K.; Wantzen, K.M. Analysis and decomposition of condensed tannins in tree
leaves. Environ. Chem. Lett. 2008, 6, 71-75.
30.Berg, B.; McClaugherty, C. Plant litter. Decomposition, Humus Formation, Carbon
Sequestration, 3rd ed.; Springer: Berlin, Germany. 2014.
31.Driebe, E.M.; Whitham, T.G. Cottonwood hybridization affects tannin and nitrogen
content of leaf litter and alters decomposition. Oecologia 2000, 123, 99-107.
32.Kalburtji, K.L.; Mosjidis, J.A.; Mamolos, A.P. Litter dynamics of low and high tannin
sericea lespedeza plants under field conditions. Plant Soil 1999, 208, 271-281.
33.Saccone, P.; Morin, S.; Baptist, F.; Bonneville, J.M.; Colace, M.P.; Domine, F. The effects
of snowpack properties and plant strategies on litter decomposition during winter in
subalpine meadows. Plant soil 2013, 363, 215-229.
34.Campbell, J.L.; Mitchell, M.J.; Groffman, P.M.; Christenson, L.M.; Hardy, J.P. Winter in
northeastern North America: a critical period for ecological processes. Front. Ecol.
Environ. 2005, 3, 314-322.
Potential Applications. Environ. Technol. 2010, 31, 943-956.
36.Walker, V.K.; Palmer, G.R.; Voordouw, G. Freeze-Thaw Tolerance and Clues to the
Winter Survival of a Soil Community. Appl. Environ. Microb. 72, 1784-1792.Wipf, S.;
Stoeckli, V.; Bebi, P.; 2009. Winter climate change in alpine tundra: plant responses to
changes in snow depth and snowmelt timing. Clim. Chang 2006, 94, 105-121.
37.Gardes, M.; Bruns, T.D. ITS primers with enhanced specificity of basidiomycetes:
application to the identification of mycorrhizae and rusts. Mol. Ecol. 2008, 2, 113-118.
38.Vilgalys, R.; Hester, M. Rapid genetic identification and mapping of enzymatically
amplified ribosomal DNA from several Cryptococcus species. J. Bacteriol. 1990, 172,
4238-4246.
39.Lane, D. 16S/23S rRNA sequencing, In: Stackebrandt, A and Goodfellow, M (eds).
Nucleic Acid Techniques Systematics. John Wiley: West Sussex, UK. 1991, 115-175.
40.Muyzer, G.; Waal, E.C.D.; Uitterlinden, A.G. Profiling of complex microbial populations
by denaturing gradient gel electrophoresis analysis of polymerase chain
reaction-amplified genes coding for 16S rRNA. Appl. Environ. Microb. 1993, 59,
Table 1 Initial litter chemistry in the foliar litters of Fargesia nitida and Salix paraplesia (mean±SD, n=5). 1
Species C (g·kg–1) N (g·kg–1) P (g·kg–1) C/N Lignin (%) Total phenol (%) Lignin/N
Fargesia nitida 317.71 ± 16.60a 9.02 ± 0.12b 0.94 ± 0.07b 35.23 ± 1.38a 14.79 ± 0.62b 8.25 ± 0.20b 16.40 ± 0.47a
Salix paraplesia 371.89 ± 31.55a 14.33 ± 0.26a 1.28 ± 0.06a 25.93 ± 1.74b 21.79 ± 1.02a 12.59 ± 0.33a 15.20 ± 0.44b
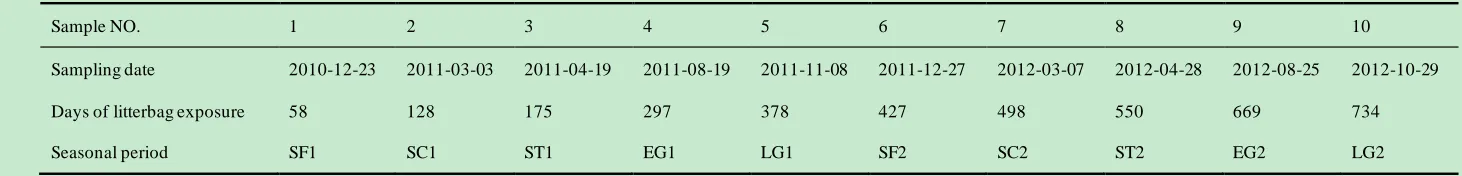
Table 2 Sampling dates, the corresponding days of litterbag exposure and the specific seasonal periods. 3
Sample NO. 1 2 3 4 5 6 7 8 9 10
Sampling date 2010-12-23 2011-03-03 2011-04-19 2011-08-19 2011-11-08 2011-12-27 2012-03-07 2012-04-28 2012-08-25 2012-10-29
Days of litterbag exposure 58 128 175 297 378 427 498 550 669 734
Seasonal period SF1 SC1 ST1 EG1 LG1 SF2 SC2 ST2 EG2 LG2
SF1, the first snow formation period; SC1, the first snow cover period; ST1, the first snow melting period; EG1, the first early growing period; LG1, the first later 4
growing period; SF2, the second snow formation period; SC2, the second snow cover period; ST2, the second snow melting period; EG2, the second early growing 5
period; and LG2, the second later growing period. 6
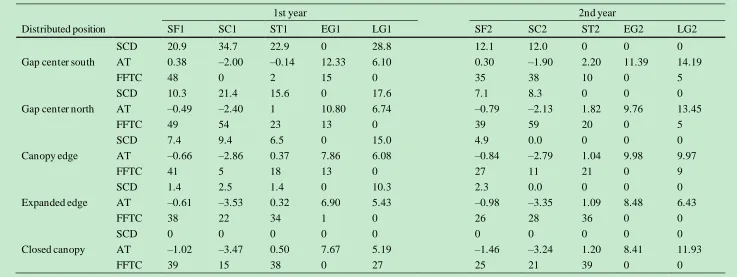
Table 3 Snow cover depth (SCD, cm), average temperature (AT, ℃) and frequency of the freeze-thaw cycle (FFTC, times) from the gap center to the closed canopy 8
in each specific period of decomposition. 9
1st year 2nd year
Distributed position SF1 SC1 ST1 EG1 LG1 SF2 SC2 ST2 EG2 LG2
SCD 20.9 34.7 22.9 0 28.8 12.1 12.0 0 0 0
Gap center south AT 0.38 –2.00 –0.14 12.33 6.10 0.30 –1.90 2.20 11.39 14.19
FFTC 48 0 2 15 0 35 38 10 0 5
SCD 10.3 21.4 15.6 0 17.6 7.1 8.3 0 0 0
Gap center north AT –0.49 –2.40 1 10.80 6.74 –0.79 –2.13 1.82 9.76 13.45
FFTC 49 54 23 13 0 39 59 20 0 5
SCD 7.4 9.4 6.5 0 15.0 4.9 0.0 0 0 0
Canopy edge AT –0.66 –2.86 0.37 7.86 6.08 –0.84 –2.79 1.04 9.98 9.97
FFTC 41 5 18 13 0 27 11 21 0 9
SCD 1.4 2.5 1.4 0 10.3 2.3 0.0 0 0 0
Expanded edge AT –0.61 –3.53 0.32 6.90 5.43 –0.98 –3.35 1.09 8.48 6.43
FFTC 38 22 34 1 0 26 28 36 0 0
SCD 0 0 0 0 0 0 0 0 0 0
Closed canopy AT –1.02 –3.47 0.50 7.67 5.19 –1.46 –3.24 1.20 8.41 11.93
FFTC 39 15 38 0 27 25 21 39 0 0
10
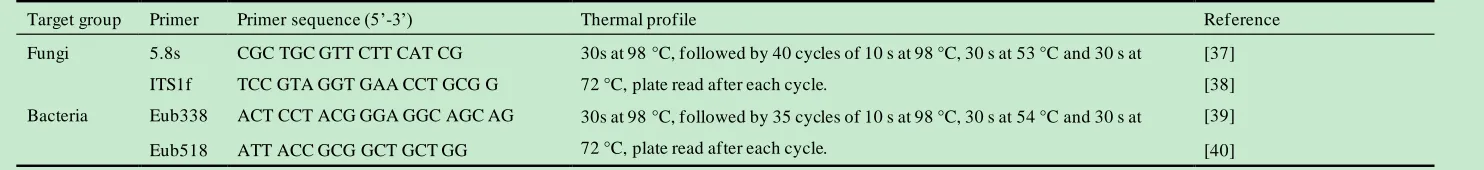
Table 4 Primer and PCR conditions used for the real-time quantitative PCR. 12
Target group Primer Primer sequence (5’-3’) Thermal profile Reference
Fungi 5.8s CGC TGC GTT CTT CAT CG 30s at 98°C, followed by 40 cycles of 10 s at 98°C, 30 s at 53°C and 30 s at 72°C, plate read after each cycle.
[37]
ITS1f TCC GTA GGT GAA CCT GCG G [38]
Bacteria Eub338 ACT CCT ACG GGA GGC AGC AG 30s at 98°C, followed by 35 cycles of 10 s at 98°C, 30 s at 54°C and 30 s at 72°C, plate read after each cycle.
[39]
Fig. 1 Exponential regressions of the total phenol concentrations in the foliar litters of Fargesia nitida and
Fig. 2 Total phenol loss (mean ± 95% confidence intervals or mean ± SD, n=3) in the Fargesia nitida and
Fig. 4 Exponential regression of the fungal copy g-1 to bacterial copy g-1 ratio in the foliar litters of
Fargesia nitida and Salix paraplesia to the decomposition time from the gap center to the closed canopy
Fig. 5 Path diagram showing the direct and indirect effects of snow cover depth, frequencies of the freeze-thaw cycle and the fungal copy g-1 to bacterial copy g-1 ratio on the total phenol loss. The line