VISUALIZATION OF WATER FLOW DURING FILTRATION USING
FLAT FILTRATION MATERIALS
Petr BÍLEKx,Petr ŠIDLOFx,Jakub H5ģ=$x
Abstract:
1. I
NTRODUCTIONFiltration materials are very important elements of some industrial appliances. Water filtration is a separation of solid materials from fluid. Solid particles are captured on the frontal area of the filtration textile and only liquid passes through it. It is important to know the filtration process in a detailed way to be able to develop filtration materials. Visualization of filtration process enables a better view of the filtration. This method also enables to determine efficiency and homogeneity of filtration using image analysis. For this purpose, a new water-filtration measuring setup was proposed and constructed. Filtration material is mounted into the optically transparent place in the setup. Laser sheet is directed into this place as in the case of Particle Image Velocimetry measuring method. Monochrome and sensitive camera records the light scattered by seeding particles in water. The seeding particles passing through the filter serve for measuring filtration efficiency, and also for visualization of filtration process. Filtration setup enables to measure also the pressure drop and a flow. The signals are processed by National Instruments compactDAQ system and UMA software. Microfibrous and nanofibrous filtration materials are tested by this measuring method. In the case of nanofibrous filtration, appropriate size of seeding particles is needed to be used to perform a process of filtration.
Nonwoven filtration textile is made from particular fibres arranged one over another. A surface filtration is used in case of water filtration. Size of the pores is critical in network mechanism of filtration. Efficiency of filtration does not depend on the thickness of the filter. Water filtration is separation of solid materials from fluid. Solid particles that are larger than pores are captured on the frontal area of the filtration textile. Captured particles become a part of filtration material, and its filtration efficiency increases in time. [1] It is important to know process of filtration in detailed way to be able to develop new nanofibrous filtration materials. Visualization of the filtration process enables a better view of the filtration. This method also enables to determine filtration efficiency and homogeneity of the filter using image analysis. For this purpose a new water-filtration measuring setup was proposed and constructed.
aTUL, Halkova 917/6, 460 01 Liberec 1, Czech Republic, [email protected]
bTUL, Halkova 917/6, 460 01 Liberec 1, Czech Republic, [email protected]
cTUL, Halkova 917/6, 460 01 Liberec 1, Czech Republic, [email protected]
Standard optical methods for measuring filtration efficiency detect the efficiency only in one point. Filter homogeneity is investigated by optical microscope. These methods are time-consuming. Our optical method enables to measure filtration features in a plane at the same time without additional measurements. A filtration textile can be measured in whole volume by movement of the plane.
Nanofibrous filtration materials intended for cleaning waste water has to remove bacteria reliably. The smallest bacteria reach the size below 1 fibrous textiles should be tested by artificial particles, which size is below 1. These small particles are not displayed as points, but they merge in a cloud. In this case the efficiency can be calculated only from intensity of scattered light.
2. F
LOW VISUALIZATION AND MEASURING OF FILTRATION EFFICIENCYThis optical method is the same in hardware arrangement as a Particle Image Velocimetry (PIV). The principle of PIV optical method is to illuminate a particle seeded flow with a laser sheet. The image is captured by CCD camera. Two pictures with a time shift are autocorrelatized and a map of velocity vectors is calculated. [3] The first difference between our method and PIV is taking only single pictures instead of double
pictures. No need for double-pulse laser generator, continuous can be used.
Figure 1: Illustration of PIV hardware arrangement
Filtration material is mounted into the optically transparent place in the setup. Laser sheet is directed into this place. A camera scans light scattered by small particles. The seeding particles passing through the filter serve for measuring filtration efficiency, and also for visualization of filtration process.
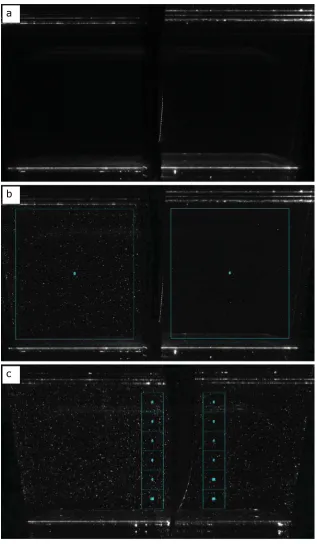
The optical methods also differ in software processing. In our case single pictures (Figure 2a) are software analyzed. Number of particles is obtained in chosen areas in case of bigger seed particles. Average value of light intensity is obtained in chosen areas in the pictures in anyhow (Figure 2b). Other information can be homogeneity of filtration efficiency (Figure 2d).
Figure 2: a) Microfibrous textile without seed particles (reference picture), b) filtration textile with seed particles (silver coated hollow glass spheres (S-HGS) 10NjP in diameter) and chosen evaluation areas for analyzing filtration efficiency, c) chosen evaluation areas for analyzing homogeneity of filtration efficiency
a
b
incident
x
O
SI
2
Filtration efficiency EF is calculated according to (1). Penetration of particles P is countable either from number of particles behind the filter G1 and in front of it G2 or from
the ratio of light intensity according to (2). I1 represents an average light intensity in the
area behind the filter and I2 in front of the filter. These light intensities are calculated
from the pictures with particles (Figure 2b). I1R and I2R mean an average light intensity
without particles - reference light intensity (Figure 2a).
(1)
(2)
3. L
IGHT SCATTERING BY SMALL PARTICLESIn this article, elastic light scattering scatteringincident is discussed. A parameter x[-] is
considered, where Ø[m] is diameter of particle and incident[m] is wavelength of incident
light (3).
(3)
Geometrical optics is usable for particles much larger than wavelength of incident light, x >>1. Reyleigh theory can be used for very small particles, x << 1. Electromagnetic approach is appropriate for all x (Mie theory). [4] Information about scattering is given by a ratio of the scattered intensity to the incident intensity. The ratio depends on intensity, polarization and wavelength of the incident light, diameter of the particle, distance between the particle and the detector, observing angle and ratio of refractive index. Results are often displayed as an angular scattering or phase function. If the particles are sufficiently far from each other, it is possible to study the scattering by one particle. Particles are considered homogenous and absolutely spherical. Scattering is often accompanied by absorption light by the medium.
L Ø = 10
used. The parameter is calculated: x = 118. The particles are too large to be use Reyleigh theory because particles of at least 20 times smaller size than wavelength of incident light are needed. Mie approach is more difficult, but can be used in our case. Light scattering exists everywhere around us. The blue color of the sky is caused by Rayleigh scattering, because blue spectrum of the visible light is more scattered by clusters of air molecules than the others parts of light. White color clouds are caused by Mie scattering, because light scattering on water drops is the same for whole visible spectrum of light. The Reyleigh scattering occurs on molecules and the Mie scattering occurs on aerosols.
4. E
XPERIMENTAL SETUP FOR MEASURING FILTRATION FEATURESExperimental setup is made according to scheme (Figure 3a). [2] A part of setup with filter is immersed in glass water tank to prevent light refraction. Honeycomb screen is placed to improve a velocity profile of the flowing water.
100
1
[%]
2 1¸¸¹
·
¨¨©
§
G
G
EF
2
/
2
/
]
[
2 2 1 1 2 1 R RI
I
I
I
G
G
P
|
Figure 3: a) Scheme of water-filtration setup, b) picture of water-filtration setup in laboratory
Water is pumped by submersible pump into the setup. Control of flow is realized by manual ball valves. Filtration material is mounted between two glass pipes Ø = 8 cm. Automatic air-escape valves are mounted on every elevated place in the setup. The highest pressure can be set to 100 kPa. Maximum flow rate can be set to 40 l/min. Area in vicinity of the filtration material is illuminated by laser sheet. The laser sheet is generated by a semiconductor laser diode of the power of 50 mW, and the wave length of 532 nm (green color). The image is recorded by industrial camera Pike F-210B/C.
a
Resolution of its CCD chip is 1920 x 1080 px. Lens Nikon 50 mm with aperture F1,8 is mounted on the camera. Information about flow and pressure drop is recorded by measuring cards and National Instruments CompactDAQ-9172. Signals are software filtered and process by UMA software written in NI LabView.
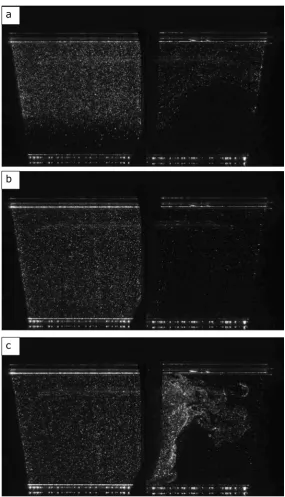
Figure 4: Microfibrous textile without honeycomb screens - deformation of velocity profile in front of the filter a) developing of a large vortex behind the filter due to deformation of velocity profile, b) developing of the whirl (+2 min), c) fast change of flow
c b a
Pictures from the camera are processed offline by ImageJ software. The pictures are PNG type with 16 bit depth in grey-scale. Recording is performed in darkened laboratory. Time of exposition is set to 15ms. Sensitivity of CCD chip is set to 600. Microfibrous material was tested by silver coated hollow glass spheres (S-HGS) particles with in diameter.
Standard measuring of filtration properties comprises of filtration efficiency, pressure drop and flow. It is also important to know the whole process of filtration. In the pictures at figure 4 we can see asymmetrical velocity profile of water in front of the filtration media. A large vortex develops behind the filtration textile due to this and image analysis is impossible in this case. Flow is without vortexes if the filter media is not mounted.
5. R
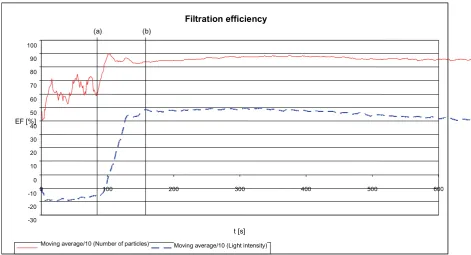
ESULTSThe following charts display the process of filtration through triple microfibrous melt-blown nonwoven textile. The water in filtration setup was seeded with Dantec S-HGS particles of size 10 and settled stable concentration 0,27mg/l.
Figure 5: Filtration efficiency depending on time, red line means filtration efficiency calculated from number of particles and blue line represents filtration efficiency calculated from light intensity according to (2)
a
Filtration efficiency
-30 -20 -10 0 10 20 30 40 50 60 70 80 90 100
0 100 200 300 400 500 600
t [s] EF [%]
Moving average/10 (Number of particles) Moving average/10 (Light intensity)
Hom ogeneity of filtration 0 10 20 30 40 50 60 70 80 90 100
0 1 2 3 4 5 6 7 8
Lenghts across the fitler [cm]
F iltr a tio n e ffi c ie n c y [% ]
Light intensity Number of particles
Flow and pressure drop on the filter
0 2 4 6 8 10 12 14 16 18 20
0 100 200 300 400 500 600
t [s] 4 >/ 30 @ǻ S>N 3D @
Moving average/10 (Pressure drop) Moving average/10 (Flow ) (a) (b)
Figure 6: The homogeneity of filtration depending on length across the filter, picture of chosen areas (on the right)
Figure 7: The pressure drop and flow depending on time, vertical line (a) represents a beginning of coming of particles on the filtration media, the second line (b) means a beginning of valid data
The filtration efficiency can be calculated easily from numbers of particles, but it is possible only in case of bigger sizes of particles. If the particles are smaller than approximately 5 micrometers, they are not shown as points, but they merge in a cloud. In this case, the efficiency can be calculated only from light intensity. Filtration efficiency calculated from number of particles and light intensity is not the same. It is caused by many factors, which influence light intensity scattered by seeding particles especially on distribution of particle sizes.
Pressure drop shown in figure 5d is increasing in time depended on time, but the filtration efficiency is not so much. A filtration cake is developing on the surface of filtration textile.
6. C
ONCLUSIONWater-filtration setup was proposed and constructed. The first measurements show that it is necessary to ensure a symmetrical velocity profile in front of the filter media. For image analysis, steady flow behind the filter is very important. The second point is formula for determine the filtration efficiency from average light intensity in a chosen area. The formula can be determined by two ways (by calibration or analytical representation). Calibration of setup can be done by measuring of light intensity depends on the concentration of particles in water. It is possible to determine right filtration efficiency by interpolation.
The filtration efficiencies in figure 5a are not same. It is cost by many factors which influence on the light intensity or number of analyzed particles. Image analysis for determine filtration efficiency from number of seeding particles does not include all particles. Less illuminated particles are not included in to the calculation number of particles but they are included to the calculation in case of light intensity. Used seeding particles are not mono dispersed and bigger particles mean more light than smaller. Particles can also make clusters. Producer of used Dantec seeding particles (10! guarantee size distribution (2 – 20)
7. A
CKNOWLEDGMENTSThis project is realized under the state subsidy of the Czech Republic within the research and development project "New Type of Filtration Materials Based on the Nanofibers Structures" - TA01010584 - ALFA Programme of Technology Agency of the Czech Republic.
8. R
EFERENCES[1] Brown R. C.: Air filtration, Sheffield, 1993. ISBN 0 08 041274 2.
[2] #$%&'*+;&?+KX+YZ\#+ Komárek, M., Kopecký V.: Nanofilter evaluation using visualization methods
[3] Kopecký V.: Laserové anemometrie, Liberec, 2006, pp. 186.
, 1st Nanocon International Conference, Rožnov pod Ra$_+ Tanger Ltd., 2009, pp. 186-190.