Volume 5, Issue 10 pp. 181-195
181
THE IMPACT OF INSTITUTIONAL QUALITY ON TAX REVENUE IN
DEVELOPING COUNTRIES
Lien, Nguyen Phuong
PhD student; Faculty of Public Finance, University of Economics, Ho Chi Minh, Vietnam, Lecturer; Faculty of Economics and Commerce, HoaSen University, Ho Chi Minh, Vietnam
Abstract
This article applies the method of difference panel GMM Arellano-Bond for a dataset of eighty two developing countries (These countries are classified into three economies basing on estimates of gross national income (GNI) per capita for the 2014 year by using the World Bank Atlas method1) during a period from 1996 to 2013 to empirically assess the impact of institutional quality (based on six World Bank governance indicators2) on government tax revenue. The results show a significantly positive impact of institutional quality on tax revenue in the whole sample, as well as in the low-income and lower-middle low-income groups while this impact is significantly negative in upper-middle income group. These results are definitely consistent and robust for all six World Bank governance indicators. The findings suggest governments in developing countries should appropriately adjust institutional quality to improve the tax revenue and promote economic activities.
Keywords: Institution, tax revenue, difference GMM, developing countries
1. INTRODUCTION
Developing countries have been facing a variety of institutional problems in terms of generating budget. Among these problems, corruption appears to be the primary reason leading to difficulties in tax management. Accordingly, corruption negatively affects government revenue while good governance contributes more positively (Ajaz & Ahmad, 2010). The amount of tax revenue is the main component of a national budget (Hakim & Bujang, 2011). However, the difference in tax revenue between high income countries and low income countries is 10% (Sttauss, 2001). Hence, institution quality is considered to be the major cause of poor tax collection in developing countries (Chand and Moene, 1997; Ghura, 1998). In addition, some studies indicate corruption causing the loss of more than 50% tax revenue in developing countries (Richupan, 1984; Alm et al., 1991; Bird, 1990 and 1992; Krugman et al., 1992). Behaviour of tax payers also depends on the institutional regulations (Torgler, 2003). In fact, institutional quality plays a crucial role in promoting economic growth. It not only promote economic growth, impacts on economic activities and the allocation of resources in the future but also is an economic success (Efendic et al., 2011).
Corresponding author's
Email address: phuongliennhl48@gmail.com
1 On 1 July 2015, low-income economies are determined as those with a GNI per capita, computed using the World Bank Atlas method, of $1,045 or less in 2014; Lower-middle-income economies are those with a GNI per capita of more than $1,045 but less than $4, 125; and upper-middle-income economies are more than $4, 125 but less than $12,736;
2 Six World Bank governance indicators: (1) Government effectiveness; (2) Control of corruption; (3)Political stability; (4) Quality of regulatory; (5) Rule of law; (6) Voice and accountability.
Asian Journal of Empirical Research
182
To find answers to the questions "How does the quality of institution impact on tax revenues in developing countries? Is there any difference in impact on each economies group as divided by World Bank?”, this study chooses to use empirical methods by applying estimation method of difference GMM panel data to study the impact of institutional quality on tax revenue with controlled variables, including domestic investment, labor force, government expenditure, inflation, infrastructure and trade openness for eighty two developing countries over the period of 1996-2013, when the economy witnessed two major crises. The financial crisis in Asian countries in 1997 started from Thailand, and then spread to affect stock markets of some countries such as Malaysia, Laos, and Taiwan. The second crisis happened when the real estate bubble burst in the United State of America in 2007, leading to the US financial crisis in 2008 to affect the production and export of a wide range of developing countries. The difference GMM helps to reduce estimation bias due to endogenous phenomenon and serial correlation that is frequently present in the macro panel data (Arellano and Bond, 1991; Ajaz & Ahmad, 2010; Nguyen, 2015). Specifically, this paper tries to:
(1) Evaluate the impact of experimental institutional quality on tax revenues for the overall sample consisting of eighty two developing countries over the period of 1996-2013;
(2) Compare this impact among three economies of group: low-income, lower-middle and upper-middle income.
The paper is structured as follows: Section one introduces the research problems. Section two briefly reviews the results of previous research on the impact of institutional quality on tax revenue. Section three presents the theoretical framework. Section four describes the research methodology and data. Section five shows the results and discussion. Finally, section six is the conclusion and policy implications.
2. LITERATURE REVIEW
Studies on impact of institution quality on tax revenue have been conducted by many empirical researchers for decades. It is also a key objective of most governments’ policy makers to develop good institutional regulations to build the optimal tax system for their economic growth.
To gain a better analysis into the direct democracy in Switzerland, where the levels of participation and democracy vary across different states, Torgler (2003) utilized two distinct data sets at individual level within a period from 1996 to 1999 (World Values Survey and International Social Survey Programme.)He argues that direct democracy, local autonomy and people’s trust in the government, court, and judicial system significantly support tax compliance.
Similarly, Bird and Martinez-Vazquez (2008) conducted a panel data regression analysis with the use of 2SLS method using data from developing countries from 1990 to 1999 and data from developed countries from 1998 to 2000. The estimated research outcomes signified that low-income countries can only improve taxation by reinforcing their institution together with the enhancement of voice and accountability as well as effective corruption management. Equivalently, high-income countries can also raise their taxation as long as they improve their institution quality.
Ajaz and Ahmad (2010) made use of difference GMM with a panel data set of 25 developing countries from 1990 to 2005 and concluded that institutional variables are significantly correlated with tax collection. In other words, corruption is reported to have a negative impact on taxation. Nonetheless, efficient public management appears to encourage tax revenue. The low taxation in developing countries, therefore, is put down to the corrupted tax administration and poor-quality public management.
183
Dioda (2012), in his empirical research over a panel data set of 32 American countries during the period from 1990 to 2009, applied difference GMM with 2 varied models: random effect model (REM) and fixed effect model (FEM). The result shows that an increase of one percent in free democracy is entitled to an increase of one point two percent of government revenue.
Torrance and Morrissey (2013) also had one empirical evaluation on the effects of GDP, agricultural proportion, industrial proportion, imports and exports rates in comparison with GDP, and institutional impacts on taxation in 36 Sub-Saharan African nations within a period from 1970 to 2010. The consequence then highlights the fact that the impact of institution on tax revenue to GDP ratio is strong and positive; however, the correlation deteriorates with the arrival of many new kinds of institutions and the economic development.
In addition, Feger (2014) argues that the current institution and policies in Sub-Sahara African countries are detrimental to the amount of direct taxation. In fact, even though the institution there is considered to be weak and inefficient, commercial tax revenue is not affected by institutional quality.
Hossain (2014) exploited method of Fixed Effect and Random Effect for 55 developing countries with the data set taken from 2002 to 2012 and confirms that there is correlation between high government and willingness to pay taxes.
Syadullah and Wibowo (2015) took advantage of descriptive statistics and cause-and-effect analysis using an ASEAN countries panel data set from 2003 to 2012. They also come up with a similar result showing that the controls of corruption, voice and accountability, and political stability have a significantly negative impact on tax ratio, while rule of law and the regulatory quality positively impact on tax ratio in these countries.
3. THEORETICAL FRAMEWORK
The theoretical framework is based on arguments of Syadullah and Wibowo (2015) which indicates the influential mechanism of institutional quality on tax revenue.
First, it is the theory of political legitimacy. People’s trust or belief level on government will determine tax compliance (Tayler, 2006; Kirchler et al., 2008). So, governments, institutions, and social arrangements should ensure that their political legitimacy has to be appropriate, accurate, fair, and beneficial for all citizens.
Second, Bird et al. (2004) find corruption, role of law, and regulations important determinants of tax revenue. Meanwhile, Gupta (2007) shows the significantly negative impact of corruption on tax revenue performance. It also shows that good institution quality may increase revenue performance. Third, public tax revenue depends on government efficiency. Also, good governance positively influences the tax collection system and increases tax revenue. Benno (2003) noted that democracy, autonomy, trust in government, and the legal system have a significant positive impact on tax morale.
Similarly, Torgler (2003) shed a new light on the perspective that a direct democracy, its local autonomy, and people’s trust in judicial system supportively influence tax compliance’s motives.
4. METHODOLOGY AND DATA
4.1. Methodology
184
∆𝑇𝐴𝑅𝐸𝑖𝑡= 𝛼𝑖𝑡+ 𝛽1𝑇𝐴𝑅𝐸𝑖𝑡−1+ 𝛽2𝐼𝑁𝑆𝑖𝑡+ 𝑋𝑖𝑡𝛽3′ + 𝜂𝑖+ 𝜉𝑖𝑡 ……… (1)
In which, 𝑇𝐴𝑅𝐸𝑖𝑡 is tax revenue-to-GDP ratio; 𝐼𝑁𝑆𝑖𝑡 denotes the quality of institution which is measured by sixWorld Bank governance indicators; 𝑋𝑖𝑡stands for vectors of controlled variables in models; ηi is an unobservable error (time-invariant, country-specific effect); 𝜉𝑖𝑡 is an observation-specific error term.
In the equation (1), ΔTARE = TAREit – TAREit-1is the first difference of TARE, representing the growth rate of tax revenue; TAREit-1on the right side is the initial level of tax revenue. This study employs difference panel GMM which was originally suggested by Griliches and Hausman (1986) and then developed by Arellano and Bond (1991). This methodology utilizes the lags of instrumented variables and transforms them into instruments. Hence, it enables us to use an appropriate lagged structure to investigate the dynamic feature of panel data. The dynamic feature shown in the equation (1) reveals some fixed effects due to country-specific feature which are positively related to independent variables (lagged variables of taxation) and some explanatory variables, convincingly providing an evidence for the endogenous phenomenon of the model. The endogenous phenomenon results from the correlation of some controlled variables with random errors of the equation. Furthermore, the existence of this correlation is uncertain because the lagged appearance of taxation variable cannot be found, which can cause the inconsistency towards pooled OLS method and wrong estimation (Griliches & Hausman, 1986; Barro, 1990; 1991; Arellano, 1991, 2003).
The main issue in the equation (1) is that the dependent variable (tax revenue) and its lag correlate with country-specific effects. Torgler and Schneider (2009) shows that the tax revenue is an endogenous variable. Accordingly, difference panel GMM with lagged endogenous variables is selected to give solutions to these problems. Ahmed (2012) also argues that using GMM and instruments help to reduce the errors in panel data forecast. The further details about the procedure are presented in Griliches and Hausman (1986); Arellano and Bond (1991), and Roodman (2009).
4.2. Data
This study uses an unbalanced panel data set, which is allowed for difference panel GMM. Also, with unbalanced data set bias may occur when the number of samples is small (Bruno, 2005). Research dataset was extracted from the annual data of the World Bank (World Development Indicators) (Kaufmann et al., 2010) and the International Monetary Fund (World Economic Outlook) (Nguyen, 2015) in the period 1996 to 2013 for 82 developing countries (large sample) as following.
4.2.1. Low-income countries (GNI is under US$1,045 in 2014)
There are 18 countries: Burundi, Burkina Faso, Cambodia, Central African Republic, Chad, Comoros, Congo Dem. Rep., Ethiopia, Guinea-Bissau, Haiti, Madagascar, Mozambique, Nepal, Niger, Rwanda, Tanzania, Togo, and Uganda. The majority of preceding countries come from Africa (15 countries) whilst there are only two Asian countries and an American nation.
4.2.2. Lower-middle income countries (GNI ranges from US$1,045 to under US$4,125)
Bangladesh, Bhutan, Bolivia, Cabo Verde, Cameroon, Congo Rep., Côte d'Ivoire, Djibouti, Egypt Arab Rep., El Sanvador, Georgia, Ghana, Guatemala, Guyana, Honduras, India, Indonesia, Kenya, Kyrgyz Republic, Lesotho, Moldova, Morocco, Nicaragua, Nigeria, Pakistan, Philippines, Sri Lanka, Tajikistan, Tanzania, Ukraine, Vietnam, and Zambia. (32 countries).
185 The following variables are to present the details
- TAREit: General Government Revenue (a share of GDP (%)). This value has been utilized by many researchers in their papers such as Ajaz & Ahmad (2010); Bird & Martinez-Vazquez (2008); Dioda (2012); Torrance & Morrissey (2013).
- INSit: institution (the value calculated by 6 World Bank governance indicators) (statistics from the reports of World Bank in reference to a set of values of World Government Indicators (WGI) These variables range between -2.5 (low index) and 2.5 (high index) (Ajaz & Ahmad, 2010; Torgler et al., 2011, Alonso & Garcimartín, 2013; Law et al., 2013; Lee & Kim, 2009; Syadullah & Wibowo, 2015). The institutional values were examined every two years from 1996 to 2001. Since 2002, these examination has taken place annually; therefore, the data from 1997, 1999, and 2001 in this paper was added up and divided to get the average value. The figures of preceding even year and the following even years are added up with the figures of the investigated year; then, the sum is divided in half (Torgler et al., 2011; Law et al., 2013).
1. Ins1it: Institution 1: Government effectiveness; 2. Ins2it: Institution 2: Control of corruption;
3. Ins3it: Institution 3: Political stability and absence of violence/ Terrorism; 4. Ins4it: Institution 4: Regulatory quality;
5. Ins5it: Institution 5: Rule of law;
6. Ins6it: Institution 6: Voice and accountability;
- Xit: vectors of below controlled variables.
1. RGDPit: logarithm of a real gross domestic product per capita (constant 2005 US$), proxy for the economic growth of a country. (Barro, 1991; Bird & Martinez-Vazquez, 2008; Kathavate & Mallik, 2012).
2. TINVit: National investment (Total Investment (a share of GDP (%)) (consisted of both state’s and private investment). (Tanzi & Davoodi, 1997).
3. LABFit: labor force estimated via ILO’s model (calculated by the division of the number of population in working ages ranging from 15 to 64 and the total population of a whole nation). (Temple, 1999; Haque, 2013; Flachaire et al., 2014; Gravelle & Marples, 2014). 4. GEXPit: (Government Expenditure (a share of GDP (%)) (Ghura, 1998; Rea, 2009;
Mehmood & Sadiq, 2010; Elyasi & Rahimi, 2012).
5. INFLit: Inflation (Inflation, consumer prices (annual %) (Feldstein et al., 1983; Ajaz & Ahmad, 2010; Hakim & Bujang, 2011).
6. INFRit: infrastructure to be assessed by many methods including the measurement of railway’s length (Kuzmina et al., 2014) or highway’s length over the area (Du et al., 2008). In this paper, infrastructure is determined by the fixed telephone subscription per 100 people (Bissoon, 2011; Nguyen, 2015)
7. OPENit: Economic Openness (Trade) (% GDP) (Ajaz & Ahmad, 2010; Nwosa et al., 2012; Mustaq et al., 2013; Salahodjaev, 2015).
The statistical description of all variables is presented in the following table
Table 1: Statistical description (The whole sample: 82 developing countries)
Variables Obs. Mean Std. Dev. Min Max
Real GDP per capita (rgdp)(USD per year) 1394 2030.231 1983.822 129.782 9870.486 Tax revenue (tare) (%GDP) 1394 23.858 10.258 .563 72.299 Institution 1 (ins1) (Index) 1394 -.513 .543 -1.974 1.247 Institution 2 (ins2) (Index) 1394 -.581 .475 -2.057 .869 Institution 3 (ins3) (Index) 1394 -.583 .753 -2.995 1.308 Institution 4 (ins4) (Index) 1394 -.428 .553 -2.413 .815 Institution 5 (ins5) (Index) 1394 -.621 .525 -2.205 .638 Institution 6 (ins6) (Index) 1394 -.491 .635 -1.936 1.099 Total investment (tinv)(% of GDP) 1394 23.733 9.207 3.081 68.463
Labor force (labf)(%GDP) 1394 68.476 11.272 41.9 90.8
186
Inflation (infl.) (%) 1394 10.804 29.064 -18.109 513.907 Real Infrastructure (infr.) (Fixed telephone
subscriptions per 100 people) 1394 8.654 9.207 .006 47.758 Trade openness (open) (%GDP) 1394 79.366 39.168 15.580 220.407
It can be observed from the table that there is a big gap in GDP per capita between low-income countries and upper middle-income countries. In details, the smallest real GDP per capita is US$129.783(The Ethiopia country) while the maximum GDP per capita is US$9,870.486(The Lebanon country). Also, tax revenue to GDP ratio varies from 0.563 percent (The Congo, Rep. Country) to 72.299 percent (The Libya country).In low-income group, there is the Congo Dem. Rep. country which owns most of the lowest indicators of institution quality.
Table 2: Matrix of correlation coefficients (The whole sample: 82 developing countries)
tare ins1 rgdp Tinv labf Gexp Infl infr Open
tare 1.000
ins1 0.064 1.000
rgdp 0.350 0.502 1.000
tinv 0.221 0.29 0.197 1.000
labf -0.320 -0.18 -0.533 -0.070 1.000
gexp 0.881 0.189 0.339 0.230 -0.356 1.000
infl 0.017 -0.17 -0.059 -0.059 0.034 -0.010 1.000
infr 0.371 0.519 0.789 0.238 -0.481 0.429 -0.076 1.000
open 0.340 0.205 0.260 0.192 -0.142 0.346 -0.021 0.323 1.000
From the table, it can be said that quality of institution positively impacts on government revenue. Moreover, the correlation between institution and independent variables appears to be weak. Hence, institutional variables can be equated to independent variables in the model.
Table 3: The correlation coefficients matrix of six institutional variables (The whole sample: 82 developing countries.)
INS1 INS 2 INS 3 INS 4 INS 5 INS 6
ins1 1.000
ins2 0.792 1.000
ins3 0.44 0.542 1.000
ins4 0.77 0.615 0.387 1.000
ins5 0.839 0.83 0.57 0.703 1.000
ins6 0.543 0.535 0.421 0.662 0.584 1.000
According to the correlation coefficient matrix, the six institutional variables are closely related, especially the high closeness between the first institution (government effectiveness), the second institution (control of corruption) and the fifth institution (rule of law) with a correlation rate of more than 0.8. In other words, government effectiveness and rule of law can contribute to higher authority efficiency and a more meticulous control of corruption. Accordingly, a highly effective management and a good corruption control, in turn, support the rule of law. It is advisable that the analysis of each individual institution be conducted separately (it is not proper to place the first institution, the second institution and the fifth institution in the same model) to avoid bias caused by multi-correlation among variables.
5: RESULTS AND DISCUSSION
5.1. Impacts of institutional quality on tax revenue based on overall research data (The whole sample: 82 developing countries from Asia, Europe, Africa, and Latin America)
187
logarithm with two indicators has been applied by many previous researchers such as Mehrara et al. (2011); Ahmed (2012); Nguyen (2015).
So to solve endogenous phenomenon and serial auto-correlation of residuals, this research choses “institution” variable or “labor force” variable as one endogenous variable and exposes it to GMM procedure. The remaining variables are considered as instruments and used in procedure IV.
To evaluate the validity of instruments in first-difference GMM estimation and auto-correlation of residual, this paper applies the Sargan test (the test to identify rejection of the null hypothesis "the model has an endogenous phenomenon”) as well as testing for serial auto - correlation by Arellano - Bond test (AR2) (the test tries to check the repudiation of the null hypothesis “the variables in a model have serial auto-correlation of residual”). Examining the model has brought about the results in which p-value is higher than ten percent. These results display that there is enough evidence to reject the null hypothesizes (H0). After being tested there is not any endogenous phenomenon and serial auto-correlation of residuals. (See table four, table five, table six and table seven.)
To verify the robustness of difference panel GMM Arellano – Bond estimation, the estimated outcomes are always checked by reducing or adding some variables. Equally, this estimation starts with the overall data: eighty two developing countries and then with a data set of eighteen low-income countries, a data set of thirty two lower-middle low-income countries and finally with a data set of thirty two upper-middle income countries. All of these data sets give expected similar and significant results as displayed in table number four, table number five, table number six and table number seven. It says that the results of difference panel GMM guessing are strongly robust.
Table 4: The estimated results of difference GMM with the use of Arellano-Bond over the groups of developing countries (whole sample: 82 developing countries) Dependent variable: Δ Tax revenue
INS1 INS2 INS3 INS4 INS5 INS6
Tax revenue (-1) -1.189*** -1.212*** -1.247*** -1.266*** -.958*** -1.315*** Institution 27.572** 26.043*** 20.659** 47.753*** 32.999** 56.705*** GDP per capita 0.368*** 0.235*** 0.1707*** 0.004 0.208 0.087* Total investment 0.810** 0.634** 0.538** 0.076 0.633 0.233 Labor force -0.491 -0.454 -2.437 5.840** -1.721 -2.408 Government expenditure -1.178*** -0.802*** -0.666*** -0.563 -1.041** 0.054
Inflation -0.011 0.018 -0.005 0.077 0.201 0.048
Infrastructure -0.066 -0.046 -0.026 0.117** -0.060 -0.018 Trade openness -0.089 -0.050 -0.012 0.020 -0.086 -0.003
Obs. 1148 1066 1148 902 656 1066
AR(2) test 0.111 0.142 0.115 0.242 0.146 0.112
Sargan test 0.403 0.255 0.190 0.317 0.588 0.561
***, ** and *stand for significance at 1%, 5% and 10% respectively
188
(2009); Bornhorst et al. (2009); Ajaz and Ahmad (2010); Botlhole (2011); Dioda (2012). Hossain (2014) shares an opinion that an effective institution and authority will account for a proficient taxable system and high tax effort. Moreover, as noted by Syadullah and Wibowo (2015), a high rate of corruption will give rise to a poor performance of taxation; thus, a good control of corruption will both enrich tax revenue and avoid tax evasion.
Furthermore, controlled variables including total investment, real gross domestic product per capita, labour force, and infrastructure create significantly positive impacts on tax revenue. In more detail, real GDP per capita variable has a positive impacts on tax revenue with significance of one percent for three World Bank governance indicators: government effectiveness, control of corruption and political stability. When GDP percapita increases, people will spend more and government can collect more tax. It should be noted that for a low GDP per capita countries this also means a negative impact on government tax revenue. Pesendorfer (2008) showes that GDP per capita in Australia hasa significantly negative impact on the tax revenue when compared with other countries, where GDP per capita is higher.
While the total investment variablehas significantly a positive impact on tax revenue at five percent for the same three above indicators. In general, the result in table number four proves the high appropriateness and reliability of the investigated model, owing to the fact that the increase in investment can generate more government revenue.
Moreover, the labor force variable has a positive impact on tax revenue with significance of five percentfor only regulatory quality indicator. The tax revenue can be spread to other types of tax collection constituted by sale tax and direct tax such as personal income tax or corporate income tax (Gwartney & Lawson, 2006). The large number of labour force indicates an increase in the number of individual workers whose personal income taxes are consequently rising as well. Gravelle and Marples (2014) suggestthat the income tax is based on working hours. Hence, when the number of employees rises, working hours expand, which then fosters tax revenue.
With the regulatory quality indicator, infrastucture positively impacts on tax revenue with significance offive percent. Cohen et al. (2012) arguethatwith infrastructure improvement, more investment will be attracted, and it will eventually lead to increase tax revenue.
On the other hand, government expenditure has a negative impact on tax revenue with significance of one percent and of five percent. Another explanation to this might indicate that government spendingon public investment can overwhelm private investment ceteris-paribus. When private investment plunges, national budget is certainly to drop also since there will be a loss of tax revenue taken from private business’ investment activities and profits. In addition, Ghura (1998) and Elyasi and Rahimi (2012) figure out that in order to promote the revenue source, Iranian citizens and governments must reduce government spending or cut down on unnecessary expenses.
189
5.2. Impacts of quality of institution on taxrevenue in groups of different economies by
income (low income, lower-middle income, andupper - middle income)
5.2.1. Effects of institutional quality on tax revenue as a whole sample: 82 developing countries.
Table 5: The estimated results using difference GMM for Arellano – Bond panel data in a group of low-income countries (sub-sample = 18 low-income countries) Dependent variable: ΔTax revenue
INS1 INS2 INS3 INS4 INS5 INS6
Tax revenue (-1) -1.01*** -1.398*** -1.250*** -1.274*** -1.348*** -1.379*** Institution 21.495* 22.884** 15.593*** 25.206** 20.091** 16.514** GDP per capita 0.253** 0.077 0.257*** 0.242** 0.211** 0.296*** Total investment -0.144 -0.285** -0.102 -0.204* -0.283 -0.421
Labor force 1.787 2.335 -1.283 0.028 -7.963 12.672*
Government expenditure 0.433*** 0.661*** -0.376 -0.294 0.516 -0.261
Inflation 0.017 0.012 0.007 0.019 0.0175 0.015
Infrastructure -0.070* -0.050 0.001 0.025 0.006 -0.088 Trade openness 0.133 0.376*** 0.0623 0.345*** 0.242* 0.025
Obs 264 246 264 228 264 282
AR(2) test 0.544 0.164 0.168 0.129 0.945 0.527
Sargan test 0.356 0.469 0.163 0.549 0.647 0.879
***, ** and *stand for significance at 1%, 5% and 10% respectively
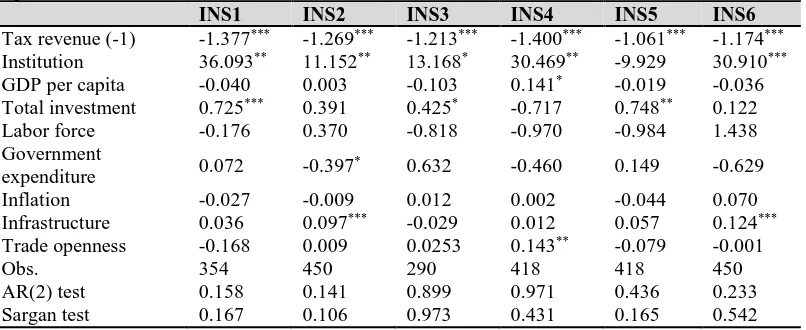
Table 6: The estimated results using difference GMM for Arellano – Bond panel data in a group of lower-middle income countries (sub sample: 32 lower-middle income countries) Dependent variable: ΔTax revenue
INS1 INS2 INS3 INS4 INS5 INS6
Tax revenue (-1) -1.377*** -1.269*** -1.213*** -1.400*** -1.061*** -1.174*** Institution 36.093** 11.152** 13.168* 30.469** -9.929 30.910*** GDP per capita -0.040 0.003 -0.103 0.141* -0.019 -0.036 Total investment 0.725*** 0.391 0.425* -0.717 0.748** 0.122 Labor force -0.176 0.370 -0.818 -0.970 -0.984 1.438 Government
expenditure 0.072 -0.397
* 0.632 -0.460 0.149 -0.629
Inflation -0.027 -0.009 0.012 0.002 -0.044 0.070
Infrastructure 0.036 0.097*** -0.029 0.012 0.057 0.124*** Trade openness -0.168 0.009 0.0253 0.143** -0.079 -0.001
Obs. 354 450 290 418 418 450
AR(2) test 0.158 0.141 0.899 0.971 0.436 0.233
Sargan test 0.167 0.106 0.973 0.431 0.165 0.542
***, ** and *stand for significance at 1%, 5% and 10% respectively
Table number five and table number six showthat the impacts of institutional quality on tax revenue in low-income and lower-middle income countries areconsistent with the overall result. Low-income countries especially attain the most consistent result. Benneth (2007) shares that the governments with more proficient institutions certainly have better policies regarding to rebalancing the income of the better-off and the poorest citizens, which obviously can improve taxation.
190
As for low income countries (Table number five), the result is also consistentwith the overall result for a whole sampleeighty twodeveloping countries in terms of labor force variable (explanation provided at 5.1).
When it comes to lower-middle income economies (Table number six), consistency with the general result is illustrated by the effect of the governmental expenditure variable. Specifically, governmental expenditure has negatively affected tax revenue with significance of ten percent, whereas, infrastructure has got a significantly positive impact on tax revenue at one percent with control of coruption and voice and accountbility indicators. Also, the total investment variable has a significantly positive impact on tax revenue atone percent for the government effectivenesindicator, at five percent for rule of law and the ten percentfor the indicator of political stability (explanation provided at 5.1). The mentioned findings once again show the robustness of the model.
5.2.2. The differences of the effects of institutional quality on tax revenueby group countries and overall result
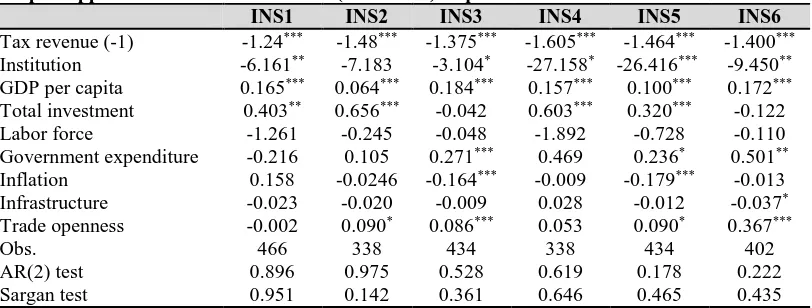
Table 7: The estimated results using difference GMM for Arellano – Bond panel data in a group of upper middle income countries (32 nations) Dependent variable: ΔTax revenue
INS1 INS2 INS3 INS4 INS5 INS6
Tax revenue (-1) -1.24*** -1.48*** -1.375*** -1.605*** -1.464*** -1.400*** Institution -6.161** -7.183 -3.104* -27.158* -26.416*** -9.450** GDP per capita 0.165*** 0.064*** 0.184*** 0.157*** 0.100*** 0.172*** Total investment 0.403** 0.656*** -0.042 0.603*** 0.320*** -0.122
Labor force -1.261 -0.245 -0.048 -1.892 -0.728 -0.110
Government expenditure -0.216 0.105 0.271*** 0.469 0.236* 0.501** Inflation 0.158 -0.0246 -0.164*** -0.009 -0.179*** -0.013 Infrastructure -0.023 -0.020 -0.009 0.028 -0.012 -0.037* Trade openness -0.002 0.090* 0.086*** 0.053 0.090* 0.367***
Obs. 466 338 434 338 434 402
AR(2) test 0.896 0.975 0.528 0.619 0.178 0.222
Sargan test 0.951 0.142 0.361 0.646 0.465 0.435
***, ** and *stand for significance at 1%, 5% and 10% respectively
191
that lead to higher economic growth. Hence, there is a institutional distinction between upper-middle income group and the other remain groups. Pfister (2009) also claimes that economic growth and domestic investment are enormously affected by taxation. Foreign investors as well as small businesses both pay a great deal of attention to deal with tax payment. OECD (2012), Goolsbee (2000), Piketty and Saez (2003), and Roine et al. (2009) reach a consensus on the issue that tax deduction supports economic growth. Felix (2007), on the other hand, discovers that the increase in business income tax would diminish the investment.
The second discrepancy is at trade openness. In fact, trade openess of the three economies: low-income, lower-middle low-income, and upper-middle income has a signicantly positive impact on tax revenue at one percent, five percent and ten percentwhile in overall data (eighty two developing countries) the variable of trade openness has no statistical significance. As a result, it is conclusive that effective government together with proper imports-exports activities and good control of corruption can boost tax revenue. Nwosa et al. (2012) also shows that there is a positive correlation with market openness rating and taxation in Nigeria. Sharing a same viewpoint, Mustaq et al. (2013) describesa similar situation in Pakistan.
Another discrepancy with overall data is found in upper-middle income countries and low-income countries. In fact, governmental expendituresin these groups have significant positive impacts on tax revenue at one percent, at five percent and ten percentrespectively while the overall group and lower-middle income group have a negative impact on tax revenue with significance of one percentand ten percent respectively. Mehmood and Sadiq (2010) also argue that the act of cutting down on expenditure in some developing countries by the government will adversely interfere with working productivity. Consequently, the tax revenue is also affected.
The final difference is that inflation has a significantlynegative impact on tax revenueat one percentamong upper-middle income countries but not in the other groups. It can be seen that inflation is accompanied by the downfall in investment and production, so a fall in tax payment is inevitable. According to Feldstein et al. (1983), inflation encourages decrease in saving and investment that has brought about a negative relation between inflation and taxation.
In addition to the mentioned discrepancies, this article also finds out one difference from the whole sample (eighty two developing countries) and two other groups. To low-income countries, especially the ones in Africa, total investment has a significantly negative impact on tax revenue at five percent and ten percent respectively. Investment in low-income countries is, therefore, inefficient. Tanzi & Davoodi (1997) also argue that corruption can help to enhance public investment (one section in the whole domestic investment) but deteriorate total domestic investment effectiveness.
6. CONCLUSION AND IMPLICATION
This study evaluates empirically the impacts of institutional quality on tax revenue by using panel data set from eighty two developing countries spreading all over the world. Among those eighty two countries, there are eighteen low-income countries, thirty two lower-middle countries, and thirty two upper-middle income in a period from 1996 to 2013 via difference GMM and Arellano-Bond test as well as Sargan test.
192
performed very well to reduce taxation rates for the purpose of attracting total investment opportunities.
All these aforementioned features are to remind the board of governors as well as policy planners of the importance of constructing high-quality judicial system and meticulously dealing with corruption, especially the malpractice of some tax officers. Furthermore, the board of governors should bring in appropriate tax regulations to ensure their validity and practicality. Those regulations should be able to eliminate the act of taking advantage of close relationships in business exchanges, which is very typical in ASEAN settings, to actually increase taxation. In order to enhance the income per capita, it is crucial to have one proper taxation system which requires a reasonable amount of tax in order to radiate the business attraction and then make it possible to foster domestic investment together with the establishment of proficient authority. Hence, developing countries can be developed to join higher income groups.
As for lower-middle income countries, the governors should faciliate some criteria including freedom of press management, freedom of speech, and freedom of voting because the preceding criteria are profoundly important and capable of generating tax revenue well. Also, for low-income countries, there is a strong need for macro-economic management policies to construct one unblemished authority and eradicate corruption so that the quality of institution and domestic investment can hopefully be better, accounting for better income per capita.
Views and opinions expressed in this study are the views and opinions of the authors, Asian Journal of Empirical Research shall not be responsible or answerable for any loss, damage or liability etc. caused in relation to/arising out of the use of the content.
References
Ahmed, M. (2012). Openness , institutions , and economic growth: Empirical evidence from panel estimation. North Carolina State University.
Ajaz, T., & Ahmad, E. (2010). The effect of corruption and governance on tax revenues. Pakistan Development Review, 49(4), 405–417.
Alm, J., Bahl, R. W., & Murrey, M. N. (1991). Tax base erosion in developing countries. Journal of Economic Development and Cultural Change, 39(4), 849-872.
Alonso, J. A., & Garcimartín, C. (2013). The determinants of institutional quality. More on the debate. Journal of International Development, 25(2), 206–226.
Arellano, M. (2003). Panel data econometrics. C. W. J. Granger et al., eds., New York: Oxford University press.
Arellano, M., & Bond, S. (1991). Some tests of specification for panel data: Monte Carlo evidence and an application to employment equations. The Review of Economic Studies, 58, 277–297. Attila, G. (2009). Corruption, taxation and economic growth: Theory and evidence. Recherches
économiques de Louvain, 75(2), 229–268.
Barro, R. J. (1990). Governmentspending in a simple model of endogenous growth. The Journal of Political Economy, 5, 103-125.
Barro, R. J. (1991). Economic growth in a cross section of countries. Quarterly Journal of Economics, 106(2), 407–443.
Benneth, O. (2007). Fiscal policy and poverty reduction: Some policy options for Nigeria, African Economic Research Consortium, AERC research Paper 164.
Benno, T. (2003). To Evade or not to evade: That is the question. Journal of Socio-Economics, 3, 283–302.
Bird, R. (1990). Expenditures, administration and tax reform in developing countries. Bulletin for International Tax Documentation, 44, 263-267.
193
Bird, R. M., & Martinez-Vazquez, J. (2008). Tax effort in developing countries and high income countries: The impact of corruption, voice and accountability. Economic Analysis and Policy, 38(1), 55–71.
Bird, R. M., Martinez-Vazquez, J., & Torgler, B. (2004). Societal institutions and tax effort in
developing countries. International Studies Program Working Paper, 04–06.
Bird, R., Martinez-Vazquez, J., & Torgler, B. (2006). Societal institutions and tax effort in developing countries. The Challenges of tax reform in the global economy. New York:
Springer, 283-338.
Bissoon, O. (2011). Can better institutions attract more foreign direct investment? Evidence from developing countries. International Conference on Applied Economics, 59-70.
Bornhorst, F., Gupta, S. A., & Thornton, J. (2009). Natural resource endowments and the domestic revenue effort. Economic Journal of Political Economy, 25, 439-446.
Botlhole, T. D. (2011). Natural resources, institutions and tax revenue mobilization in Sub-Sahara Africa. International Conference on Applied Economics – ICOAE 201.
Bruno, G. S. F. (2005). Estimation and inference in dynamic unbalanced panel data models with a small number of individuals. The Stata Journal, 5(4), 473–500.
Chand, S., & Moène, O. K. (1997). Controlling fiscal corruption. IMF Working Paper No. 97/100. Cohen, I., Freiling, T., & Robinson, E. (2012). The economic impact and financing of infrastructure
spending. Virgina.
Davoodi, H. R., & Grigorian, D. A. (2007). Tax Potential vs. Tax Effort: A Cross-Country Analysis of Armenia's Stubbornly Low Tax Collection. IMF Working Paper, WP/07/106.
Dioda, L. (2012). Structural determinants of tax revenue in Latin America and the Caribbean, 1990-2009, Mexico.
Du, J., Lu, Y., & Tao, Z. (2008). Economic institutions and FDI location choice: Evidence from US multinationals in China. Journal of Comparative Economics, 36, 412-429.
Efendic, A., Pugh, G., & Adnett, N., (2011). Institutions and economic performance: A meta-regression analysis. European Journal of Political Economy, 27(3), 586–599.
Elyasi, Y., & Rahimi, M. (2012). The causality between government revenue and government expenditure in Iran. International Journal of Economic Siences and Applied Research, 5(1), 129–145.
Feger, T. D., (2014). An analysis of the tax revenue components in Sub Sahara Africa. The Journal of Developing Areas, 48(4), 363–379.
Feldstein, M., Green, J., & Sheshinski, E. (1983). Inflation and taxes in a growing economy with debt and equity finance. In Inflation, Tax Rules, and Capital Formation, (44-60). University of Chicago Press.
Felix, R. A. (2007). Passing the burden: Corporate tax incidence in open economies (No. 468). LIS Working Paper Series.
Flachaire, E., García-Peñalosa, C., & Konte, M. (2014). Political versus economic institutions in the growth process. Journal of Comparative Economics, 42(1), 212–229.
Ghura, D. (1997). Private investment and endogenous growth: Evidence from Cameroon. IMF Working Paper WP/97/165.
Ghura, D. (1998). Tax revenue in Sub-Saharan Africa: Effects of economic policies and corruption. IMF Working Paper WP/98/135.
Goolsbee, A. (2000). Taxes, high-income executives, and the perils of revenue estimation in the new economy. American Economic Review, 90(2), 271-275.
Gravelle, J. G., & Marples, D. J., (2014). Tax rates and economic growth. Washington, DC: Congressional research service.
Griliches, Z., & Hausman, J. A. (1986). Errors in variables in panel data. Journal of Econometrics, 31(1), 93–118.
Gupta, S. (2007). Determinants of tax revenue efforts in developing countries. IMF Working Paper 07/184. Washington: International Monetary Fund.
194
Hakim, T. A., & Bujang, I. (2011). The impact and consequences of tax revenues’ components on economic indicators: Evidence from panel group data. International Research Journal of Finance and Economics, 63(1999), 82–95.
Haque, S. T. (2013). Effect of public and private investment on economic growth in Bangladesh: An econometric analysis (FDRS 05/2013).
Harberger, A. C. (1962). The incidence of the corporation income tax. The Journal of Political Economy, 70(3), 215–240.
Hossain, M. I. (2014). The quality of governance and tax effort: Evidence from developed and developing countries (Case study 5140143). Tokyo.
Imam, P. A., & Jacobs, D. F. (2007). Effect of corruption on tax revenues in the middle east. IMF Institute and Fiscal Affairs Department. (IMF Working Paper No.07/270).
Kathavate, J., & Mallik, G. (2012). The impact of the interaction between institutional quality and aid volatility on growth: Theory and evidence. Economic Modelling, 29(3), 716–724. Kaufmann, D., Kraay, A., & Mastruzzi, M. (2010). The worldwide governance indicators: A
summary of methodology, data and analytical issues. World Bank policy research Working Paper No. 5430. Washington, DC: The World Bank.
Kenny, C. (2005). Why are we worried about income? Nearly everything that matters is converging. World Development, 33(1), 1–19.
Kirchler, E., Hoelzl, E., & Wahl, I. (2008). Enforced versus voluntary tax compliance: The slippery slope framework. Journal of Economic Psychology, 29, 210‐225.
Krugman, P. R., Alm, J., Collins, S. M., & Remolina, E. (1992). Transforming the Philippine Economy. Quezon City: APO Production Unit, Inc.
Kuzmina, O., Volchkova, N., & Zueva, T. (2014). Foreign direct investment and governance quality in Russia. Journal of Comparative Economics, 42(4), 874-891.
Law, S. H., Lim, T. C., & Ismail, N. W. (2013). Institutions and economic development: A Granger causality analysis of panel data evidence. Economic Systems, 37(4), 610–624.
Lee, K., & Kim, B. Y. (2009). Both institutions and policies matter but differently for different income groups of countries: Determinants of long-run economic growth revisited. World Development, 37(3), 533–549.
Mahdavi, S. (2008). The level and composition of tax revenue in developing countries: Evidence from unbalanced panel data. International Review of Economics and Finance, 17, 607-617. Mankiw, G., Matthew, W., & Yagan, D. (2009). Optimal taxation in theory and practice (NBER
working paper No. 15071). Cambridge.
Mehmood, R., & Sadiq, S. (2010). The relationship between government expenditure and poverty : A cointegration analysis. Romanian Journal of Fiscal Policy, 1(1), 29–37.
Mehrara, M., Pahlavani, M., & Elyasi, Y. (2011). Government revenue and government expenditure nexus in Asian countries: Panel cointegration and ausality. International Journal of Business and Social Science, 2(7), 199–207.
Minea, A., Villieu, P. (2009). Can inflation targeting promote institutional quality in developing countries?. The 26th Symposium on Money, Banking and Finance, University of Orléans, 25-26.
Mustaq, S., Bakhsh, K., & Hassan, S. (2013). Estimating impact of trade libralization on tax revenue in Pakistan. Journal of Agriculture & Social Sciences, 8(4), 148–150.
Nguyen, V. B. (2015). Effects of Public Debt on inflation in developing economies of Asia: An empirical evidence based on panel differenced GMM Regression and PMG Estimation. The Empirical Economics Letters, 14(4), 341-351.
Nwosa, P. I., Saibu, M. O., & Fakunle, O. O. (2012). The effect of trade liberalization on trade tax revenue in Nigeria. African Economic and Business Review, 10(2), 28–43.
OECD (2012). Reducing income inequality while boosting economic growth: Can it be done? In Economic Policy Reforsm 2012 Going for Growth, 181–202.
Pesendorfer, K. (2008). Tax and economic growth in Austria. Monetary Policy and the Economy, 3(08), 21–40.
195
Piketty, T., & Saez, E. (2003). The Evolution of top incomes: A historical and international perspective. American Economic Review, 96(2), 200-205.
Rea, D. (2009). Government expenditure and revenue in New Zealand: A brief overview. Policy Quartely, 5(3), 58–67.
Richupan, S. (1984). Income tax evasion: A review of the measurement of techniques and some estimates for the developing countries. Department Memorandum No. DM/84/46. Washington, DC: The International Monetary Fund.
Roine, J., Vlachos, J., & Waldenström, D. (2009). The long-run determinants of inequality: What can we learn from top income data?. Journal of Public Economics, 93(7-8), 974-988. Roodman, D. (2009). How to do xtabond2: An introduction to difference and system GMM in Stata.
The Stata Journal, 9(1), 86–136.
Salahodjaev, R. (2015). Democracy and economic growth: The role of intelligence in cross-country regressions. Intelligence, 50(2015), 228–234.
Sttauss, T. (2001). Growth and government: Is there a difference between developed and developing countries. Economics of Governance, 2(2), 135–157.
Syadullah, M., & Wibowo, T. (2015). Governance and tax revenue in Asean countries. Journal of Social and development Sciences, 6(2), 76–88.
Tanzi, V., & Hamid, D. (1997). Corruption, public investment, and growth. IMF Working Paper 97/139 (Washington: International Monetary Fund).
Tayler, T. R. (2006). Psychological perspectives on legitimacy and legitimation. Annual Review of Psychology, 57, 375‐400.
Temple, J. (1999). The new growth evidence. Journal of Economic Literature, 37(March), 112–156. Torgler, B. (2003). Tax morale and institutions. Journal of Economic Psychology, 30(2), 228–245. Torgler, B., & Schneider, F. (2009). The Impact of Tax Morale and Institutional Quality on the
Shadow Economy. Journal of Economic Psychology, 30, 228-245.
Torgler, B., Schneider, F., & Macintyre, A. (2011). Shadow economy, voice and accountability and corruption. Handbook on the shadow economic, 469.
Torrance, S., & Morrissey, O. (2013). Taxation and indigenous institutions in Sub-Saharan Africa., Bonn.