THE SYNTHESIS AND CHARACTERISATIONS OF POROUS THIOAMIDE-SULFONATED-MODIFIED POLY (ACRYLONITRILE-CO-DIVINYLBENZENE-80) AS A POTENTIAL SORBENT TO CAPTURE POLAR ANALYTES
Farhana Syakirah Ismail1, Siti Nurul Ain Md. Jamil1*, Peter A. G. Cormack2, Luqman Chuah Abdullah3, Sazlinda
Kamaruzaman1 and Rusli Daik4
1Department of Chemistry, Faculty of Science, Universiti Putra Malaysia, 43400 UPM Serdang, Selangor,
Malaysia.
2WestCHEM, Department of Pure and Applied Chemistry, University of Strathclyde, Thomas Graham Building,
295 Cathedral Street, Glasgow G1 1XL, Scotland, U.K.
3Department of Chemical and Environmental Engineering, Faculty of Engineering, Universiti Putra Malaysia,
43400 UPM Serdang, Selangor, Malaysia.
4School of Chemical Sciences and Food Technology, Faculty of Science and Technology, Universiti Kebangsaan
Malaysia,43600 Bangi, Selangor, Malaysia *Corresponding author:
Siti Nurul Ain Md. Jamil [email protected]
Abstract
Pharmaceuticals contain biologically active components that can pollute water courses as a result of the excretions from individuals and/or uncontrolled release of residues from chemical plants, and they can pose a hazard to health. Pharmaceutical residues can persist at low concentrations in the environment, and thus may be potentially harmful to aquatic animals and to humans. Controlling and monitoring such residues are therefore a prime interest, for example, a solid-phase extraction uses solid sorbents to purify and preconcentrate the residues prior to their chemical analysis. In the present study, poly (acrylonitrile-co-divinylbenzene-80) sorbents are synthesised by varying the comonomer feed ratios under precipitation polymerisation conditions to deliver a family of porous polymer microspheres. Acrylonitrile confers polar characters onto the sorbents, and the acrylonitrile-derived nitrile groups can be chemically transformed via polymer-analogous reactions into thioamide and sulfonated residues which make the sorbents even more suitable for the capture of polar analytes, including selected pharmaceuticals. The utility of the porous thioamide-sulfonated containing sorbents is demonstrated via the dispersion-solid phase extraction of mefenamic acid from aqueous media; mefenamic acid is an anthranilic acid derivative which is a potent, non-steroidal anti-inflammatory drug which is found in environmental waters at low concentrations.
Keywords
Polyacrylonitrile, chemical modification, thiourea, polar pharmaceuticals, sulphonation,
dispersion-solid phase extraction
1. Introduction
Pharmaceutical residues contain active ingredients that have been designed to have
pharmacological effects and significant benefits to society. Pharmaceutical compounds may
enter the environment by different routes such as discharge of treated wastewater, seepage
from landfill sites, sewer lines and runoff from animal wastes [1, 2]. The issue of
pharmaceutical residue disposal is a current concern among the public as it may eventually
reduce water quality [3-7]. In addition, pharmaceuticals may be released into the effluents from
poorly controlled manufacturing or production industries. The occurrence of pharmaceutical
residues in the environment and water cycle at trace level greatly threatens human health and
disrupts the ecosystem. Studies show that 70% of the pharmaceutical residues in waste water
come from household, hospital and pharmaceutical industrial effluents [5, 8-10].
Table 1 shows the concentration of pharmaceuticals detected in Langat River in Malaysia.
Targeted analytes were detected in river water samples at measurable concentration namely
acetaminophen, atenolol, metformin, levonorgestrel, perindopril, chlorothiazide, diclofenac,
furosemide, glibenclamide, gliclazide, mefenamic acid and salicylic acid. Metformin and
chlorothiazide found in the surface water, were at relatively high concentrations of 293 and 182
ngL-1, respectively. The lowest concentrations detected were for glibenclamide, perindopril and
furosemide (2, 8 and 9 ngL-1, respectively). STP effluents of amlodipine, cyproterone,
loratadine, simvastatin, nifedipine, levonorgestrel and chlorpheniramine (ngL-1) were not
detected. The highest concentration detected was 865 ngL-1 for chlorothiazide followed by
metoprolol (364 ngL-1), diclofenac (217 ngL-1), norethindrone (188 ngL-1), mefenamic acid
(142 ngL-1) and atenolol (107 ngL-1). The detection of these pollutants suggested incomplete
eliminations of most of the targeted analytes by STP. Therefore, these pollutants were
continuously discharged into the Langat River through STP effluents [11].
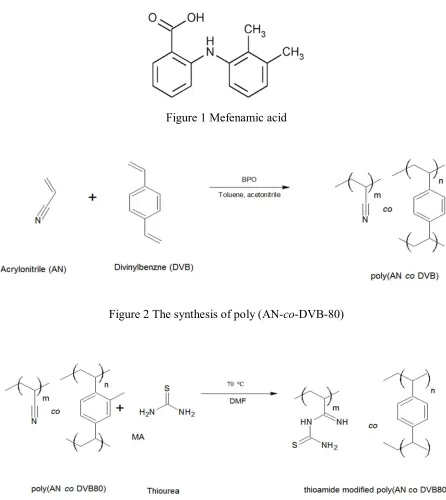
Mefenamic acid (MA) (Figure 1) is an anthranilic acid derivative which is a potent
nonsteroidal anti-inflammatory drug (NSAID) of the enolic class [12]. It is used as
antirheumatic and antipyretic analgesic, in the treatment of dental pain headache, postpartum
and menstrual pain [13]. Mefenamic acid residues can be introduced into water sources
through sewage, which carries excrement from individuals and patients who consumed the
drug. Studies on antibiotics have shown that up to 95% of antibiotic compounds were released,
without alteration into the sewage system, and high concentrations of antibiotics can lead to a
Mefenamic acid is one of the pharmaceutical residues that may affect the aquatic environment
and water supplement. In Malaysia, mefenamic acid was detected in Langat River in Selangor
with a concentration of 146 ngL-1 [11]. Although the detected concentrations of
pharmaceuticals were low, the long term exposure of pharmaceuticals would pose health risks
to humans, animals and aquatics [14].
Pharmaceutical residues can be removed from water through adsorption onto sludge in
water treatments [15-18]. Research on the adsorptive removal of pharmaceutical residues from
water have largely increased in recent years. Adsorption is a potential method for the removal
of pharmaceutical residues due to its mild operation conditions, low energy consumption, and
lack of side products [19-21]. Charcoal, which is obtained from the pyrolysis of primary pulp
mill sludge, is proven to adsorb pharmaceutical residues (diclofenac, salicylic acid, ibuprofen
and acetaminophen) from wastewater [22]. Carbonaceous materials (including activated
carbon, and carbon nanotubes) and mesoporous materials (transition metal-graft) have been
widely studied as potential adsorbents for the removal of pharmaceutical residues [20].
Molecularly imprinted polymer is also proven as a potential material for the reduction of
matrix interferences and the selective extraction of acidic pharmaceuticals, such as salicylic
acid, ibuprofen, fenoprofen, diclofenac and naproxen from effluent wastewater samples [23].
Furthermore, hypercrosslinked polymers with quaternary ammonium groups which act as an
integral part of their structure (HXLPPSAX) have been applied as strong anionic exchange
(SAX) sorbents in the solid phase extraction (SPE) to enable the selective extraction of acidic
pharmaceuticals from environmental water samples. These sorbents have enabled the selective
extraction of a group of acidic compounds from complex environmental water samples [19,
24].
Porous polymers are synthetic materials that are able to adsorb or desorb a wide range of
compounds. Porous polymer particles have a great potential for applications in many fields,
including as adsorbents, catalyst supports and matrices for the binding of sensitive materials
with multilevel structures which consist of submicron-sized hollow cavities and interconnected
mesopores within the crosslinked shell [25-27]. In this study, a series of imidazolium-based
porous organic polymer (POP-Ims) was synthesised, and the porosities of such polymers were
well tuned by varying the ratios of the two monomers. It was found that the POP-Ims with the
highest density of imidazolium moiety (POP-Im1) exhibited the best dispersity in water and
Hypercrosslinked poly (styrene (PS)-co-divinybenzene(DVB)) sorbents with a high
micropore content (specific surface area up to 2000 m2g-1) were prepared to provide more
interaction points with the analytes. The hydrophobic structure of the original porous polymers
of poly (PS-co-DVB) was modified to generate hydrophilic and hypercrosslink parts on the
sorbents. It was found that, 76-100% of the pharmaceutical residues were captured by the
modified poly (PS-co-DVB) [29-32]. A preliminary study was carried out to investigate the
potential of hypercrosslinked poly (acrylonitrile-co-divinylbenzene-co-vinylbenzylchloride) in
the capture of polar pharmaceuticals, diclofenac from a polar environment [33]. In addition,
chemical modifications of porous materials were carried out to enhance the selectivity of the
adsorbents towards pharmaceuticals; for instance, the preparation of copolymer of
bis[4(2-hydroxy-3-methacryloyloxypropoxy) phenyl] sulfide and glycidyl methacrylate was modified
from the reactions of the surface epoxide groups of the precursor with amines
(butylenediamine and diethylenethriamine). The prepared copolymers were utilised as
adsorbents in the solid phase extraction (SPE) of the multicomponent mixture of phenolic
compounds [30].
Chitosan which was grafted with anionic groups such as sulfonate (CsSLF) and carboxylate
(CsNCB) was made to adsorb pramipexole dihydrochloride (PRM). It was found that, at a high
pH, the adsorption of RPM towards CsNCB was high up to 82%. However, the desorption of
RPM from CsNCB was around 15% to 20% at the same pH. The desorption from both CsNCB
and CsSLF was high up to 95% when the value of the pH was low (acid condition) [34].
However, the major disadvantages of these adsorbents were low adsorption capacities,
relatively weak interactions with ions and difficulties of separation and regeneration from
water for some of them. Ion-exchange resins were able to remove ions substantially; however,
they had low selectivity and showed a high degree of swelling and poor mechanical stability
[35].
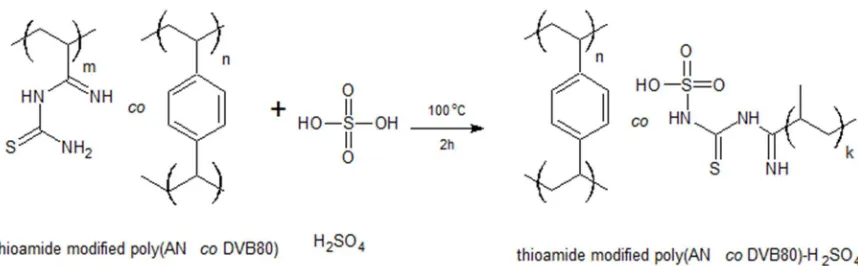
To overcome these limitations, poly (AN-co-DVB-80) (Figure 2) was synthesised via
precipitation polymerisation. The DVB-80 monomer acted as a crosslinking agent that helped
to maintain the firmness and develop a three-dimensional molecule (and hence develop
porosity) in the PAN copolymer system. The efficacy of the adsorption capacity was expected
to improve with the development of the porosity of the PAN-based polymeric adsorbent. The
porous resin had functioned upon its chemical treatment with thiourea (on the nitrile units)
(Figure 3) to develop a basic anion exchanger of poly (AN-co-DVB-80) matrix. Thioamide
was selected to instill three amine groups on each of the cyano group with longer pendant
chains. The anion exchangers which carried cationic groups (≡N+, =NH+ and –NH
expected to attach to the reversely charged counter ions by electrostatic interactions. In
addition, sulphuric acid was introduced onto the thioamide-modified poly (AN-co-DVB80) by
sulphonation (Figure 4) to increase the ion conductivity and induce stronger interactions with
the polar compounds [36]. In the present study, a preliminary test to investigate the potential of
the sorbent to capture polar analytes (mefenamic acid) was carried out via the dispersion-solid
phase extraction (d-SPE) method. The anions of mefenamic acid (Figure 5) were expected to
exchange with the adsorbents containing anion exchanger groups.
2. Materials and methods
2.1 Materials and equipment
The reagents used for the polymer synthesis were acrylonitrile (AN) and divinylbenzene
(DVB-80) and both were purchased from Sigma-Aldrich (Dorset, UK). DVB-80 and
acrylonitrile were purified by putting them through a short column of neutral alumina. The
benzoyl peroxide (BPO) was used as a polymerisation initiator and was purchased from BDH
(Poole, UK); prior to use, it was purified via recrystallisation from acetone at a low
temperature. Acetonitrile, toluene and methanol were purchased from Sigma-Aldrich (Steinem,
Germany). For the polymer-analogous reactions, thiourea and ethanol were supplied by
Sigma-Aldrich (Dorset, UK), and sodium hydroxide was supplied by Systerm (India). For the
sulphonation reaction, sulphuric acid was supplied by the Sigma-Aldrich (Dorset, UK). All
other reagents were used as received.
Polymerisations were performed in Nalgene® plastic bottles. The bottles were placed in a
Stuart Scientific S160 incubator (Surrey, UK) on a Stovall low profile roller (Essex, UK).
2.2 Synthesis of poly (acrylonitrile-co-divinylbenzene-80)
A series of poly (AN-co-DVB-80) microspheres was synthesised by copolymerising AN
with DVB-80 using a range of AN to DVB-80 ratios, under precipitating polymerisation
conditions. The porogen used was a mixture of acetonitrile and toluene (150 mL and 50 mL,
respectively), and the total monomer concentration was fixed at 2% w/v relative to the solvent.
The initiator concentration was fixed at 2 mol%, relative to the total number of polymerisable
double bonds.
The Nalgene bottle was lightly sealed with Parafilm and placed in an ultrasonic bath for 30
deoxygenated by sparging with N2 at 0˚C in an ice bath for 30 minutes. The bottle was then
sealed under N2 and placed on a low-profile roller (Stovall, Essex, UK) in a temperature
controllable incubator (Stuart Scientific, Surrey UK). The temperature was ramped from
ambient temperature to 60˚C over a period of around 2 hours, and then polymerisation was
allowed to proceed at 60˚C for a further 46 hours. The poly (AN-co-DVB-80) particles formed
were isolated via vacuum filtration on a 0.2 µm membrane filter and then washed in sequence
with acetonitrile, toluene, methanol and acetone, before overnight drying in a vacuum oven at
40 ˚C. The conversion of poly (AN), poly (DVB-80), and copolymers was calculated using eq.
(1).
=
( ) × 100 (1)
2.3 Chemical modification of poly (AN-co-DVB-80) with thiourea
The chemical modification of poly (AN-co-DVB-80) with thiourea took place at a ratio of
0.5:0.5 that is, AN: DVB-80. There were two stages involved in the chemical modification of
the copolymer. The first stage was the hydrolysis of the poly (AN-co-DVB-80) in a NaOH
solution in the following procedure; 0.3g of copolymer particles and 10 mL of ethanol/water
solution (molar ratio of 0.50) containing 5% (w/w) of NaOH were added into a 250 mL
three-necked, round-bottomed flask. The mixture was stirred at 70 ˚C for 1 hour. The hydrolysed
copolymer was filtered, rinsed with deionised water and dried overnight in a vacuum oven at
40˚C until a constant weight was obtained.
The second stage took place by treating the copolymer with 10 mL of thiourea and water
solution containing 3% (w/w) of thiourea. The reaction was reported at 70˚C for 2 hours. The
hydrolysed thioamide poly (AN-co-DVB-80) was rinsed with deionised water until a neutral
pH was achieved, then it was dried in a vacuum oven at 40˚C until a constant weight was
obtained. The modified copolymer was kept in a desiccator prior to further study.
2.4 Sulphonation of the thioamide-modified poly (AN-co-DVB-80)
The polymer particles and H2SO4 (98%) (1:5, weight to volume ratio) were added in a
round bottomed flask and stirred by using a magnetic stirrer at 90 ºC for 2 hours. The
sulfonated polymer was then rinsed with deionised water and acetone until a neutral pH was
achieved. The sulfonated polymer was kept in a desiccator after it was dried in a vacuum oven
2.5 Batch adsorption of pharmaceuticals
2.5.1 Preparation of Standard Stock Solution
300 ppm of the standard stock solution was prepared by weighing and transferring 150 mg
of mefenamic acid standard into a volumetric flask. Methanol was sufficiently added into the
volumetric flask which gave a 500 mL solution.
2.5.2 Procedures
2.5.2.1 Preparation of Standard Calibration Curve
For the preparation of standard calibration curve, a series of mefenamic acid solutions (10,
20, 30, 40, 50, 60, 70, 80, 90 and 100 ppm) was accurately prepared by diluting the standard
stock solution with methanol. These solutions were filtered by using a 0.45 nm nylon
membrane before they were filled into 1 mL vial bottles. Standard solutions were injected into
the HPLC system for analysis. A HPLC system (ACQUITY UPLC H-Class, USA) connected
to a UV detector (285nm wavelength) was used to measure the concentration of the APIs in
elutes. The column C18 Xterra which measured 150 mm x 4 mm with 3 µm particles was held
at 35°C. All analyses were performed with a flow rate 1.00 mL/min and injection volume of 10
µL. The APIs were separated using 50% methanol as mobile phase (10 mins run time). The
retention time of the highest peak was also recorded. Chromatograms obtained were analysed
using an Empower software. A graph of absorbance against the concentration of mefenamic
acid was plotted to determine the gradient.
2.5.2.2 Preliminary analysis: Adsorption of mefenamic acid by using d-SPE
The varying parameters for the adsorption included the concentration of mefenamic acid,
sorbent dosage and contact time. Each analysis was repeated 5 times (n=5).
The effect of mefenamic acid concentration on adsorption was investigated by adding 50
mg of poly (AN-co-DVB-80) sorbent into 15 different centrifuge tubes containing 20, 40, 60,
80, 100, 120, 140, 160, 180, 200, 220, 240, 260, 280, and 300 ppm of aqueous mefenamic acid
solutions, respectively. Similar steps were repeated for thioamide-modified poly (AN-co
-DVB-80) and thioamide-HSO3-modified poly (AN-co-DVB-80) sorbents. All the samples were left
to equilibrate for 24 hours prior to the chromatography analysis. The sample solutions were
centrifuged for five minutes at 4800 rpm to ensure all the particles were sedimented. An
analytes from the solid sorbent. The mixture was then centrifuged for 5 minutes at 4800 rpm,
which led to the settlement of the analytes and the solid sorbent at the bottom of the centrifuge
tube. Finally, 1 mL of the solvent was taken out and injected into the HPLC system for
analysis.
The effects of the adsorbent dosage were investigated by using different amounts of
sorbents, whereby 10, 20, 30, 40 and 50 mg of sorbents were added into different centrifuge
tubes containing 20 ppm of mefenamic acid. Similar steps were repeated for
thioamide-modified poly (AN-co-DVB-80) and thioamide-HSO3-modified poly (AN-co-DVB-80)
sorbents. All the samples were left to equilibrate for 24 hours prior to a chromatography
analysis.
The effects of contact time were investigated by varying the contact time for 1, 3, 6, 12 and
24 h. Similar steps were repeated for thioamide-modified poly (AN-co-DVB-80) and
thioamide-HSO3-modified poly (AN-co-DVB-80) sorbents. All the samples were left to
equilibrate overnight prior to a chromatography analysis.
2.5.2.3 Determination of Adsorption Capacity
The adsorption capacity was determined by using equation (2). The difference between the
concentration of the mefenamic acid solution at the beginning and at equilibrium was used in
the calculation:
qe= (C0-Ce) V (2)
m
where C0 and Ce were the initial and equilibrium concentration (mg/L) of the mefenamic acid,
respectively; V is the volume of the solution (mL); and m is the amount of adsorbent used (g).
The removal percentage can be calculated as:
Removal percentage= (C0-Ce) × 100 (3)
2.6 Characterisations
2.6.1 Fourier Transform Infrared (FTIR) Spectroscopy
The Fourier Transform Infrared Spectra (FTIR) was analysed by a Spectrum BX Elmer
spectrometer (U.S). FTIR was utilised to verify the presence of a certain functional group by
the spectrum of copolymer. Samples were analysed by using an Attenuated Total Reflectance
(ATR) within the range of 400-4000 cm-1 at 25˚C.
2.6.2 Scanning Electron Microscope (SEM)
SEM instrument (JEOL JSM 6360LA, Japan) was used to observe the morphologies of the
copolymers and the chemically modified polymers. The steel stub was coated with a
conductive copper using a double-sided adhesive tape. A thin layer of sample was then
deposited onto the coated steel stub. The platinum coating of the immobilised sample was
carried out for 8 minutes and a coated sample was placed inside the SEM chamber and a
vacuum was applied. Micrographs were acquired at accelerating voltages of 10.0 kV or 25.0
kV. The microsphere diameters and particle size distributions were calculated using the Image
J software from the SEM image analysis of 100 individual particles.
2.6.3 Nitrogen Sorption Analysis
The specific surface area, pore volumes and mean pore sizes of polymer microspheres were
determined using a Micrometrics ASAP 2010 (United States) surface area analyser. Samples
were degassed overnight under vacuum at 100˚C and then analysed by using nitrogen sorption
which was carried out at 77 K.
2.6.4 Elemental Microanalysis
The number of carbon, hydrogen, nitrogen and sulphur were determined by using a Perkin
Elmer 628 Series (United States). The samples were wrapped in tin foils and combusted at
1800˚C in pure oxygen before they were catalysed. The interferences were removed from the
combustion products before being swept into a detector zone where each element was
separated and eluted as CO2, H2O, NO2 and SO2. Then the signals were converted to
3. Results and Discussions
3.1 Yields of the polymerisation of poly (AN-co-DVB-80)
As tabulated in Table 2, poly (AN-co-DVB-80) was polymerised by varying the AN and
DVB-80 ratios to 1.00:0, 0.80:0.20, 0.50:0.50, 0.40:0.60, 0.25:0.75, 0.20:0.80 and 0:1.00
(mol%), respectively at 96 hours of reaction time. The observation during the precipitation
polymerisations revealed that the homogeneous mixture (monomer, initiator and porogen) in
the Nalgene bottle had started to form a milky white mixture after 90 to 120 minutes of heating
in the incubator. However, the nucleation of poly (AN) cannot be observed in the Nalgene
bottle due to the nature of poly (AN) that would dissolve in a mixture of acetonitrile and
toluene.
Table 3 shows the yields of the polymerisation of poly (AN-co-DVB-80) which were
collected by varying the ratio of AN:DVB-80 at a reaction time of 96 hours. The yields of the
polymerisation of poly (AN-co-DVB-80) were in the range of 68.80-88.80% while the yields
of the polymerisation of poly (AN) and poly (DVB-80) were 25.50% and 45.60%, respectively.
The lower yield of poly (AN) might be due to the absence of the crosslinking monomers
(DVB-80) that would have facilitated the growth and stability of the particles in continuous
phase during the polymerisation. It is noted that the half-life of the BPO is 1 hour at 92˚C and 1
minute at 131˚C [37]. Thus, BPO took a longer time to dissociate at 60˚C and therefore,
achieved more than 60% of yield but only at a reaction time of 96 hours.
3.2 Fourier Transform Infrared Spectroscopy (FT-IR) analysis
The FT-IR spectroscopic analysis was carried out to determine the presence of the desired
functional group in order to confirm the success of the polymerisation of homopolymers and
copolymers. Figure 6 shows the IR spectra of homopolymers which includes poly (AN) and
poly (DVB-80). The IR spectrum of poly (AN) showed an intense absorption at 2255 cm-1 that
corresponded to the stretching vibration of the nitrile group [38]. The adsorption band at 2960
cm-1 was assigned to the C-H stretching vibration for sp3 carbon. The bending peak at 1462
cm1 was related to the bending vibration of –CH2 group [39]. The IR spectrum of poly
(DVB-80) showed a band at 1617 cm-1 that corresponded to the C=C with stretching vibration from
the aromatic ring [40]. The bands at 1458 cm-1 and 1425 cm-1 were assigned to the bending
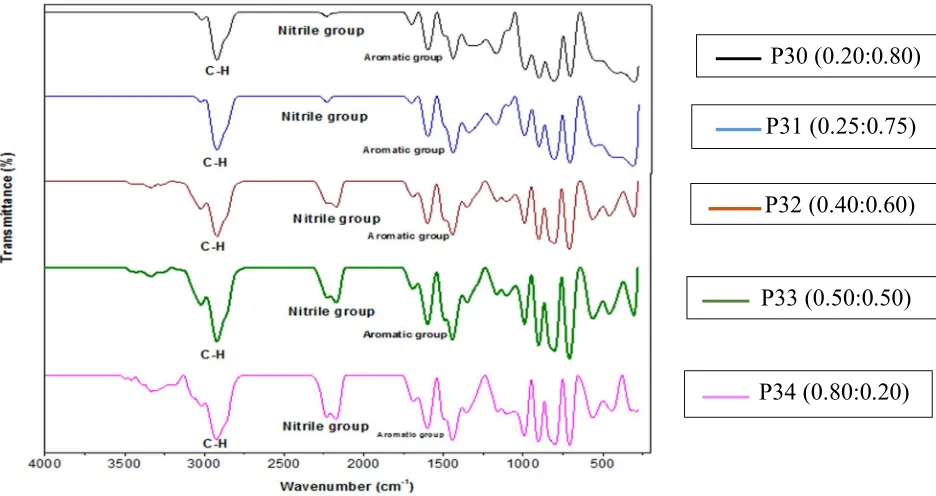
Figure 7 shows the comparison of IR spectra of poly (AN-co-DVB-80) with different
ratios. The IR spectrum of poly (AN-co-DVB-80) revealed that there was an absorption band at
~2234.68 cm-1 and it was assigned to the CN stretching vibration of the AN unit, which
confirmed the AN incorporation [38, 41]. The intensity of the CN band increased as the
amount of AN (mole %) was increased in the feed. As shown in Figure 7, the strong band at
the ~2922.44 cm-1 region was due to the C-H stretching vibration. The absorption at ~1443.06
cm-1 was related to the bending vibration band of imine groups (C=N). The hydrolysis of the
nitrile groups would have occurred during polymerisation due to the presence of the active
initiator radicals that contained oxygen atoms, and thus, would convert the nitrile group into
imine group [41]. The absorption band at the region ~1600.57 cm-1 was due to the
carbon-carbon stretching vibrations in the aromatic ring. Strong absorption band at 1700 cm-1 was due
to the presence of the carbonyl (C=O) stretching vibrations [42]. The absorptions at ~900 cm-1,
~830 cm-1 and ~790 cm-1 were due to the C-H bonds in the benzene rings of meta (m) and para
(p) in DVB units.
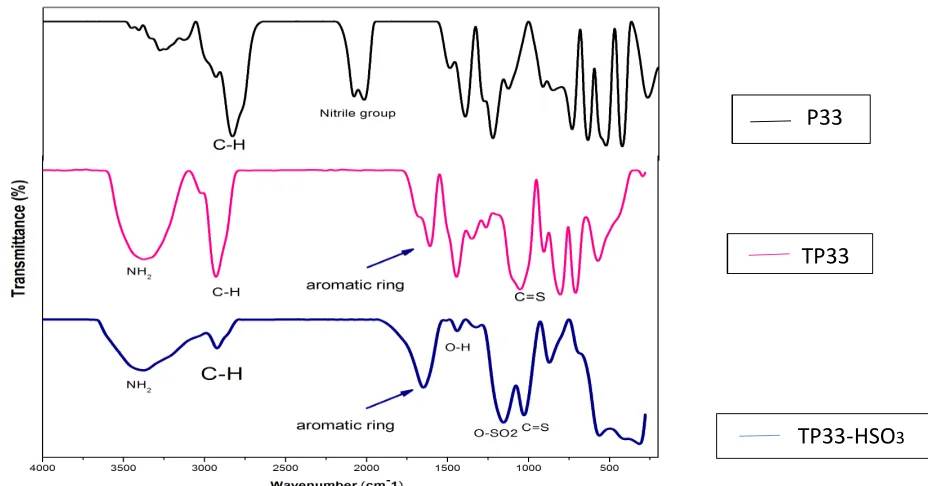
Figure 8 shows the FTIR spectra of poly (AN-co-DVB-80), hydrolysed poly (AN-co
-DVB-80) and thioamide-modified poly (AN-co-DVB-80) where AN: DVB-80 was set at a ratio of
0.5:0.5. The FTIR spectrum of hydrolysed poly (AN-co-DVB-80) showed a broad adsorption
band at ~3528 cm-1 which corresponded to the stretching vibration of the OH group and
indicated the presence of OH groups on the poly (AN-co-DVB-80) chain structure. From the
FTIR spectra, the CN group in the modified copolymer was diminished. A new peak was found
at ~3360.29 cm-1 in the modified copolymer spectrum, which would have corresponded to the
stretching vibration of the NH2 groups. Another new strong peak appeared at ~1052.47 cm-1
and it was assigned to the stretching vibrations of C=S that confirmed the chemical
modification of poly (AN-co-DVB-80) with thiourea to form thioamide-modified poly
(AN-co-DVB-80) [41].
Figure 9 shows the comparison of the IR spectra of poly (AN-co-DVB-80),
thioamide-modified poly (AN-co-DVB-80) and thioamide-HSO3-modified poly (AN-co-DVB-80). In the
case of sulphonated-modified copolymer, there was a new strong peak which appeared at
~1154.47 cm-1 that was assigned to the stretching vibrations of O-SO
2. In addition, a new peak
appeared at ~1440.69 cm-1 that was assigned to the stretching vibrations of O-H. The
appearance of new peaks confirmed the sulphonation reaction to thioamide-modified poly
(AN-co-DVB-80). Table 4 shows the IR wavenumbers of poly (AN-co-DVB),
thioamide-modified poly (AN-co-DVB-80) and thioamide-HSO3-modified poly (AN-co-DVB-80),
3.3 Scanning Electron Microscope (SEM) Analysis
The morphologies of homopolymers and copolymers were analysed using a Scanning
Electron Microscope (SEM). Figure 10 shows the SEM images of homopolymers which are
poly (AN) and poly (DVB-80) while Figure 11 shows the morphologies of poly (AN-co
-DVB-80) SEM images with different monomer ratios. Figure 12 shows the morphologies of the
copolymer before and after the chemical modification with thiourea and also after sulfonation
with sulphuric acid.
The appearance of poly (AN) in Figure 10 as clusters of agglomerated small particles could
be due to the absence of DVB-80 which contained residual double bonds that could capture the
soluble oligomers and monomers and induce growth in the polymer particles and prevent
coagulation during the polymerisation. The reaction would occur either between the active
radicals and soluble oligomers or between the active radicals themselves due to the absence of
crosslink monomers. As a result, aggregation or irregular particles were formed. In addition,
the appearance of the aggregation of poly (AN) particles might be due to the process of
evaporating the polymer solution in a room temperature overnight to recover the product and
therefore, the soluble oligomers existed and appeared as small agglomerated particles in the
SEM image.
Figure 11 shows that the spherical particles were afforded at AN fractions of 0, 0.20, 0.25
and 0.40 (mole%) in the poly (AN-co-DVB-80) feed. Agglomerates of irregular particles and
monolith-shape were formed at AN fractions of 0.50 and 0.80 (mole%) in the poly (AN-co
-DVB-80). As the amount of AN increased up to 0.8 (mole%), the poly (AN-co-DVB-80)
copolymers also precipitated quickly to stabilise against homocoagulation which could lead to
the formation of aggregates of irregular particles. This was also due to the different solubility
of DVB-80 and oligomers in a mixture of acetonitrile and toluene. The insufficient amount of
DVB-80 served as a crosslinker which formed networks that provided mechanical stability for
the polymers which then resulted in the collision between particles, consequently they
produced small and agglomerated particles for the P33 and P34. The highest amount of AN in
P34 resulted in the formation of copolymers with monolith structure.
The SEM images of poly (AN-co-DVB-80) showed that the incorporation of sufficient
amount of DVB-80 such as 0.80 mole% in the feed formed crosslinked copolymer chains in
the copolymer system which influenced the stabilisation of particles against homocoagulation
the poor solvation conditions for the involved monomers and might be due to the extended
particle nucleation at low crosslinking content of 0.50 and 0.20 (mole%) in feed, respectively.
Table 5 depicts the mean particle diameters and particle size distributions of spherical
particles that were determined using the Image J software. The mean diameter of the particles
was calculated based on the average value measurement of 50 particle diameters from the SEM
images (by using J Image software). As shown in Table 5, σ is the standard deviation of the
diameter and µ is the average particle diameter. The Cv value was below 5% which indicated
that the particles were monodispersed. The Cv value of 5-15% was considered as
quasi-monodispersed particles. The Cv value of above 15% indicated that the particles were
polydisperse. Table 5 shows that P30, P31, P32 and P35 contained high amounts of DVB-80 in
the feed (1.00, 0.80, 0.75, and 0.60 mole% of DVB-80), respectively, and appeared as
polydisperse copolymers.
Figure 12 shows a comparison of the morphologies of the copolymer before and after a
chemical modification with thiourea and also after sulfonation by sulphuric acid. Generally, the
morphology of the modified copolymer as shown in Figure 10 is less agglomerated compared
to its morphology before it is modified. In addition, Figure 12 shows that thioamide-modified
poly (AN-co-DVB-80) and thioamide-HSO3-modified poly (AN-co-DVB-80) were less coarse
and had a groovy appearance compared to poly (AN-co-DVB-80). This was due to the fact that
modified copolymers comprised additional chains that contained thioamide groups and
sulfonic groups; where the chains were attached to the copolymer surface and filled their pits.
Generally, the P33 copolymer retained its particle structure even after the chemical
modification with thiourea and sulphonation were carried out at high temperature.
3.4Brunauer-Emmett-Teller (BET) analysis
Nitrogen sorption porosimetry is a useful technique to analyse the porosity of particles. The
specific surface area was calculated using the Bruneuer-Emmett-Teller (BET) isotherm. Table
6 shows the nitrogen sorption porosimetry data which was obtained for poly (AN-co-DVB-80),
thioamide-modified poly (AN-co-DVB-80) and thioamide-HSO3-modified poly (AN-co
-DVB-80).
In the present study, porogen (toluene) was introduced to acetonitrile as a reaction medium
to develop porosity in the copolymer system. A higher incorporation of crosslinking monomer
formation of macro-reticular particles; while a higher incorporation of AN in the feed produced
poly (AN-co-DVB-80) with gel-type appearance.
The increment of AN content during polymerisation resulted in lower porous surface area
values and pore volume of copolymer system. The P30 with the lowest molar ratio of AN
(20%) had a surface area of 793 m2g-1while the P34 with the highest molar ratio of AN (80%)
had a surface area of 27 m2g-1. Similar trend was seen in the pore volume; in which the pore
volume of P30 and P34 were 0.823 (cm3g-1) and 0.159 (cm3g-1), respectively. The pore sizes of
particles increased as the inclusion of AN was higher in the copolymer system. This was due to
the lower inclusion of DVB-80 that resulted in less formation of crosslink networks in the
particle system. It is a known fact that in the case of porous particles that a higher formation of
crosslink networks would cause more porosity within the particles and consequently produce
smaller pore sizes.
Table 7 reveals that the specific surface areas of P33 had decreased significantly; from 565
m2g-1 to 330 m2g-1 and 4 m2g-1 after the chemical modifications were carried out with thiourea
and sulphuric acid, respectively. This might be due to the introduction of new functional
groups that had occupied the pores after the chemical modifications [44]. In addition, the
chemical modification at elevated temperatures would have disrupted the pore wall and
consequently reduced the pore volumes and surface area of the particles. The pore wall
disruption was proven by the increment of the particle pore size from 5.8 nm (P33) to 7.0 nm
(TP33) and 552.8 nm (TP33-HSO3). Although the surface area of the samples decreased upon
modification by thiourea and sulphuric acid, the pore size was still large enough for the
analytes to diffuse within the channels of the particles.
3.5 Elemental Microanalysis
The elemental microanalysis of CHNS is used to estimate the composition of the polymers
isolated from the precipitation polymerisation. Table 8 shows the composition of carbon,
hydrogen and nitrogen of the poly (AN), poly (DVB-80) and poly (AN-co-DVB-80) with
different ratios. As expected, P35 poly (AN) had the highest amount of nitrogen (26%)
compared to the other polymers. P29 which is a DVB homopolymer showed 0% of nitrogen
since no AN was present in the feed. In the case of poly (AN-co-DVB), as expected, the
composition of nitrogen had increased as the amount of AN was increased in the feed.
Generally, the percentage of the elements found in respective samples were according to the
Table 9 shows the composition of carbon, hydrogen, nitrogen and sulfur in P33, TP33 and
TP33-HSO3. As expected, P33 had no sulfur content at all. The TP33 had 4.1% of sulfur
content due to the chemical modification of the P33 with thioureawhile the amount of sulfur in
TP33-HSO3 was the highest (5.8%) due to the sulphonation with sulphuric acid. As expected,
the chemical modification of copolymer with thiourea had increased the amount of nitrogen in
the TP33 (5.7%) while TP33-HSO3 had the lowest content of nitrogen (3.3%).
3.6 The potential of sorbents in the capture of mefenamic acid
Thepotential of sorbents in the capture of pharmaceuticals was evaluated by carrying out
a preliminary analysis of mefenamic acid adsorption using poly (AN-co-DVB-80),
thioamide-modified poly (AN-co-DVB-80) and thioamide-HSO3-modified poly (AN-co-DVB-80),
respectively.
Figure 14 shows the amount of mefenamic acid that was adsorbed by the poly (AN-co
-DVB-80), thioamide-modified poly (AN-co-DVB-80) and thioamide-HSO3-modified poly
(AN-co-DVB-80), respectively. The data demonstrated that, as the concentration of the
pharmaceutical increased, the amount of pharmaceuticals adsorbed by the adsorbent had also
increased until it achieved equilibrium. As shown in the Figure 14(a) and (b), the maximum
amount of mefenamic acid adsorbed by the poly (AN-co-DVB-80) was 55.91 mgg-1 (46.59%);
which was lower compared to the adsorption capacities of thioamide-modified poly (AN-co
-DVB-80) and thioamide-HSO3-modified poly (AN-co-DVB-80). A higher adsorption capacity
of thioamide-modified poly (AN-co-DVB-80) (93.88 mgg-1 (78.23%)) was expected due to its
high specific surface area (330 m2g-1). On the other hand, thioamide-HSO
3-modified poly
(AN-co-DVB-80) demonstrated the highest adsorption capacity (96.88 mgg-1 (80.73%)) despite its
low specific surface area (4 m2g-1). Thioamide-modified poly (AN-co-DVB-80) and
thioamide-HSO3-modified poly (AN-co-DVB-80) would have provided active functional groups to
capture mefenamic acid despite their lower surface areas of 330 m2g-1 and 4 m2g-1,
respectively, compared to the poly (AN-co-DVB-80) with the highest specific surface area of
565 m2g-1. In the case of thioamide-HSO
3-modified poly (AN-co-DVB-80), the development of thioamide and sulfur polar functional group provided longer pendant chains which increased
the possibility of interactions between active functional groups and mefenamic acid during
adsorption. An equilibrium was achieved at a concentration of 300 ppm of mefenamic acid due
to the fact that the active sites of the copolymer were fully occupied and had achieved a
Poly (AN-co-DVB-80), thioamide-modified poly (AN-co-DVB-80) and thioamide-HSO3
-modified poly (AN-co-DVB-80) were respectively brought into contact with 20 ppm of
mefenamic acid by varying the sorbents’ dosage (10 to 50 mg). As shown in Figure 15, the
concentration of mefenamic acid adsorbed was increased as the adsorbent dosage increased.
This was attributed to the higher number of active sites that captured the analytes [45]. Figure
15 demonstrates that the maximum adsorption of mefenamic acid was achieved by using
thioamide-HSO3-modified poly (AN-co-DVB-80) sorbent at 96.88 mgg-1 (80.73%) of
adsorption capacity.
The relationship between the contact time and the amount of mefenamic acid adsorbed
is shown in Figure 16. The contact time of the adsorption was gradually increased from 1 h
before it reached an equilibrium at 12 h. The adsorption had risen with the increase of contact
time due to a large number of vacant surface sites (of the sorbent) which was available at the
initial stage. After a lapse of time, the remaining vacant surface sites of the sorbent would not
be occupied easily due to the repulsive force between the solute molecules in the solid and
bulk phase [45]. As shown in Figure 16, the maximum adsorption of the mefenamic acid at 12
h was achieved by thioamide-HSO3-modified poly (AN-co-DVB-80) (4.84 mgg-1, 60.49 %).
The preliminary analysis was carried out by using the d-SPE method and it showed that
the thioamide-HSO3-modified poly (AN-co-DVB-80) sorbent had captured the highest amount
of mefenamic acid compared to the poly (AN-co-DVB-80) and thioamide-modified poly
(AN-co-DVB-80) sorbents. This observation indicated that the development of active functional
groups (amides and sulphur polar functional groups) in thioamide-HSO3-modified poly
(AN-co-DVB-80) had facilitated the adsorption process; in which the adsorption capacity was
comparable to the sorbent without multiple active functional groups but had the highest
specific surface areas (thioamide-modified poly(AN-co-DVB-80)). It is noted that although the
poly (AN-co-DVB-80) sorbent readily contains polar functional groups (cyano groups), it is
necessary to chemically modify the sorbent to manipulate the cyano functional groups for
selectivity purpose in future work.
4. Conclusion
The chemical modification of porous poly (AN-co-DVB-80) adsorbent was
successfully carried out to develop anionic exchanger characteristics in the copolymer system.
The specific surface area of poly (AN-co-DVB-80) particles was 565 m2g-1 with a pore size of
m2g-1 which was lower than the copolymer. The sulphonation resulted in even lower specific
surface area (4 m2g-1). The evaluation of the potential of the adsorbent in the capture of polar
compounds was carried out by using mefenamic acid as analytes in the d-SPE system. The
adsorption analysis showed that the thioamide-HSO3-modified poly (AN-co-DVB-80) had
comparable adsorption capacity to the thioamide-modified poly (AN-co-DVB-80); although
thioamide-HSO3-modified poly (AN-co-DVB-80) had lower specific area (4 m2g-1) compared
to the thioamide-modified poly (AN-co-DVB-80) (330 m2g-1) and poly (AN-co-DVB-80) (565
m2g-1). This finding showed that in addition to high specific surface areas, the development of
thioamide and sulphur moieties in the copolymer system (a need for the instillation of anionic
exchanger characteristics) had also facilitated the performance of the sorbent in the capture of
the polar analytes.
5. Acknowledgements
The authors would like to thank the Chemistry Department of the Faculty of Science in
Universiti Putra Malaysia (UPM) and WestCHEM of the Department of Pure and Applied
Chemistry in the University of Strathclyde in the United Kingdom, and the Ministry of Higher
Education of Malaysia for the financial support given via the Fundamental Research Grant
References
1. Patneedi, C.B. and K. Durga Prasadu, Impact of pharmaceutical wastes on human life and environment. Rasayan Hournal Chemical, 2015. 8: p. 67-70.
2. Shukla, T., et al., Role of Pharmacist In Pharmaceutical Waste Management. Vol. 6. 2017. 1-13.
3. Yakubu, O.H., Pharmaceutical Wastewater Effluent—Source of Contaminants of Emerging Concern: Phytotoxicity of Metronidazole to Soybean (Glycine max). Toxics, 2017. 5(2): p. 10.
4. Alshakka, M., et al., Hazards of Pharmaceuticals in Water as New Area in Eco-Pharmacovigilance Research. Journal of Pharmacy Practice and Community Medicine, 2016. 2(1): p. 3-8.
5. Olarinmoye, O., et al., Quantification of pharmaceutical residues in wastewater impacted surface waters and sewage sludge from Lagos, Nigeria. Journal of Environmental Chemistry and Ecotoxicology, 2016. 8(3): p. 14-24.
6. Zhou, H., et al., Occurrence and preliminarily environmental risk assessment of selected pharmaceuticals in the urban rivers, China. Scientific Reports, 2016. 6: p. 34928.
7. Baresel, C., et al., Pharmaceutical Residues and Other Emerging Substances In The Effluent of Sewage Treatment Plants. 2015, IVL Swedish Environmental Research Institute. p. 1-117.
8. Al-Odaini, N., et al., Detecting Human Pharmaceutical Pollutants in Malaysian Aquatic Environment: A new challenge for water quality management. 2011.
9. Bagheri, H., A. Afkhami, and A. Noroozi, Removal of Pharmaceutical Compounds from Hospital Wastewaters Using Nanomaterials: A Review. Analytical and Bioanalytical Chemistry Research, 2016. 3(1): p. 1-18.
10. Białk-Bielińska, A., et al., Selected analytical challenges in the determination of pharmaceuticals in drinking/marine waters and soil/sediment samples. Journal of Pharmaceutical and Biomedical Analysis, 2016. 121: p. 271-296.
11. Al-Odaini, N.A., et al., Multi-residue analytical method for human pharmaceuticals and synthetic hormones in river water and sewage effluents by solid-phase extraction and liquid chromatography–tandem mass spectrometry. Journal of Chromatography A, 2010. 1217(44): p. 6791-6806.
12. Karaman, R., Abu-Jaish A., Mecca G., Jumaa S., Thawabteh A., Karaman R. “Mefenamic acid Prodrugs and Codrugs- Two Decades of Development” World Journal of Pharmaceutical Research 2015, 4(6): 2408-2429. 2015.
14. Patneedi, C.B. and K.D. Prasadu, Impact of pharmaceutical wastes on human life and environment Rasayan journal Chem, 2015. 8(1): p. 67-70.
15. Kinney, C., et al., Presence and Distribution of Wastewater-Derived Pharmaceuticals in Soil Irrigated with Reclaimed Water. Vol. 25. 2006. 317-26.
16. Loos, G., A. Van Schepdael, and D. Cabooter, Quantitative mass spectrometry methods for pharmaceutical analysis. Philosophical transactions. Series A, Mathematical, physical, and engineering sciences, 2016. 374(2079): p. 20150366.
17. Madikizela, L.M. and L. Chimuka, Simultaneous determination of naproxen, ibuprofen and diclofenac in wastewater using solid-phase extraction with high performance liquid chromatography. Water SA, 2017. 43: p. 264-274.
18. Yao, Z., et al., Magnetic microsphere-based portable solid phase extraction device for on-site pre-concentration of organics from large-volume water samples. Scientific Reports, 2017. 7(1): p. 8069.
19. Khalik, W. and P. Abdullah, Solid Phase Extraction Method for Caffeine Analysis in Water: A Mini Review. Vol. 3. 2017. 485-489.
20. Seo, P.W., et al., Adsorptive Removal of Pharmaceuticals and Personal Care Products from Water with Functionalized Metal-organic Frameworks: Remarkable Adsorbents with Hydrogen-bonding Abilities. Scientific Reports, 2016. 6: p. 34462.
21. Deniz, D.a., Automatic capillary liquid chromatography tandem mass spectrometry method for pharmaceutical products in environmental water samples, in Det matematisk-naturvitenskapelige fakultet. 2017, Kjemisk institutt: Kjemisk institutt.
22. Coimbra, R.N., et al., Removal of pharmaceuticals from municipal wastewater by adsorption onto pyrolyzed pulp mill sludge. Arabian Journal of Chemistry, 2015.
23. Gilart, N., et al., Determination of pharmaceuticals in wastewaters using solid-phase extraction-liquid chromatography-tandem mass spectrometry. Journal of Separation Science, 2012. 35(7): p. 875-882.
24. Bratkowska, D., et al., Hypercrosslinked strong anion-exchange resin for extraction of acidic pharmaceuticals from environmental water. Journal of Separation Science, 2012. 35(19): p. 2621-2628.
25. Chen, D., et al., Super-adsorbent material based on functional polymer particles with a multilevel porous structure. Npg Asia Materials, 2016. 8: p. e301.
26. Ghosh, S.K., et al., Porous polymer composite membrane based nanogenerator: A realization of self-powered wireless green energy source for smart electronics applications. Journal of Applied Physics, 2016. 120(17): p. 174501.
28. Su, Y., et al., Imidazolium-Based Porous Organic Polymers: Anion Exchange-Driven Capture and Luminescent Probe of Cr2O72–. ACS Applied Materials & Interfaces, 2016. 8(29): p. 18904-18911.
29. Fontanals, N., et al., Mixed-mode ion-exchange polymeric sorbents: dual-phase materials that improve selectivity and capacity. TrAC Trends in Analytical Chemistry, 2010. 29(7): p. 765-779.
30. Sobiesiak, M., B. Podkościelna, and P. Podkościelny, New functionalised polymeric microspheres for multicomponent solid phase extraction of phenolic compounds. Adsorption, 2016. 22(4): p. 653-662.
31. Tan, L. and B. Tan, Hypercrosslinked porous polymer materials: design, synthesis, and applications. Chemical Society Reviews, 2017. 46(11): p. 3322-3356.
32. Hwang, K.S., et al., Preparation of hypercrosslinked poly(DVB-VBC) particles with high surface area and structured meso- and micropores. Macromolecular Research, 2015. 23(11): p. 1051-1058.
33. Subri, N.N.S., et al., Synthesis of poly(acrylonitrile-co-divinylbenzene-co-vinylbenzyl chloride)-derived hypercrosslinked polymer microspheres and a preliminary evaluation of their potential for the solid-phase capture of pharmaceuticals. Journal of Applied Polymer Science, 2017. 135(2): p. 45677.
34. Amouzgar, P., et al., Advanced Material for Pharmaceutical Removal from Wastewater. 2016. 179-212.
35. Samiey, B., C.-H. Cheng, and J. Wu, Organic-Inorganic Hybrid Polymers as Adsorbents for Removal of Heavy Metal Ions from Solutions: A Review. Materials, 2014. 7(2): p. 673-726.
36. Patiño, D., E. Correa, and M. Acevedo-Morantes, Effect of sulfonation and diethanolamine addition on the mechanical and physicochemical properties of SEPS copolymer. Journal of Physics: Conference Series, 2016. 687(1): p. 012056.
37. Hamid Hamdu, H., An isocratic normal-phase high-performance liquid chromatographic method for the simultaneous determination of benzoyl peroxide and benzoic acid in one pharmaceutical preparation and their stability in different solvents. Vol. 9. 2014. 04-12.
38. Gonz, M., et al., Synthesis and Study of Chemical, Thermal, Mesomorphic, and Optical Properties of Terphenyls Modified with Nitrile Groups. Journal of Chemistry, 2017. 2017: p. 9.
39. Oleszko, A., et al., Application of FTIR-ATR Spectroscopy to Determine the Extent of Lipid Peroxidation in Plasma during Haemodialysis. BioMed Research International, 2015. 2015: p. 245607.
41. Bagheri, B., et al., Efficient Removal of Cr3+, Pb2+ and Hg2+ Ions from Industrial Effluents by Hydrolyzed/Thioamidated Polyacrylonitrile Fibres. Vol. 19. 2010. 911-925.
42. Mecozzi, M. and E. Sturchio, Computer Assisted Examination of Infrared and Near Infrared Spectra to Assess Structural and Molecular Changes in Biological Samples Exposed to Pollutants: A Case of Study. Journal of Imaging, 2017. 3(1).
43. Ge, S., et al., Adsorption characteristics of sulfur solution by acticarbon against drinking-water toxicosis. Saudi Journal of Biological Sciences, 2017. 24(6): p. 1355-1360.
44. Ruimin, M., et al., Improving lead adsorption through chemical modification of wheat straw by lactic acid. IOP Conference Series: Earth and Environmental Science, 2018. 108(2): p. 022063.
List of Figures
1. Figure 1 Mefenamic acid
2. Figure 2 The synthesis of poly (AN-co-DVB-80)
3. Figure 3 Chemical modification of poly (AN-co-DVB-80) with thiourea
4. Figure 4 Sulphonation of thioamide-modified poly (AN-co-DVB-80) with sulphuric
acid
5. Figure 5 Anions of mefenamic acid
6. Figure 6 IR Spectra of poly (AN) and poly (DVB-80)
7. Figure 7 IR Spectra of the poly (AN-co-DVB-80) with different ratios
8. Figure 8 IR Spectra of the poly (AN-co-DVB-80), hydrolysed poly (AN-co-DVB-80)
and thioamide-modified poly (AN-co-DVB-80)
9. Figure 9 IR Spectra of poly (AN-co-DVB-80), thioamide-modified poly (AN-co
-DVB-80) and thioamide-modified poly (AN-co-DVB-80)-HSO3
10.Figure 10 SEM images of poly (AN) and poly (DVB-80)
11.Figure 11 SEM images of poly (AN-co-DVB-80) with different AN/DVB-80 ratios
12.Figure 12 SEM images of poly (AN-co-DVB-80), thioamide-modified poly (AN-co
-DVB-80), and thioamide-modified poly (AN-co-DVB-80)-HSO3
13.Figure 13 Polynomial Data of (a) P30, (b) P31 and (c) P32
14.Figure 14 Amount of (a) adsorption capacity, (b) percentage of mefenamic acid that
was absorbed by the adsorbent at different concentrations
15.Figure 15 Amount of mefenamic acid that was absorbed by the thioamide-modified
poly (AN-co-DVB-80) at different mass of adsorbent dosage
16.Figure 16 Amount of mefenamic acid that was absorbed by the adsorbent at different
List of Tables
1. Table 1 Concentration of pharmaceuticals detected in Langat River and STPs effluents
(ngL-1)
2. Table 2 Monomers in feed for the synthesis of poly (AN-co-DVB-80) in a mixture of
acetonitrile and toluene
3. Table 3 Yields of polymerisation of poly (AN-co-DVB-80) with different ratios
4. Table 4 IR wavenumber of poly (AN-co-DVB-80), thioamide-modified poly (AN-
co-DVB-80) and thioamide-modified poly (AN-co-DVB-80)-HSO3
5. Table 5 Size and dispersity of poly (AN), poly (DVB-80) and poly (AN-co-DVB-80)
6. Table 6 BET data of the poly (AN-co-DVB-80) with different ratios
7. Table 7 BET data of the poly (AN-co-DVB-80), thioamide-modified poly (AN-co -DVB-80) and thioamide- HSO3-modified poly (AN-co-DVB-80)
8. Table 8 Elemental Microanalysis data of poly (AN), poly (DVB80) and poly (AN-co -DVB-80) with different ratios
Figure 1 Mefenamic acid
Figure 2 The synthesis of poly (AN-co-DVB-80)
Figure 4 Sulphonation of thioamide-modified poly (AN-co-DVB-80) with sulphuric acid
Figure 5 Anions of mefenamic acid
Figure 7 IR Spectra of the poly (AN-co-DVB-80) with different ratios
Figure 8 IR Spectra of the poly (AN-co-DVB-80), hydrolysed poly (AN-co-DVB-80) and thioamide-modified poly (AN-co-DVB-80)
P33
P30 (0.20:0.80)
P31 (0.25:0.75)
P32 (0.40:0.60)
hydrolysed P33
P33 (0.50:0.50)
P34 (0.80:0.20)
Figure 9 IR Spectra of poly (AN-co-DVB-80), thioamide-modified poly (AN-co-DVB-80) and thioamide- HSO3-modified poly (AN-co-DVB-80)
Figure 10 SEM images of poly (AN) and poly (DVB-80)
P33
TP33
TP33-HSO3
P29 poly (AN-co -DVB-80) (1.00:0.0)
Figure 11 SEM images of poly (AN-co-DVB-80) with different AN/DVB-80 ratios P30 poly (AN-co-DVB-80)
0.20:0.80
P32 poly (AN-co-DVB-80) 0.40:0.60
P33 poly (AN-co-DVB-80) 0.50:0.50
P34 poly (AN-co-DVB-80) 0.80:0.20
P31 poly (AN-co-DVB-80)
Figure 12 SEM images of poly (AN-co-DVB-80), thioamide-modified poly (AN-co-DVB-80),
and thioamide- HSO3-modified poly (AN-co-DVB-80)
(a)
-1 4 9 14 19 24 29 34
0 5 10 15 20 25 30
0.25 0.5 0.75 1 1.25 1.5 1.75 More
F
re
que
n
cy
Diameter of the polymer (µm)
Polynomial Data of P30
P33 poly (AN-co-DVB-80) TP33 thioamide-modified poly (AN-co-DVB-80)
TP33-HSO3 thioamide-modified poly (AN-co
(b)
(c)
Figure 13 Polynomial Data of (a) P30, (b) P31 and (c) P32
-0.5 4.5 9.5 14.5 19.5 24.5 29.5 0 5 10 15 20 25 30
0.5 1 1.5 2 2.5 3 3.5 More
F
re
que
n
cy
Diameter of the polymer (µm)
Polynomial Data of P31
-1.5 3.5 8.5 13.5 18.5 23.5 28.5 33.5 38.5 43.5 0 5 10 15 20 25 30 35 40 45
0.5 1 1.5 2 2.5 3 More
F
re
que
n
cy
(a)
(b)
Figure 14 (a) Adsorption capacity and (b) percentage of mefenamic acid (MA) adsorbed by sorbents at different MA concentration
Experimental condition: 50 mg of sorbent, 20 mL of sample volume, 24 h of contact time, stirred at 4500 rpm under room temperature
P33 = poly (AN-co-DVB-80), TP33 = thioamide-modified poly (AN-co-DVB-80), TPP-HSO3 = thioamide- HSO3-modified poly (AN-co-DVB-80)
0.00 20.00 40.00 60.00 80.00 100.00 120.00
20 40 60 80 100 120 140 160 180 200 220 240 260 280 300
A d so rp ti o n C ap ac it y, q e ( m g/ g) Concentration (ppm) P33 TP33 TP33-HSO3 0.00 10.00 20.00 30.00 40.00 50.00 60.00 70.00 80.00 90.00
20 40 60 80 100 120 140 160 180 200 220 240 260 280 300
(a)
Figure 15 (a) Adsorption capacity and (b) percentage of mefenamic acid adsorbed by sorbents at different sorbent dosage
Experimental condition: 20 ppm of mefenamic acid, 20 mL of sample volume, 24 h of contact time, stirred at 4500 rpm under room temperature
P33 = poly (AN-co-DVB-80), TP33 = thioamide-modified poly (AN-co-DVB-80), TPP-HSO3 = thioamide- HSO3-modified poly (AN-co-DVB-80)
1.51 1.99 2.51 2.81 3.09 2.65 3.13 3.71 4.22 4.60 2.78 3.79 4.33 4.96 5.21 0.00 1.00 2.00 3.00 4.00 5.00 6.00
10 20 30 40 50
A d so rp ti o n C ap ac it y, q e (m g/ g)
Mass of adsorbent (mg)
Graph of the amount of Mefenamic Acid adsorbed with different mass of adsorbent
P33 TP33 TP33-HSO3 18.93 24.89 31.39 35.15 38.67 33.15 39.08 46.41 52.81 57.45 34.76 47.35 54.09 62.01 65.13 0.00 10.00 20.00 30.00 40.00 50.00 60.00 70.00 80.00
10 20 30 40 50
P er ce n ta ge (%)
Mass of adsorbent (mg)
Graph of the amount of Mefenamic Acid adsorbed with different mass of adsorbent dosage
(a)
Figure 16 (a) Adsorption capacity and (b) percentage of mefenamic acid adsorbed by sorbents at different contact time
Experimental condition: 50 mg of sorbent, 20 ppm of mefenamic acid, 20 mL of sample volume, stirred at 4500 rpm under room temperature
P33 = poly (AN-co-DVB-80), TP33 = thioamide-modified poly (AN-co-DVB-80), TPP-HSO3 = thioamide- HSO3-modified poly (AN-co-DVB-80)
1.39 1.87
2.51 2.57 2.61
2.53
3.49 3.71 4.10
4.11 2.66 3.55 4.21 4.84 4.85 0.00 1.00 2.00 3.00 4.00 5.00 6.00
1 3 6 12 24
A d so rp ti o n C ap ac it y ,q e (m g/ g)
Contact time (hours)
Graph of the amount of Mefenamic Acid adsorbed with different contact time
P33 TP33 TP33-HSO3
17.41
23.37
31.39 32.11 32.59
31.63 43.63 46.41 51.29 51.37 33.25 44.32 52.57 60.49 60.58 0.00 10.00 20.00 30.00 40.00 50.00 60.00 70.00
1 3 6 12 24
P e rc en ta ge (%)
Contact time (hours)
Graph of the amount of Mefenamic Acid adsorbed with different contact time
Table 1 Concentration of pharmaceuticals detected in Langat River and STPs effluents (ngL-1)
[11]
Analyte
Concentration, ngL-1
River Water STPs effluent
Acetaminophen 10 70
Amlodipine <MDL <MDL
Atenolol 46 107
Chlorpheniramine <MDL <MDL
Cyproterone <MDL <MDL
Loratadine <MDL <MDL
Lovastatin <MDL 10
Metformin 293 16
Metoprolol <MDL 364
Nifedipine <MDL <MDL
Norethindrone <MDL 188
Levonogestrel 38 <MDL
Perindopril 8 16
Salbutamol <MDL 3
Simvastatin <MDL <MDL
Chlorothiazide 182 865
Diclofenac 17 217
Furosemide 9 175
Glibenclamide 2 5
Gliclazide 4 65
Mefenamic acid 13 146
Salicylic acid 34 36
Table 2 Monomers in feed for the synthesis of poly (AN-co-DVB-80) in a mixture of
acetonitrile and toluene
Sample AN mole fraction DVB-80 mole fraction AN, mL DVB-80, mL
P30 0.20 0.80 0.4566 3.9034
P31 0.25 0.75 0.5906 3.7867
P32 0.40 0.60 1.0551 3.3821
P33 0.50 0.50 1.4299 3.0557
Table 3 Yields of the polymerisation of poly (AN-co-DVB-80) with different ratios
Sample Mole fraction of AN: DVB-80 Yields, %
P29 0:1.00 45.60
P30 0.20:0.80 88.80
P31 0.25:0.75 82.68
P32 0.40:0.60 80.56
P33 0.50:0.50 78.00
P34 0.80:0.20 68.80
P35 1.00:0 25.50
Table 4 IR wavenumber of poly (AN-co-DVB-80), thioamide-modified poly (AN-co-DVB-80) and thioamide-modified poly (AN-co-DVB-80)-HSO3
Functional groups Poly (AN-co-DVB-80) Thioamide modified poly (AN-co-DVB-80) Thioamide modified poly (AN-co-DVB-80)-HSO3
Wavenumber, cm-1
NH2 - 3347.90-3360.29 3347-3360.29
CH, CH2, CH3 2800-3000 2925.22-2928.81 2925.22-2928.81
C≡N 2173.32 - -
C=O 1700 - -
C=N-O 1502.47-1505.04 - -
HNC=S - 940-1140 940-1140
C=S - 1050-1200 1050-1200
C=C aromatic ring 1600-1650 1600-1650 1649.49
O-SO2 - - 1154.47
O-H (weak band) - - 1440.69
Table 5 Size and dispersity of poly (AN), poly (DVB-80) and poly (AN-co-DVB-80)
Sample
Mole fraction of
AN: DVB-80 Mean particle diameter, μm Coefficient of variation, % Cv Dispersity, σ
P35 1.00:0 Agglomerated clusters - -
P34 0.80:0.20 Lumps - -
P33 0.50:0.50 Small particles - -
P32 0.40:0.60 1.50 22.50 polydisperse
P31 0.25:0.75 1.93 40.04 polydisperse
P30 0.20:0.80 0.93 27.13 polydisperse
Table 6 BET data of the poly (AN-co-DVB-80) with different ratios
Sample Mole fraction of
AN: DVB-80
Surface area, m2g-1 Volume pores,
cm3g-1
Pore size,
nm
P30 0.20:0.80 793 0.823 2.3
P31 0.25:0.75 762 0.763 2.8
P32 0.40:0.60 627 0.528 3.2
P33 0.50:0.50 565 0.467 5.8
P34 0.80:0.20 27 0.159 23.9
Table 7 BET data of the poly (AN-co-DVB-80), thioamide-modified poly (AN-co-DVB-80) and thioamide-modified poly (AN-co-DVB-80)-HSO3
Sample Mole fraction of AN: DVB-80
Surface area, m2g-1
Volume pores, cm3g-1
Pore size, nm
P33
0.50:0.50
565 0.673 5.8
TP33 330 0.582 7.0
TP33-HSO3 4 0.554 552.8
Table 8 Elemental Microanalysis data of poly (AN), poly (DVB80) and poly (AN-co-DVB-80) with different ratios
Sample Mole fraction of AN: DVB80 (%)
Elemental Microanalysis (%)
C H N
Expected Found Expected Found Expected Found
P29 0:100 91.6 88.3 8.0 7.8 0.3 0.2
P30 0.20:0.80 90.0 85.2 7.6 7.3 2.4 2.7
P31 0.25:0.75 89.4 83.6 7.5 7.2 3.2 3.0
P32 0.40:0.60 87.1 84.8 7.3 7.3 5.6 4.6
P33 0.50:0.50 85.2 81.7 7.2 7.1 7.6 5.1
P34 0.80:0.20 77.2 75.5 6.5 6.7 16.4 9.7
Table 9 Elemental Microanalysis data of poly (AN-co-DVB-80), thioamide-modified poly (AN-co-DVB-80), and thioamide- HSO3-modified poly (AN-co-DVB-80)
Type of composition
Sample
P33 TP33 TP33-HSO3
Elemental Microanalysis, %
C 81.7 76.26 50.96
H 7.1 7.1 6.076
N 5.1 5.7 3.31