Scholarship@Western
Scholarship@Western
Electronic Thesis and Dissertation Repository
8-28-2017 12:00 AM
The genetic improvement of protein quality in common bean
The genetic improvement of protein quality in common bean
(Phaseolus vulgaris L.)
(Phaseolus vulgaris L.)
Rosa Cecilia Viscarra Torrico
The University of Western Ontario
Supervisor
Dr. Frederic Marsolais
The University of Western Ontario Dr. Kathleen Hill
The University of Western Ontario Graduate Program in Biology
A thesis submitted in partial fulfillment of the requirements for the degree in Master of Science © Rosa Cecilia Viscarra Torrico 2017
Follow this and additional works at: https://ir.lib.uwo.ca/etd
Part of the Life Sciences Commons
Recommended Citation Recommended Citation
Viscarra Torrico, Rosa Cecilia, "The genetic improvement of protein quality in common bean (Phaseolus vulgaris L.)" (2017). Electronic Thesis and Dissertation Repository. 4865.
https://ir.lib.uwo.ca/etd/4865
This Dissertation/Thesis is brought to you for free and open access by Scholarship@Western. It has been accepted for inclusion in Electronic Thesis and Dissertation Repository by an authorized administrator of
Abstract
The common bean (Phaseolus vulgaris L.) has a high seed protein content, between 20 and 30%. The protein quality in common is considered low because of the
suboptimal levels of methionine and cysteine in the seed. Phaseolin, the main seed
storage protein, accounts for 30-50% of the total seed protein content. Phaseolin only
contains about 0.5 to 0.80% methionine. The suggested nutritional requirements for
methionine-cysteine in the human diet are between 2.5 and 2.6 %. Previous studies on
the germplasm SMARC1N-PN1 showed that deficiency in phaseolin and lectins leads
to increased methionine-cysteine up to 2.6% in the bean seed. Dr. Hou, the bean
breeder in Manitoba, made a cross between SMARC1N-PN1 and Morden-003. One
Hundred and eighty-five recombinant inbred lines (RILs) F2:8 were obtained of this
cross through eight generations of inbreeding. In this study I used SDS-PAGE to
assess the protein profiles of the RILs according to the phenotypic expression for
phaseolin and lectins. The RILs deficient in phaseolin and lectins increased their total
methionine-cysteine seed content up to 3.4%. Field trials were conducted to assess
the impact of the protein deficiency on the RILs’ agronomic traits. The RILs deficient
in phaseolin and lectins had a similar agronomic performance as Morden-003 thus
can be considered Canadian elite germplasm to develop common bean cultivars with
improved protein.
Key-words: Phaseolus vulgaris, SDS-PAGE, phaseolin, methionine, cysteine,
Dedication
To my beloved ones in my family for being the core of my life To Moisés for bringing countless joy to my life
To René for being a special part in my life
Acknowledgements
I would like to thank my supervisor Dr. Frédéric Marsolais for granting me the
opportunity to be part of his research group at Agriculture and Agri-Food
Canada-London Research and Developing Center. I sincerely appreciate his laboratory
resources and provisions, his financial backing and his scientific guidance throughout
my graduate studies. The experience I gained during the execution of the bean
breeding project will certainly be of great usefulness in my future career.
I am sincerely thankful to my co-supervisor Dr. Kathleen Hill for her guidance along
my Master Studies at the University of Western Ontario. Her comments and
suggestions enriched the content of my proposal and my thesis. I am grateful for the
efforts and the time Dr. Hill invested in preparing me to succeed in my proposal
assessment. I also would like to express my gratitude to Dr. Hill for her
encouragement during the writing of my thesis.
I am thankful to my advisory committee members Dr. Yuhai Cui for his suggestions
and comments to my proposal and my thesis and to Dr. Ben Rubin for his assistance
and guidance in the statistical analyses of the data. I also want to acknowledge the
assistance of the bean breeder in Manitoba Dr. Anfu Hou for his advice in the
breeding part of my thesis. The execution of my research project was funded by the
Manitoba Pulse Grower Association. Thanks to the Department of Biology at
Western University for granting me the opportunity to continue with graduate studies.
I appreciate the help of the field and greenhouse staff at the London Research and
Development Centre during the field trials. I appreciate the training provided by the
librarian Michelle Bargel in the use of EndNote.
I would like to thank the Marsolais laboratory members: Sudhakar Pandurangan and
support. Present and past lab colleagues: Alpa Puri, Gabrielle Song, Joshi Jaya,
Ebenezer Ajewole, and Dr. Marwan Diapari for their fellowship. Special thanks to
Shrikaar Kambhampati a great fellow in the lab who was always ready to assist me
even in times when he was very busy and to share with me his scientific knowledge.
My friend Jie Shu made my stay in the Research Centre and also at Western
Table of contents
Abstract………i
Dedication………....ii
Acknowledgements……….iii
Table of contents……….v
List of Tables………...x
List of Figures………...xii
List of Abbreviations………xiv
Chapter 1: Introduction………..1
1.1 Research question………1
1.2 Background………..2
1.3 Seed storage proteins of common bean………...3
1.3.1 The common bean seed storage protein composition………...3
1.3.1.1 The G-2 globulin fraction………..4
1.3.1.2 The prolamin fraction………5
1.3.1.3 The albumin fraction………..5
1.3.1.4 The G-1 globulin fraction………..6
1.4 The importance of sulphur in the human body………9
1.5 Methionine and cysteine in proteins………..10
1.6 Quantitative variation of phaseolin for genetic improvement of seed protein quality in common bean………...12
1.8 Agronomic characteristics of the bean germplasm SMARC1N-PN1…………...20
1.9 Hypothesis……….20
1.10 Research objectives……….20
Chapter 2: Materials and Methods………..22
2.1 Plant material……….22
2.2 Determination of phaseolin and lectin protein profiles of the 177 field RILs…...22
2.2.1 Soluble protein extractions……….22
2.2.2 Sodium Dodecyl Sulphate-polyacrylamide Gel Electrophoresis (SDS-PAGE) analysis of the 177 field RILs………..23
2.2.3 Determination of the phaseolin and lectin protein profiles of the 185 RILs grown in the greenhouse in Morden………23
2.3 Methionine, cysteine, and S-methylcysteine quantification of the 185 RILs grown in the greenhouse at the Morden Research and Development Centre………23
2.3.1 Hydrolysis phase……….24
2.3.2 Oxidation phase………..24
2.3.3 Separation and quantification of amino acids by HPLC (High Performance Liquid Chromatography)……….25
2.4 Assessment of the agronomic traits of the parent lines Morden-003 and SMARC1N-PN1 and of the RILs of Population 1, Population 2, and Population 3………...26
2.4.1 Seed material and planting methodology………...26
2.5 Data analyses……….27
2.5.2 Methionine, cysteine, and S-methylcysteine quantification………...27
2.5.3 Data analyses on the assessment of the agronomic traits………...28
Chapter 3: Results……….29
3.1 Phaseolin and lectin protein profiles of the 185 RILs grown in the greenhouse in Morden……….29
3.1.1 Phaseolin and lectin protein profiles of the 177 RILs grown in the field in Morden……….31
3.2 Quantification of total methionine and cysteine and total S-methylcysteine of the parent lines Morden-003 and SMARC1N-PN1 and the RILs grown in the greenhouse at the Morden Research and Development Centre………..33
3.2.1 Quantification of total methionine and cysteine, and total S-methylcysteine performed at the London Research and Development Centre……….34
3.2.2. Quantification of total methionine, cysteine, and total S-methylcysteine performed at the SPARC Biocentre……….37
3.2.3 Quantification of total methionine, cysteine, and total S-methylcysteine of the RILs with SS protein profile grown in the field in London and Morden in the cropping season of 2014………..41
3.3 Assessment of the impact of major protein deficiency on the agronomic trait performance of the RILs with SS protein profile in two different locations………...44
3.3.1 Genotype by environment interaction………45
3.3.1.2 Days to flowering………46
3.3.1.3 Days to maturity………..48
3.3.1.5 Yield………48
3.3.1.6 Pod height………49
3.3.1.7 Hundred seed weight………...49
3.3.1.8 Growth type……….49
3.3.1.9 Lodging………51
Chapter 4: Discussion………53
4.1 Protein quality in common bean………53
4.2 Protein profiles of the common bean genotypes………53
4.3 Phaseolin as a biochemical and genetic marker………54
4.4 Sulphur amino acid content in the parent lines Morden-003 and SAMARC1N-PN1, and the RILs………55
4.5 Agronomic trait performance of the RILs deficient in phaseolin and lectins……58
4.5.1 Days to flowering………...58
4.5.2 Days to maturity……….60
4.5.3 Plant height……….61
4.5.4 Lodging………...62
4.5.5 Pod height………...63
4.5.6 Growth Type………...63
4.5.7 Hundred seed weight………..65
4.5.8 Yield………...66
Chapter 5: Conclusions……….68
5.1 Concluding remarks………...68
References………...70
List of Tables
Table 3.3.1-a A three-way ANOVA of agronomic traits between genotypes, location,
year and their interactions for the RILs of Population 2 across the two year trials
(2014-2015) and the two different locations (London and Morden)………...45
Table 3.3.1-b A three-way ANOVA of agronomic traits between genotypes, location,
year and their interactions for the RILs of Population 3 across the two year trials
(2014-2015) and the two different locations (London and Morden)………...46
Table 3.3.1.1-a Two year (2014-2015) average of days of flower, days to maturity,
plant height, yield, pod height, hundred seed weight, for the genotypes of Population
2 over two different trial sites: London, ON, and Morden, MB………..47
Table 3.3.1.1-b Two year (2014-2015) average of days of flower, days to maturity,
plant height, yield, pod height, hundred seed weight, for the genotypes of Population
3 over two different trial sites: London, ON, and Morden, MB………..47
Table 3.3.1.1-c Two year (2001-2002) average of days to flower, days to maturity,
yield, hundred seed weight, growth type, and lodging for Morden-003 navy bean
cultivar over seven trial sites in the Eastern Prairie……….47
Table 3.3.1.8-a Growth type for the parent lines and the field RILs with SS protein
profile of Population 2……….50
Table 3.3.1.8-b Growth type for the parent lines and the field RILs with SS protein
profile of Population 3……….51
Table 3.3.1.9-a Lodging for the parent lines and the field RILs with SS protein profile
Table 3.3.1.9-b Lodging for the parent lines and the field RILs with SS protein profile
List of Figures
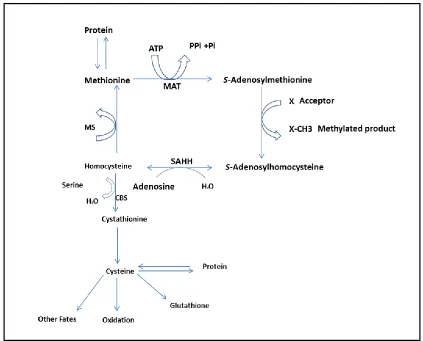
Figure 1.5 Major pathways of methionine and cysteine metabolism in the human body……….12
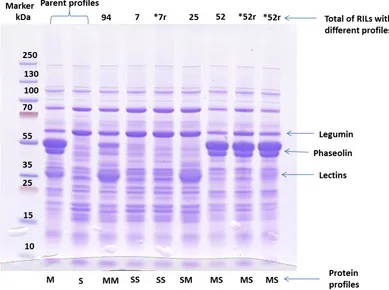
Figure 3.1 SDS-PAGE of phaseolin and lectin profiles for the parent lines
Morden-003 and SMARC1N-PN1 and the RILs grown in the greenhouse in Morden………30
Figure 3.1.1 SDS-PAGE of phaseolin and lectin profiles for the parent lines
Morden-003 and SMARC1N-PN1 and the RILs grown in the field in Morden in 2013……..32
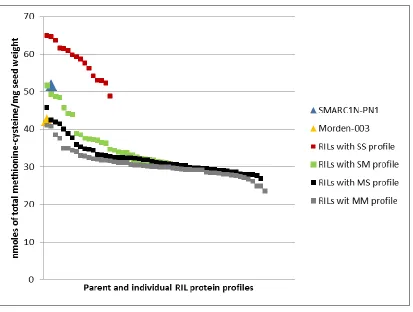
Figure 3.2.1-a Total methionine-cysteine concentration in mature seeds of the parent
lines Morden-003 and SMARC1N-PN1, and the RILs with different protein profiles
grown in the greenhouse in Morden………36
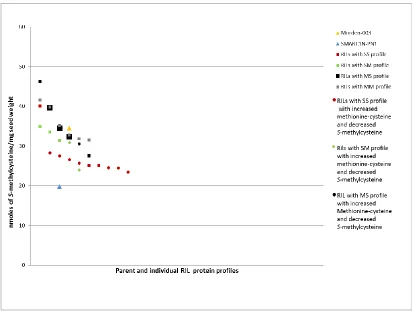
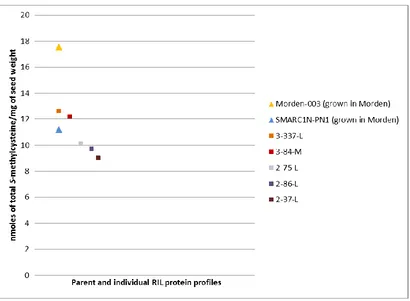
Figure 3.2.1-b Total S-methylcysteine concentration in mature seeds of the parent lines Morden-003 and SMARC1N-PN1, and the RILs with different protein profiles
grown in the greenhouse in Morden………37
Figure 3.2.2-a Total methionine-cysteine concentration in mature seeds of the parent
lines Morden-003 and SMARC1N-PN1, and the twenty-seven RILs with different
protein profiles grown in the greenhouse in Morden………...39
Figure 3.2.2-b Total S-methylcysteine concentration in mature seeds of the parent lines Morden-003 and SMARC1N-PN1, and the twenty-seven RILs with different
protein profiles grown in the greenhouse in Morden………...40
Figure 3.2.3-a Total methionine-cysteine concentration in mature seeds of the parent
lines Morden-003 and SMARC1N-PN1, and the RILs with SS protein profile grown
Figure 3.2.3-b Total S-methylcysteine concentration in mature seeds of the parent lines Morden-003 and SMARC1N-PN1, and the RILs with SS protein profile grown
List of Abbreviations
ANOVA analysis of variance
◦
C degrees Celsius
CBC cystathione β-synthase
CaCl2 calcium chloride
CGL cystathione γ-lyase
cm centimeter
DTF days to flowering
DTM days to maturity
DTT dithiothreitol
FDL fluorescence Detector
g grams
G×E genotype by environment
GT growth type
ha hectare
HCl hydrochloric acid
hr hour
HPLC high performance liquid chromatography
HSW hundred seed weight
kDa kilodaltons
KCl potassium chloride
m2 square meter
MAT methionine adenosyltransferase
MB Manitoba
MES 2-(N-morpholino) ethanesulfonic acid
mg milligram
min minute
ml milliliter
mM millimolar
mm millimeters
N normal
mRNA messenger ribonucleic acid
MS methionine synthase
ON Ontario
OPA o-phthalaldehyde
PDCAAS protein digestibility corrected amino acid score
PDH pod height
pH potential of hydrogen
PMSF phenylmethylsulfonyl fluoride
PHT plant height
PITC phenylisothiocyanate
pmoles picomoles
PTC phenylthiocarbamyl
SAM S-adenosylmethionine SAH S-adenosylhomocysteine
SDS sodium dodecyl sulfate
SDS-PAGE sodium dodecyl sulfate polyacrylamide gel electrophoresis
SSD single seed descent
-SH functional group composed of a sulphur and hydrogen atom
SPARC Biocentre Sickkids Proteomics, Analytics, Robotics and Chemical
Biology Centre
SPSS Statistical Package for the Social Sciences
S-S disulfide bridges
tRNA transfer ribonucleic acid
µl microliter
µm micrometer
w/v weight/volume
Chapter 1: Introduction
1.1 Research question
The common bean seed has a high protein content, between 20 and 30% (Kelly
and Bliss, 1975; Sathe, 2002) The seed protein quality is considered low because of
the suboptimal levels of the protein sulphur amino acids. The common bean seed
contains about 1.9% of total methionine-cysteine depending on the cultivar (Ma and
Bliss, 1978; Sathe, 2002). Phaseolin is the main storage protein in common bean
seed. Phaseolin represents up to 50% of the seed protein content (Chagas and
Santoro, 1997); therefore phaseolin is the main source of methionine in the bean seed.
The methionine content in phaseolin is between 0.5 and 0.80% depending on the
commercial cultivar (George et al., 1993; Sathe, 2002; Montoya et al., 2010), which
is considered low. The nutritional requirements for methionine-cysteine in the human
diet are between 2.6 and 2.5%, equivalent to between 26 and 25 mg
methionine-cysteine g-1 protein (Young and Pellett, 1991; Montoya et al., 2010).
Since phaseolin is the main storage protein in common bean seed, former
common bean programs to improve the seed protein quality were designed to increase
the phaseolin content. Previously, increased phaseolin contents were achieved
through crosses between two common bean cultivars with high seed protein content
(Gepts and Bliss, 1984). Through this strategy Gepts and Bliss (1984) were able to
improve the methionine content in phaseolin up to 0.9% (9 mg g-1 phaseolin protein)
in some common bean commercial cultivars. However, this increase is still below the
nutritional requirements. In this thesis research, an alternative approach on improving
the seed protein quality in common bean is evaluated based on the work of Taylor et
al. (2008). The research of Taylor et al. (2008) revealed that the total methionine and
cysteine content was raised from 1.8% (18.9 mg g-1 protein) in the bean germplasm
SARC1 to 2.6% (26.8 mg g-1 protein) in the bean germplasm SMARC1N-PN1. The
methionine and cysteine content in SMARC1N-PN1 is within the requirements for
arcelin, whereas SMARC1N-PN1 is deficient in all three seed storage proteins
(Hartweck and Osborn, 1997). In the present work, the protein quality of
Recombinant Inbred Lines (offspring of two genetically distant parents obtained
through eight generations of inbreeding) of common bean, deficient in phaseolin and
lectins, are evaluated for their protein quality. The Recombinant Inbred Lines (RILs)
with increased methione and cysteine will constitute an elite germplasm for
developing commercial common bean cultivars with improved protein quality.
1.2 Background
The common bean, Phaseolus vulgaris L., is widely cultivated for its edible seeds (Bliss, 1980). P. vulgaris is a diploid annual species (2n = 2x =22), and is predominantly self-pollinating (De Ron et al., 2015). Wild forms of P. vulgaris occur from northern Mexico to northwestern Argentina. There are three distinguishable
gene pools: from Mesoamerica, the Andean region and the northern Peru-Ecuador
(Debouck et al., 1993). The Mesoamerican and the Andean are the main gene pools
(Gepts, 1998; Bellucci et al., 2014). Phaseolus beans are the most important grain legume for direct human consumption (Gepts et al., 2008). Common bean is grown in
diverse regions such as Latin America, Africa, the Middle East, China, Europe, the
United States and Canada (FAOSTAT, 2014).
Latin America is the largest producer of common bean, with about 5.5 million
metric tons per year accounting for nearly 45% of the total world production
(CGIAR, 2012; FAOSTAT, 2014). The estimate of mean per capita consumption in
Latin America is between 10 and 13.3 kg/year (Leterme and Munoz, 2002;
Nedumaran et al., 2015). Africa is the second most important region, producing about
2.5 million metric tons yearly. The mean per capita consumption of dry bean in this
area is 31.4 kg (CGIAR, 2012; FAOSTAT, 2014). Because of its high content of
protein, the common bean is a major source of dietary protein in developing countries
where animal proteins are scarce (Broughton et al., 2003; Salcedo, 2008). In Brazil
2010), whereas in Central Africa it represents 50% of the dietary protein
(Namugwanya et al., 2014). The common bean complements carbohydrate-rich
sources such as rice, maize and cassava and is also a rich source of micronutrients
such as iron, zinc, thiamin and folic acid (Beebe et al., 2000; Gepts et al., 2008). Dry
beans on average contain, about 8 to 10% moisture, 50 to 60% total carbohydrates, 3
to 5% fiber, 3 to 4% ash (Deshpande and Damodaran, 1990) and 15 to 30% protein,
depending on the cultivar (Kelly and Bliss, 1975; Deshpande and Damodaran, 1990;
Messina, 1999; Sathe, 2002). Despite the high content of protein in common bean
seed, its quality is considered poor because of its low levels of the sulphur amino
acids methionine and cysteine, about 1%, depending on the cultivar (Evans and
Bandemer, 1967; Johnson et al., 1982).
1.3 Seed storage proteins of common bean
Many different names and criteria of classification have been given to the
seed storage proteins of Phaseolus bean (Danielsson, 1949; McLeester et al., 1973). This has led to a confusing nomenclature of the common bean seed storage proteins.
Some of this confusion was partially due to comparison of phaseolin, the major bean
globulin protein, to globulins commonly named as vicilins of other species of
legumes like Vicia faba, and Pisum sativum (Jackson et al., 1969; McLeester et al., 1973) and of species of gramineae like: Hordeum vulgare, and Secale cereale
(Danielsson, 1949). In the present thesis, the composition of the common bean seed
storage proteins follows the nomenclature of the research work of Romero et al.
(1975) and Sun and Hall (1975) who do not use the name of the phaseolin as
analogous to vicilin.
1.3.1 The common bean seed storage protein composition
The common bean seed storage protein fractions are: G-1 globulin, G-2
globulin, the alkali-soluble fraction, containing glutelin and albumin, and the
prolamin fraction (Romero et al., 1975; Ma and Bliss, 1978). The storage protein
bean lines. Isolated cotyledons were dried and ground. Because globulins of P.
vulgaris are soluble at acid pH values, Ma and Bliss (1978) made the extractions with L-ascorbic acid and NaCl following McLeester’s (1973) procedure. After
centrifugation of the extract, they obtained two phases: a pellet and a clear
supernatant. The clear supernatant contained the albumin, globulin and free amino
acids. Prechilled distilled water was added to the supernatant. The white, cloudy
precipitate which formed was separated by means of centrifugation and was referred
to as G-1 globulin protein. The clear supernatant containing the albumins, G-2 and
the free amino acids was dialyzed in distilled water and later centrifuged. The pellet
and the supernatant of the dialysate were referred to as G-2 and albumins fractions,
respectively. The pellet phase from the ascorbate-NaCl extraction was separated
using ethanol and NaOH solution and the separated fractions were referred to as
prolamin and glutelin fractions, respectively. The major protein fractions are the
globulins and the albumins. They account for up to 50 and 30% of the total seed
storage protein, respectively (Montoya et al., 2010; Oliveira et al., 2017), thus
providing the major contribution to the nutritional quality of the seed (Vitale and
Bollini, 1995; Oliveira et al., 2017).
1.3.1.1 The G-2 globulin fraction
The G-2 globulin fraction is composed of lectins (Romero et al., 1975); they
are also referred to as phytohemagglutinins for their ability to agglutinate cells (Bliss
and Brown, 1983; Osborn et al., 1983; Martínez-Aragón et al., 1995; Vitale and
Bollini, 1995; Sathe, 2002). Among the different legumes, P. vulgaris seed contains the highest amount of lectin. Lectins represent 10% of the total seed protein, (Pusztai
et al., 1979; Vitale and Bollini, 1995; Nasi et al., 2009) and have less than 0.5% of
protein sulphur-amino acids (Pusztai et al., 1979; Osborn and Brown, 1988; Vitale
and Bollini, 1995). Their coefficient of sedimentation is 6.6 S (Itoh et al., 1980).
Lectins are a family of highly homologous proteins. They are composed of
polypeptides with a molecular weight in a range of 27 to 37 kDa (Bliss and Brown,
lectins. The single-chains are tetramers of identical or nearly identical monomers. P.
vulgaris lectins are an example of this class (Bollini and Chrispeels, 1978). The α-amylase inhibitor lectin is processed post-translationally into α and β-chains (Moreno
and Chrispeels, 1989). Lectins are glycosylated proteins. The sugars involved in the
glycosylation of this protein are: glucosamine, xylose, and mannose (Ericson and
Chrispeels, 1973). Lectin proteins of raw beans are toxic to mammals (Pusztai et al.,
1975; Pusztai and Palmer, 1977; Grant et al., 1985), and birds (Jayne-Williams and
Burgess, 1974). In addition of their toxicity, bean flour contains antinutritional factors
such as trypsin and chymotrypsin inhibitors, and has poor digestibility and low
nitrogen retention (Pusztai et al., 1979). Several biological functions such as host
specificity in Rhizobium nodulation (Diaz et al., 1989) and in defense against seed-eating insects have been attributed to lectins. It appears that resistance to proteolytic
degradation by the insect digestive enzymes and binding to insect gut structures are
the requisites for lectins to exert their deleterious effects on insects (Murdock et al.,
1990; Vasconcelos and Oliveira, 2004). Arcelin is an example of an insecticidal
lectin. Arcelin has been named after Arcelia, a town in the state of Guerrero, Mexico,
where one of the accessions was collected. Arcelin is mostly found in seed proteins of
wild bean accessions (Osborn et al., 1986) . Marsolais et al. (2010) identified six
arcelin isoforms in the seed of the P. vulgaris germplasm SARC1. Lectin is produced during seed maturation, starting about 14 days after flowering (Sun et al., 1978).
1.3.1.2 The prolamin fraction
The prolamin has little impact on the total seed storage protein composition. It
constitutes a minor fraction, between 2 to 4% of the total seed storage protein (Bliss
and Brown, 1983; Oliveira et al., 2017).
1.3.1.3 The albumin fraction
The albumin fraction accounts for 12 to 30% of the total seed storage protein.
It comprises protein subunits in the range of 25 to 35 kDa. The albumin fraction is
Phaseolus seeds conducted by Natarajan et al. (2013) reports 8.4% of cysteine and 2.4 % of methionine in the albumin fraction. Ma and Bliss (1978) found an average
of 2% of methionine in the albumin fraction of ten F5 lines of Phaseolus vulgaris. Chagas and Santoro (1997) quantified an average of 2% of cysteine and between 1.3
to 2% of methionine in the albumin of three Brazilian cultivars of Phaseolus. Bhatty (1982) found 1.2% of methionine in the albumin fraction of the P. vulgaris cultivar Saxa.
1.3.1.4 The G-1 globulin fraction
The G-1 globulin fraction comprises the phaseolin and the legumin. The
legumin is a hexameric unglycosylated globulin with a sedimentation coefficient of
11S (Vitale and Bollini, 1995). Legumin is formed from six pairs of polypeptides
with a molecular weight of about 60 kDa each. The components of each of the pairs
are an acidic α subunit with a molecular weight of 40 kDa and a β subunit with 20
kDa (Vitale and Bollini, 1995; Mühling et al., 1997; Sathe, 2002; Yin et al., 2011).
Legumin represents 10% of the total seed storage proteins and has a low
concentration of the sulphur amino acids methionine and cysteine, 0.6% and 0.8%,
respectively (Derbyshire et al., 1976).
Phaseolin is the major globulin storage protein. It constitutes 40 to 60% of the
total seed storage proteins (Bliss and Brown, 1983; Chagas and Santoro, 1997).
Phaseolin’s nutritional value is limited by its low content of the sulphur amino acid
methionine, less than 1% and no cysteine at all (Chagas and Santoro, 1997; Natarajan
et al., 2013). Phaseolin is a glycoprotein with glucosamine, xylose and mannose
forming part of its structure (Ericson and Chrispeels, 1973; Bliss and Brown, 1983;
Sturm et al., 1987; Osborn and Brown, 1988). Phaseolin’s coefficient of
sedimentation is 7S. Phaseolin consists of 2 to 6 polypeptides with molecular weights
between 43 and 54 kDa (Osborn and Brown, 1988). The differences in molecular
weight and isoelectric point among the polypeptides reflect differences in DNA
polypeptides with 435 to 444 amino acid residues, and β-phaseolin polypeptides with
421 amino acid residues (Slightom et al., 1983). Early studies conducted by Brown et
al. (1981) using SDS-polyacrylamide gel electrophoresis identified three different
profiles for phaseolin. The profiles were named after the cultivars Tendergreen (T),
Sanilac (S), and Contender (C). Montoya et al. (2010) on their bean domestication
research found that for all the cultivars studied nearly 90% have the Tendergreen and
the Sanilac phaseolin type. De La Fuente et al. (2012) reported more than forty
different phaseolin profiles in wild and cultivated beans according to the polypeptide
composition. The Mesoamerican bean accessions exhibit the “S” (Sanilac), “M”
(Middle America), or “B” (Boyaca) types, while the Andean beans have the “T”
(Tendergreen), “C” (Contender), “H” (Huevo de Huanchaco), “A” (Ayacucho), “J”
(Jujuy) or “I” (Inca) phaseolin types. The “S” phaseolin type is mainly present in the
cultivars of Central America, from Mexico to the North of Colombia. The “T”
phaseolin type is mainly present in cultivars of the Andes, including the south of
Peru, Bolivia, Argentina and Chile (Beebe et al., 2001). Acquaah et al. (1994) studied
650 common bean accessions from Malawi in Africa for their phaseolin profile and
found that 49.2% had the “T” type, 24.8% the” C” type, 23.5% the “S” type and 2.5%
the “H” type.
The characterization of the Tendergreen, Sanilac and Contender phaseolin
protein bands is given by Bliss and Brown (1983). The “T” type has three
polypeptide subunits with different molecular weights (α 51, β 48, and γ 45.5), and a
minor subunit (γ 46). The “S” type consists of five major polypeptide subunits (α 49,
α 48.5, β 48, β 47, and γ 45), and one minor subunit (γ 46). The “C” type has
common subunits to both “T” and “S” type. It consists of six major subunits (α 51, α
49, β 48, β 47, γ 45.5, and γ 45) and one minor subunit (γ 46). The phaseolin subunits
variation can be explained in terms of mRNAs giving rise to polypeptides of different
molecular weights (Hall et al., 1978) and due to differential glycosylation of the
polypeptides (Hall et al., 1980). Two asparagine residues Asn252 and Asn341 are
Man-7 (mannose) attached to Asn252 and Man-9 attached to Asn341, whereas
polypeptides with only one glycan have a complex oligosaccharide Xylose-Man-3 at
Asn252 (Emani and Hall, 2008).
Phaseolin is encoded by a gene family formed by 6 to 10 co-dominant
interrupted genes (five introns and six exons) per haploid genome, organized in a
single close cluster on chromosome 7 (Talbot et al., 1984). Thus the genes controlling
the polypeptides of each of the phaseolin types are tightly linked, inherited in a block
like a single Mendelian gene (De La Fuente et al., 2012). Slightom et al. (1985)
reported that the family gene for phaseolin is divided into two sub-families: the α and
β family genes that encode the α and β phaseolin type, respectively. In the
Tendergreen variety these two gene families α and β differ in their coding regions by
the presence or absence, respectively, of 27 bp and 15 bp direct repeats (Slightom et
al., 1985; Anthony et al., 1990). The α genes encode fourteen additional amino acids.
Aside from these differences the α and β phaseolin genes show around 98% identity
(Slightom et al., 1985; Anthony et al., 1990), which supports that most of the
heterogeneity in the phaseolin polypeptides are due to post-translational processing,
as mentioned above. Also the polypeptide units α, β and γ of the Tendergreen cultivar
have similar amino acid composition, suggesting that they are encoded by a relatively
small multigene family (Slightom et al., 1985). Thirteen cDNA clones were grouped
according to the type of phaseolin polypeptide they encode, either α or β type; within
each group the phaseolin cDNA clones have the same pattern of restriction sites,
indicating that they are internally homologous (Slightom et al., 1985). Slightom et al.
(1983) reported three methionine and two cysteine residues for phaseolin out of a
total of 409 amino acid residues, including the signal peptide. The cysteines are
removed after proteolytic processing by removal of the signal peptide; (Cramer et al.,
1985; Cramer et al., 1987). Anthony et al. (1990) reported four methionine residues
for the Sanilac variety. The production of phaseolin in the seed was detectable 14
days after flowering, with the major accumulation continuing for 12 to 14 days (Sun
production of phaseolin in the seed of P. vulgaris is detectable fourteen days after flowering. They extracted proteins from the whole seed and from the cotyledon alone
as well from seeds that started to form between 10 to 31 days after flowering. The
electrophoretic separation showed phaseolin protein bands in seeds and cotyledons
formed fourteen days after flowering, with continuing increase in this protein for
seventeen days. The exponential accumulation of the phaseolin in the maturing seeds
corresponds to the time of rapid proliferation of the rough endoplasmic reticulum in
the bean cotyledon cells (Bollini and Chrispeels, 1979).
1.4 The importance of sulphur in the human body
Sulphur is the seventh most abundant mineral in the tissues of higher
vertebrates (Ingenbleek, 2006; Emsley, 2011). The skin, muscles, connective tissues
and bones are rich in sulphur (Soetan et al., 2010). The hair and nails that are made of
the protein keratin contain a large share of sulphur (Rogers et al., 2004). The element
sulphur plays a critical role in detoxification and is a built in molecule of glutathione,
one of the most important antioxidants that the body produces (Anderson, 1998; Wu
et al., 2004). It is well documented that sulphur compounds play a protective role
during immune response (Grimble, 2006). Sulphur is a non-metal element. It is the
second component in group VI of the periodic table of elements, situated just below
oxygen (Palego et al., 2015). It has 8 valences and oxidation states ranging from +6
(sulphate, SO42-) to -2 (sulphide, S2-). The most common oxidized form is sulphate
(SO42-) (Ingenbleek, 2006). Plants, microorganisms and fungi, unlike animals, are
able to reduce sulphate to sulphide (Bick and Leustek, 1998; Davidian and Kopriva,
2010; Takahashi, 2010) and to incorporate sulphur into organic metabolites,
producing a large variety of organic compounds (Parcell, 2002; Palego et al., 2015).
Among the organic compounds are the sulphur-containing amino acids methionine
and cysteine (Wirtz and Droux, 2005; Ingenbleek, 2006; García et al., 2015). They
constitute almost an exclusive dietary source of sulphur to the body (Parcell, 2002;
Ingenbleek, 2006). Plants are the most important source of methionine and cysteine
1.5 Methionine and cysteine in proteins
Methionine and cysteine are encoded by the standard genetic code. They are
called proteinogenic amino acids because they are incorporated into proteins
(Brosnan and Brosnan, 2006), thus they are taken into the human body as dietary
protein constituents. Methionine is an essential amino acid that cannot be synthesized
de novo in the human body and thus must be supplied in the diet (Wu, 2009; Palego et al., 2015). Cysteine enters into the human body in two ways: through
cysteine-containing foods or through a metabolic pathway that converts methionine to
cysteine. In the human body, the methionine metabolism begins with its activation to
S-adenosylmethionine (SAM) by methionine adenosyltransferase (MAT), (Figure 1.5). In mammals, SAM is the main methyl donor substrate (Griffith, 1987; Stipanuk
et al., 2006; Palego et al., 2015). SAM can donate its methyl group to a wide variety
of acceptors, including amino acid residues in proteins, DNA, RNA and small
molecules (Chiang et al., 1996; Laxman et al., 2013). SAM transfers the methyl
group to an acceptor and gets converted to S-adenosylhomocysteine (SAH). SAH is hydrolyzed to adenosine and homocysteine. Homocysteine can be remethylated to
methionine by methionine synthase (MS); in this manner, methionine can be
regenerated for reuse. The methionine cycle occurs in all body cells (Brosnan and
Brosnan, 2006). Homocysteine can also condense with serine to form cysteine by the
combined action of cystathione β-synthase (CBS) and cystathione γ-lyase (CGL). The
formation of cysteine from homocysteine is restricted to the liver, kidney, intestine
and pancreas (Brosnan and Brosnan, 2006). The conversion of methionine to cysteine
is an irreversible process. For this reason, methionine is a dietary essential amino
acid, regardless of cysteine availability. Methionine is vital in making proteins in the
body. Methionine is the initiation of mRNA translation by formyl-methionyl-tRNA.
Methionine is a constituent of nearly all polypeptidic molecules with greater
abundance in extracellular than in intracellular proteins (Ingenbleek, 2006). Cysteine
is unique among the twenty standard amino acids in that it contains a thiol group or
hydrogen atom (-SH). The sulfhydryl group is able to form disulphide bridges (S-S).
Disulfide bridge interactions are important in determining protein tertiary structure
(Wirtz and Droux, 2005; Wu, 2009; Palego et al., 2015). The biological function of a
protein as well its native state is dependent on the tertiary structure. If the native state
of a protein is disrupted its biological function is lost. Extracellularly, disulfide
bridges between cysteines increase the molecular stability of a protein. Disulphide
bridges are present in proteins linked to defense against bacteria and viruses like
immunoglobulins and T-cell receptors or structural proteins like keratin (Palego et al.,
Figure 1.5 Major pathways of methionine and cysteine metabolism in the human body. ATP = adenosine triphosphate, PPi = inorganic pyrophosphate, Pi = inorganic orthophosphate, MAT = methionine adenosyltransferase, SAHH = S-adenosylhomocysteine hydrolase, MS = methionine
synthase, CBS = cystathione β-synthase, X = acceptor molecule
1.6 Quantitative variation of phaseolin for genetic
improvement of seed protein quality in common bean
Depending on the cultivar, the total protein in common bean seed comprises
20 to 30% of total seed content (Delaney and Bliss, 1991; Sathe, 2002). Of the total
seed protein content, 40 to 50% corresponds to the globulin protein phaseolin (Ma
variation in seed protein content with minimum values of 19% and maxima of 32%
was found within a collection of seventy-three common bean genotypes from the
bean bank germplasm at the National Research Centre of Rice and Beans in southern
Brazil (Pereira et al., 2009). Mutschler and Bliss (1981) categorized the bean seed
protein content as: low when the seed protein content was around 19% or less,
moderate content was referred to as 25% seed protein, and high seed protein content
was considered above 28%. Most P. vulgaris lines with high seed protein content are snap bean cultivars, grown usually for their edible pods, or tropical dry bean
accessions (Bliss and Brown, 1983). Kelly (1971) first reported the snap bean ‘Bush
Blue Lakes 240 (‘BBL240’), to be high in total protein content. Other snap bean
cultivars with high protein content are ‘Endogava Z.N.’ and PI229815 with around
27.5% (Mutschler and Bliss, 1981). Some tropical common bean cultivars with high
seed protein content include ‘Bonita’ with 24% (Mutschler and Bliss, 1981), 15R-148
and ‘Porrillo 70’ with around 29% (Gepts and Bliss, 1984). Barampama and Simard
(1993) on a research study of nutrient composition and protein quality of thirteen
tropical common bean cultivars found an average of 22% of seed protein content with
one of the cultivars with as high as 27.5%. More recent studies on seed protein
content of common bean support the previous findings that tropical varieties have
high protein content. Silva et al. (2012) in a study of seed protein quantification of
one hundred common bean Brazilian cultivars found an average protein content of
25%, ranging from 19.6 to 30.4%. The studies on nutritional and mineral variability
in 52 accessions of common bean cultivars from Madeira Island revealed an average
seed protein content of 23% with variations between 18.5 to 29.6% (Gouveia et al.,
2014).
Since phaseolin constitutes the main storage protein fraction in the common
bean seed, studies on the quantification of phaseolin content have also been
conducted. A large variation in this globulin protein was found among different
common bean cultivars studied. Mutschler and Bliss (1981) quantified the total seed
WI74-2047, Oregon 58, Bonita, PI 229815, and Endogava Z.N. The percentage of total seed
protein ranged from 17.4 for Swedish Brown to 27.8% for Endogava Z.N. Variation
in the content of G-1 protein was also found within these cultivars, ranging from 32
to 50.8%. No correlation between total seed protein and G-1 protein content was
found among these cultivars. Oregon 58 and Bonita had a similar percentage of seed
protein 23.6 and 24%, respectively. However, Oregon 58 had a significantly higher
G-1 protein content (50.8%) than Bonita (45.1%). A similar situation was found for
PI229815 with 27.5% of total seed protein and Endogava Z.N. with 27.8%. The latter
has lower G-1 protein (47%) than PI229815 (49.6%). WI74-2047 has higher total
seed protein (18.5%) than Swedish Brown (17.4%) but lower G-1 protein, 32.9 and
43.3%, respectively.
A basic function of protein in nutrition is to supply adequate amounts of
needed amino acids. Despite phaseolin being the main storage protein in the common
bean seed, its quality is limited by the low content of the sulphur amino acid
methionine. Depending on the cultivars, the methionine content in the phaseolin
fraction is less than 1%, with ranges between 0.50 to 0.90% (Gepts and Bliss, 1984;
Montoya et al., 2010). The protein quality of food is assessed based on the amount of
essential amino acids relative to nutritional requirements and on the digestibility of
the proteins (Friedman, 1996; Vaz Patto et al., 2015). The Protein Digestibility
Corrected Amino Acid Score (PDCAAS) has been used for the past 20 years to
evaluate the protein quality based on the amino acid requirements of humans and
their ability to digest it (Boye and Ma, 2012). PDCAAS value ranges from 0 to 100
%. For common beans the PDCAAS values are lower, between 53 and 67%,
depending on the cultivar (Vaz Patto et al., 2015). Sgabrieri et al. (1979) found a
digestibility percentage of 60.5 to 65.5 in cooked beans of four Brazilian cultivars of
dry beans. The low digestibility of common bean proteins is attributed to trypsin
enzyme inhibitors, which contain a large number of disulfide bonds that are heat
Another measurement for determining protein quality is the biological value
of the protein. The biological value measures the percentage of the digested protein
that can be used in protein synthesis in the cells of the body. Biological values can
range from 0 to 100%. These values are related to the percentage of essential amino
acids required by the body. When one or more essential amino acids are missing or
present in low quantities, the protein has a low biological value. The common bean
has an average biological value of 58%, depending on the cultivar (Vaz Patto et al.,
2015). Sgabrieri et al. (1979) found biological values between 38.3 to 58.9% in four
Brazilian dry bean cultivars. Methionine and cysteine requirements (both together
considered) for an adult are between 25 to 26 mg g-1 of total protein(2.5 to 2.6%)
(Young and Pellett, 1991; Montoya et al., 2010). Total methionine is present in
common bean seed in an average of 12 mg g-1 (1.2%) of total seed protein (Montoya
et al., 2010). The average methionine content in the phaseolin fraction is about 9 mg
g-1 protein (0.9%) (Montoya et al., 2010), which is way far below the recommended
dietary intake.
The high variation in seed protein content between different cultivars
suggested a considerable opportunity for protein quality improvement through
traditional breeding (Bliss and Brown, 1983). Since phaseolin is the main seed
protein fraction, it constitutes the major contributor to available methionine in all
common bean cultivars developed hitherto. The strategy of previous conventional
common bean breeding programs on improving the sulphur amino acid content was
to increase the percentage of phaseolin. Gepts and Bliss (1984) studied the
relationship between available methionine concentration and the levels of phaseolin
using three groups of genetic material: a) F2 progeny of interspecific crosses between
twelve P. vulgaris cultivars and a P. coccineus cultivar (‘Mexican Red Runner’) which lacks phaseolin; b) F2 progeny of the cross between five P. vulgaris cultivars and a wild Mexican accession (‘PI325690-3’), which has a dominant gene encoding
‘Sanilac’ and ‘15R-148’, which is a high non-phaseolin protein line. For each cross,
the F2 progenies were analyzed for total seed protein content, phaseolin content (the
presence or absence of phaseolin was detected by rocket immunoelectrophoresis), and
available methionine concentration, as percent of seed flour. A paired t-test was conducted (Gepts and Bliss, 1984). For the intergeneric cross with P. coccineus only three F1 lines had viable seeds that produced F2 progeny. The F2 seeds without
phaseolin showed a small but significant reduction in total protein concentration
ranging from 26.1 to 27.7% compared to the 26.8 to 31.6% for those containing
phaseolin: Similarly, seeds containing phaseolin (35 to 45.7%) had significantly
higher available methionine (0.68 to 0.82%) compared to seeds without phaseolin
(0.59 to 0.69%). In the F2 progeny of the second cross, no significant differences in
protein concentration were found between the seeds with high phaseolin (50.8 to
61.6%) and low phaseolin (25.2 to 33.6%). The ranges of protein concentrations for
seeds with high phaseolin were between 26 to 29.7%. The seeds with low phaseolin
had a percentage of protein content between 23 and 30. As for the methionine, the
seeds with higher phaseolin levels had higher available methionine in the range of
0.74 to 0.90%. The available methionine for the seeds with lower phaseolin content
was between 0.57 to 0.60%. For the F2 progenies of the third cross between ‘Sanilac’
and ‘Bush Blue Lake 240’, and between ‘Sanilac’ and ‘15R-148’, Gepts and Bliss
(1984) provide the coefficient of correlation for the results of the protein, phaseolin
and methionine quantification. The F2 progenies from the cross between ‘Sanilac’ and
‘Bush Blue Lake 240’ show a high coefficient of correlation (0.78) between available
methionine and protein content. There is also a high coefficient of correlation (0.74)
between available methionine and phaseolin content. The F2 progenies of the cross
between ‘Sanilac’ and ‘15R-148’ show a low correlation (0.45) between available
methionine and protein content. No correlation was found between available
methionine and non-phaseolin protein concentration. This suggests that the reduction
in available methionine in the non-phaseolin seed was due primarily to the absence of
phaseolin. Gept and Bliss (1984) concluded that available methionine was positively
The more recent findings of Taylor et al. (2008) that increased methionine and
cysteine in some common bean lines was due to a deficiency of phaseolin and lectins
opened a new possibility to increase the protein quality in common bean. Thus, the
bean breeding program in Canada took the strategy of decreasing the percentage of
phaseolin for improving the sulphur amino acid content in the bean seed. Taylor et al.
(2008) evaluated the protein profile, the protein content, the total protein amino acids,
and free amino acids in mature seeds of the germplasm lines: SARC1,
SMARC1-PN1, and SMARC1N-PN1. The three common bean lines are genetically related;
Sanilac is the parental background. They share approximately 85% of the parental
genetic background. The three lines integrate a progressive deficiency in major seed
storage proteins: phaseolin, phytohemagglutinin and arcelin. SARC1 contains the “S”
type phaseolin derived from Sanilac (Taylor et al., 2008) and phytohemagglutinin and
arcelin derived from the wild parent due to tight linkage between phytohemagglutinin
and arcelin genes (Osborn et al., 1986; Kami et al., 2006). Recessive null alleles
conferring phaseolin or phytohemagglutinin deficiency from P. coccineus and “Great Northern 1140”, respectively, were introgressed in the SARC1 genetic background.
The introgression of the arcelin-1 allele can lower the phaseolin content from about
50 to 14% of total protein (Romero et al., 1986). SAMARC1-PN1 is deficient in
phaseolin; SMARC1N-PN1 is deficient in all three major seed storage proteins
(Hartweck and Osborn, 1997). The analysis of the protein profile by Sodium Dodecyl
Sulfate-Polyacrylamide Gel Electrophoresis (SDS-PAGE) revealed the presence of
two major bands of 49 and 46 kDa in SARC1, corresponding to γ and α-β
glycopolypeptides of “S” type phaseolin, respectively. However, the amount of
phaseolin in SARC1 was much less than in the parental line Sanilac. These two bands
were absent in the phaseolin deficient lines SMARC1-PN1 and SMARC1N-PN1.
Two bands of 35 kDa and 32 kDa corresponding to arcelin (Hartweck et al., 1991)
and phytohemagglutinin (Vitale and Bollini, 1995), respectively, were found in
SARC1 and SMARC1-PN1 but were absent in SMARC1N-PN1. The total seed
protein content for the three lines was between 14.8 to 17.8%, not significantly
the three lines. SMARC1N-PN1 showed a significantly higher content (7.40%)
compared to SMARC1-PN1 (5.82%) and SARC1 (4.64%). The higher soluble
protein content in SMARC1N-PN1 was associated with phaseolin,
phytohemagglutinin, and arcelin deficiency. The total free amino acid content
increased by 52.94% and 104.4% in SMARC1-PN1 and SMARC1N-PN1,
respectively, as compared with SARC1. The individual free amino acid quantification
showed only a slight increase in free methionine in SMARC1-PN1, and
SMARC1N-PN1 as compared with SARC1. Free S-methylcysteine decreased by 2% and 25% in SMARC1-PN1 and SMARC1N-PN1, respectively, as compared with SARC1. Free
γ-Glu-S-methylcysteine notably decreased by 45.9% in SMARC1N-PN1. SMARC1-PN1 showed a reduction by 18.9% of free γ-Glu-S-methylcysteine. The total methionine-cysteine content increased from 1.8% (18.9 mg g-1 protein) in SARC1 to
2.6% (26.8 mg g-1 protein) in SMARC1N-PN1. The total methionine-cysteine content
in SMARC1N-PN1 is slightly above the 2.5% (25 mg g-1 protein) of the nutritional
requirements in the human diet (Young and Pellett, 1991). SMARC1-PN1 and
SMARC1N-PN1 showed decreased total S-methylcysteine, 0.9% and 0.6%, respectively, as compared with SARC1 (1.1%).
The most important finding of Taylor et al. (2008) was the increase in the
protein sulphur amino acids, as a response to seed storage protein deficiency. The
sulphur from S-methylcysteine and γ-Glu-S-methylcysteine was shifted preferentially to the protein cysteine pool in the storage protein deficient lines. To date, this is the
first report of a significant improvement in sulphur amino acid content in seeds of
common bean based on natural genetic variation in seed storage protein composition.
This opens the possibility to develop commercial common bean cultivars with
improved protein quality. Based on these findings, the bean breeder in Manitoba (at
the Morden Research and Developing Centre), Dr. Anfu Hou, made a cross between
Morden-003 (a commercial dry bean cultivar, well adapted to Manitoba and with
good agronomic performance) and the germplasm line SMARC1N-PN1. This cross
distant parents that were inbred through eight generations). Through genetic
recombination, some RILs will bedeficient in the main storage proteins and therefore
with increased sulphur amino acid content and will also have the desirable agronomic
traits of Morden-003. The RILs with increased sulphur amino acid content also have
to meet the standards of desirable agronomic traits for dry beans. This is a relevant
pre-requisite in order to consider the RILs as elite lines for developing new cultivars
from them with increased protein quality.
1.7 Agronomic characteristics of the navy bean cultivar
Morden-003
Morden-003 is a navy bean (Phaseolus vulgaris L.) cultivar developed at the Lethbridge Research and Development Centre, in Alberta (Mündel et al., 2004). The
final selection and testing was performed at the Morden Research and Development
Centre, in Manitoba. Morden-003 was issued the registration number 5603 by the
Variety Registration Office, Plant Production Division, Plant Products Directorate,
Canadian Food Inspection Agency, Nepean, Ontario, Canada. It was released as a
cultivar in 2003, after two years of narrow-row field trials testing (Mündel et al.,
2004). Morden-003 has desirable agronomic traits (Mündel et al., 2004). It is well
adapted to Manitoba for narrow-rows (23 cm spacing between rows) production. It is
an early maturity cultivar with an average of 101 days. The average number of days
to flower is 48. Morden-003 is resistant to the fungal disease anthracnose caused by
Colletotrichum lindemuthianum. Morden-003 is a high yielding cultivar with an average production of 2.9 tn ha-1. The hundred seed weight average of Morden-003 is
18.5 g. Acceptable weight of hundred seeds for commercial navy bean cultivars
ranges from 17.5 to 20.5 g (Adams et al., 1986; Uebersax and Siddiq, 2012).
Morden-003 has a determinate bush growth Type I with strong and erect stem and branches
(Mündel et al., 2004). The cultivated Phaseolus species have been classified into four growth habits: Type I bush determinate with erect stem, Type II bush indeterminate
with erect stem, Type III prostrate indeterminate, and Type IV climbing
5 scale, where 1 is upright and 5 prostrate). Lodging is defined as the tendency of a
plant to bend (Shah et al., 2016). Plants that are decumbent and with indeterminate
growth habit, tend to lodge during pod filling, resulting in pods very close to the
ground making them difficult to harvest (Eckert et al., 2011), and more exposed to
soilborne diseases (Botelho et al., 2013) like the white mold (Sclerotinia sclerotiorum). Plants with a growth Type I and II strongly favor the efficiency of harvesting (Eckert et al., 2011).
1.8 Agronomic characteristics of the bean germplasm
SMARC1N-PN1
The bean germplasm SMARC1N-PN1 was developed and released by the
Wisconsin Agricultural Experiment Station and the University of Wisconsin (Osborn
et al., 2003). It has the registration number GS-21. SMARC1N-PN1 has an average
of 20.7 g 100 seeds-1, which is in the range of the market class of dry beans. It has a
Type II growth habit, indeterminate bush with erect stem and branches. It is resistant
to anthracnose. SMARC1N-PN1 is a late maturing cultivar with an average of 115
days. It has low yield with an average of 1.5 tn ha-1 (Osborn et al., 2003).
1.9 Hypothesis
By modifying seed protein composition using selective breeding, protein
quality in the common bean seed can be improved.
1.10 Research objectives
1 To determine the protein profiles of a total of 177 RILs grown in the field,
by SDS-PAGE;
2 To quantify methionine, cysteine, and S-methylcysteine of a total of 185 RILs grown in the greenhouse, by HPLC (High Performance Liquid
3 To assess the effect associated with seed storage protein deficiency on the
agronomic trait performance of the RILs;
4 To evaluate the genotype by environment interaction (G×E) on the RILs’
Chapter 2: Materials and Methods
2.1 Plant material
Germplasm line SMARC1N-PN1 was crossed with the navy bean cultivar
Morden-003 by Dr. Anfu Hou at the Morden Research and Development Centre in
Morden, MB. Initially there were 3 F1 plants of this cross, which were self-fertilized
giving F2 plants. Each F2 plant gave rise to a “population”. Through eight generations
of inbreeding in the greenhouse, via Single Seed Descent (SSD), Dr. Hou obtained a
total of 185 RILs for the 3 populations (RILs are F2:8). The Population 1 has fifty-five
RILs, the Population 2 sixty-seven RILs, and the Population 3 sixty-three RILs. Dr.
Hou planted in the field the 185 RILs he obtained in the greenhouse. The planting
took place in May of 2013 at the Morden Research and Development Centre. From
the 185 RILs that initially were planted, the seeds of 177 RILs were harvested in late
September (Some RILs were lost in the field, the seeds did not germinate). In January
of 2014 the seeds of the 177 RILs were sent to Dr. Marsolais’ laboratory at the
London Research and Development Centre in London, ON to determine their protein
profile for phaseolin and lectins.
2.2 Determination of phaseolin and lectin protein profiles of
the 177 field RILs
2.2.1 Soluble protein extractions
Seed samples (1.2 g) of each of the 177 RILs were ground with a Kleco ball
mill. Soluble proteins were extracted from 50 mg ground tissue of each of the RILs
using 1 ml of cold extraction buffer (50 mM Tris-HCl pH 8.0, 50 mM KCl, 1mM
CaCl2, 10% glycerol) containing 1 mM phenylmethylsulfonyl fluoride (PMSF) and 1
mM dithiothreitol (DTT). Extracts were centrifuged twice at 25,000 ×g at 4◦C for 20 min. Supernatants were placed in a 1.5 ml tube on ice (Vanden Bosch et al., 1989) to
2.2.2
Sodium
Dodecyl
Sulfate-Polyacrylamide
Gel
Electrophoresis (SDS-PAGE) analysis of the 177 field RILs
Five µl of 4 × SDS protein sample buffer was added to 1.5 µl of the protein
extract in a 1.5 ml tube. Samples were vortexed, centrifuged for 2 min at room
temperature and heated at 99 ◦C for 5 min. Five µl of these protein samples were
loaded on a pre-cast NuPage Novex 4-12% gradient Bis-Tris gel with × 1 MES running buffer (life technologies) and visualized by Coomassie staining (Taylor et al., 2008) .
2.2.3 Determination of the phaseolin and lectin protein
profiles of the 185 RILs grown in the greenhouse in Morden
The 185 RILs grown in the greenhouse in Morden were sent in 2011 to the London
Research and Development Centre to determine their protein profile for phaseolin and
lectins. The assessment of the protein profiles was performed by the laboratory
technician Agnieszka Pajak following the same protocol described above for the
assessment of the protein profiles of the 177 field RILs.
2.3
Methionine,
cysteine,
and
S
-methylcysteine
quantification of the 185 RILs grown in the greenhouse at
the Morden Research and Development Centre
Seeds of the RILs grown in Morden in the greenhouse were sent to the
London and Research Development Centre for the quantification of methionine,
cysteine and S-methylcysteine. Of the 185 RILs, twenty-seven were sent in 2012 to the SPARC BioCentre in Toronto for the same purpose of quantifying methionine,
2.3.1 Hydrolysis phase
Hydrolysis needs to be performed in order to break the peptide bonds in the proteins
for amino acid quantification. Ten mg of ground seeds of each RIL (three biological
replications per sample; seeds were collected from three different plants of the same
genotype) were hydrolyzed in shell vials (8 × 40 mm) in the presence of 450 µl of 6 N HCl and 1% phenol (w/v) and 50 µl of 12 mM norvaline (it was used as an internal
standard). The shell glass vials were placed inside the reaction vials. Using an Eldex
Workstation the reaction vial was placed under vacuum for 1-2 seconds. Thereafter
the reaction vial was flushed with pre-purified nitrogen for 5 seconds. The above
steps were repeated twice. After the third flushing, the reaction vial was sealed under
vacuum and nitrogen flow. The reaction vial was placed in an oven (Johns Scientific)
for 24 hr at 110 ◦C. After 24 hr the samples were taken out of the oven and transferred
to 1.5 Eppendorf tubes. The samples in the Eppendorf tubes were centrifuged for 15
min at 20,000 × g. The supernatants were transferred to new 1.5 ml Eppendorf tubes. A 100 µl aliquot of each sample was placed in shell glass vials in the speedvacuum
evaporator (LABCONCO) for 1 hr. When the samples were dry, 500 µl of HPLC
water was added to each sample and left to stand for 10 min. Thereafter the samples
were transferred to 0.2 µm microfilter tubes (Life Sciences), and centrifuged for 2
min at 14,000 × g; the filters were removed (Fountoulakis and Lahm, 1998; Jafari et al., 2016).
2.3.2 Oxidation phase
Oxidation was performed only for cysteine, prior to the hydrolysis phase.
Oxidation is necessary because decomposition of cysteine residues occurs during
protein hydrolysis (Manneberg et al., 1995). Therefore, cysteine was determined as
cysteic acid (Hirs, 1967). Performic acid (oxidation solution) was prepared by adding
100 µl of 30% hydrogen peroxide to 900 µl of 88% formic acid in a screw-capped 1.5
ml centrifuge tube. The oxidation solution was allowed to stand at room temperature
and heated at 50 ◦C for 5 min. One hundred µl of the prepared oxidation solution was
added to each shell vial and heated for 30 min (Hirs, 1967). Thereafter, each vial was
placed in the speedvacuum evaporator for 90 min to dry the samples. When the
samples were dry they underwent the hydrolysis phase following the same protocol as
detailed above.
2.3.3 Separation and quantification of the amino acids by
HPLC (High Performance Liquid Chromatography)
The amino acids were analyzed according to Jafari et al. (2016). The filtered
samples were diluted 1:10, and 1 µl was loaded in the HPLC. The amino acids
underwent a pre-column derivatization with o-phthalaldehyde (OPA). They were separated on a Zorbax column of a chromatography Agilent 1290 Infinity HPLC
system (Agilent Technologies, Mississauga, ON). The fluorescence detector 1260
FLD detected the OPA derivatized amino acids. A calibration file consisting of the
response factor of each amino acid was used to calculate the concentration of amino
acids present in the sample. The calculation of the concentration detected by the
HPLC involves dividing the peak area corresponding to a given amino acid,
(methionine, cysteine and S-methylcysteine) by its response factor to give a value in pmol/µl (Rutherfurd and Gilani, 2009). The amino acids in the SPARC BioCentre
were analyzed according to Taylor et al. (2008). The amino acids underwent a
pre-column derivatization using phenylisothiocyanate (PITC) to produce
phenylthiocarbamyl (PTC) amino acids. The amino acids were quantified as