Electromagnetic Waves Attenuation in the Sandstones with Grains
of Different Size at Imbibition and Drying
Anastasiya S. Lapina* and Pavel P. Bobrov
Abstract—The results of experimental measurements of the complex dielectric permittivity (CDP) of powders of quartz granules with different sizes saturated with water and salt solution of weak concentration are given in the frequency band from 20 kHz to 1 GHz. It is shown that at values of saturation level from 0.6 to 0.9 the relaxation phenomena caused by interfacial polarization on the water-air bound can be observed. The result shows considerable reduction of attenuation in gradually saturated rocks, which allows for deeper sensing during georadar mapping. It is determined that in the dielectric relaxation band and at frequencies below it the hysteresis of the real part of the CDP and equivalent specific conductivity can be observed. Its character significantly depends on the sizes of granules. It is shown that the behavior of CDP and attenuation of an electromagnetic wave at frequencies from 0.1 to 10 MHz complicatedly depends on the sizes of granules, saturation level, salinity of the saturating solution and saturation history.
1. INTRODUCTION
The phenomena related to electromagnetic waves distribution in the sandstones saturated with water, in particular dispersion and attenuation, represent great interest in subsurface sensing using georadar. It is known that the limit depth of sensing has to depend on losses of electromagnetic wave impulse energy at its propagation in the medium being probed.
At a flat electromagnetic wave propagation in the media, the amplitude of electric field decreases under the law:
E=E0e−k0κz,
where E0 is an real amplitude at z = 0; z is a coordinate; k0 is a wave number in vacuum; κ is an imaginary part of the complex refractive index:
κ= Im
√
ε−iε
,
whereε andε are real and imaginary parts of the CDP. The attenuation L is usually expressed in dB/m:
L= 20 log
ek0κ
. (1)
This value depends both onε and ε, which can be demonstrated using the approximate formula which works at small attenuation:
κ≈ ε
2√ε. (2)
Therefore, one of the most important problems in theoretical modeling of borehole georadar sensing is the frequency dependence of the CDP. Some of the results of the CDP measurement in the wide
Received 25 July 2015, Accepted 25 November 2015, Scheduled 4 December 2015
frequency band are given in works in [1, 2]. A number of researches [3–9] give evidence of the CDP hysteresis phenomenon existence. However, such researches are carried out insufficiently and in the limited frequency band. Thus the hysteresis influence on the attenuation was not considered.
The phenomenon of a hysteresis of the specific conductivity at imbibition/drying of rocks was revealed by Anderson [3]. This dependence of electric properties was explained by a hysteresis of a contact angle of wetting of a rock-water interface. Similar researches are carried out by the authors at a frequency of 4 kHz [4]. In work [5], existence of a hysteresis of the real part of dielectric permittivity (DP) of the dry sandstone adsorbing moisture in the frequency band from 10 kHz to 1 MHz was shown. The author in [6] also found hysteresis in the rocks containing a significant amount of carbonate of cement and moderately high content of clay. Distinction of the electric response was explained by existence of the enveloping water layer around the sample granules. Existence of the phenomenon of a hysteresis evidences that CDP of rocks at frequencies of 10 kHz–1 MHz directly depends on saturation history.
The authors in [7] tied a hysteresis of dielectric permittivity with a hysteresis of capillary pressure. Influence of capillary pressure upon real part of CDP (RDP) is also noted in the work [8]. The authors in [9] explored influence of the sizes of sand granules and salinity of solution on RDP and a hysteresis of RDP. In the frequency band from 105 kHz to 1.67 MHz, two samples were explored: one with granule sizes of 350–420 microns, and the other −150–175 microns. It is shown that in both the samples, increasing concentration of salt solution hysteresis at higher frequencies can be observed. Influence of the particle sizes has not been analyzed. Besides, at high porosity (0.37–0.40) and concentration of NaCl solution of 100 mmol/l reliable values of RDP at moisture above 0.31 m3/m3 have not been determined as high conductivity of samples leads to a high measurement error.
Thus, the considered works do not show data on hysteresis of RDP and hysteresis of conductivity that does not allow determining attenuation of electromagnetic wave. Besides, the majority of the above-stated measurements are performed in limited frequency band. Therefore, the authors did not pay due attention to the role of the phenomenon of dielectric relaxation caused by polarization of water-air border. We succeeded to find, using a broadband method of measurement of CDP measurement [10], that the phenomenon of hysteresis of CDP looks differently at various frequencies, and the dielectric relaxation is its reason [11].
2. EXPERIMENT DESCRIPTION
The research results of RDP (ε) and equivalent specific conductivity (σ = 2πf ε0ε, where f is the frequency and ε0 = 8.854·10−12F/m the permittivity of free space) of the quartz granules of various sizes dependencies on water saturation level at imbibition and drying, are given below. On the basis of the obtained data, the calculation of attenuation of an electromagnetic wave in the wide frequency band was done.
The granule powders of melted quartz with almost spherical form saturated with water and salt solution of weak concentration were explored. Parameters of samples are specified in Table 1. The pore sizes in the packs of identical spheres with diameter dtake values between 0.15dand 0.75d. The pore sizes in the researched powders match those in poorly compacted sandstones [12].
Through the volume and mass of quartz powders, the dry density was calculated, and through the known density of melted quartzρ= 2.65 g/cm3 the porosity was found.
Table 1. Physical properties of the explored powders.
No. Average diameter d, (µm) dRMSE, (µm) Porosity Dry density, (g/cm3)
1 1.35 0.42 0.434 1.50
2 29.6 11.9 0.327 1.58
3 54.5 11.6 0.420 1.57
Measurements ofε andε were made using the technique described in [10] in frequency band from 0.1 kHz to 1 GHz using Rohde & Schwarz ZNB8 vector network analyzer (VNA) and the LCR-meter 3532-50 Hioki HiTESTER. Depending on the measured frequency band, the same cell was either directly connected to the VNA (for measuring in the band from 100 MHz to 1 GHz) or included into the break of the central conductor of a coaxial line of a large cross section (for measuring in the band from 300 kHz to 100 MHz). At frequencies below 1 MHz, the cell admittance was normally measured by an LCR meter [11]. The coaxial line segment of 20 mm in length with an outer diameter of the inner conductor of 7 mm and an inner diameter of an outer conductor of 16 mm was used as the measuring cell. The measurement error in measurements performed at the low-frequency specific conductivity of samples not exceeding 0.1 Sm/m at different frequencies was between 0.2 and 3 percent for ε and between 0.3 and to 3 percent for σ.
Measurements were taken at increase of saturation levelKW (relation of the solution volume share to general porosity) fromKW ≈0.1–0.2 toKW = 1 by addition to a dry sample a necessary amount of sufficient water or salt solution. The received mixture was placed in the tight closed cell and maintained in it for 1.5–2 hours. Full saturation was carried out in the cell by adding water until it appeared on the sample surface. Taking into account the high porosity of the powders, the remaining air can be ignored. Control of the mass of the filled-in water and the resulting values of KW was carried out on scales with an accuracy of the mass measuring of 5·10−4g. To make measurements at the reduction of saturation level, a large volume of fully saturated sample was prepared. Then a part of it was placed in the cell. After each measurement, it was taken out of the cell and dried to estimate its saturation level. At the same time, the remaining wet sample was kept drying at natural conditions, and then the same procedure was repeated several times. Inevitable changes in the density of the sample when using this method of the cell filling did not exceed 7–15 per cent, and they had little effect on the results of the CDP measurement.
3. EXPERIMENTAL RESULTS AND DISCUSSION
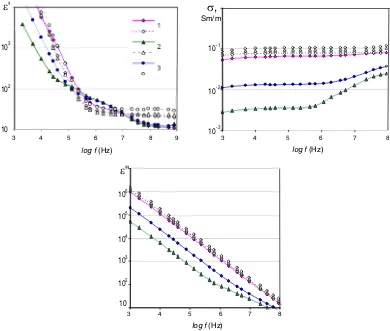
In Fig. 1 frequency dependences ofεandσare shown for samples No. 1 and 2 saturated with salt solution with concentration of 1.5 g/l and sample No. 3 saturated with salt solution of 2 g/l concentration.
Let us name the frequency band where the values of ε at KW >0.5 are higher than the values of
ε at KW = 1 as the band of relaxation. The data presented in Fig. 1 show that when particle sizes
become smaller the relaxation band becomes wider. For sample No. 1, it is 15 kHz–10 MHz, for sample No. 2 140 kHz–10 MHz, and for sample No. 3 250 kHz–6 MHz. At frequency of 1 MHz, the values of ε
at KW > 0.5 are higher than the values of ε at KW = 1 for 1.4–2 times. In sample No. 4 saturated
with deionized water there is no relaxation.
The hysteresis of dielectric permittivity was explored in all presented samples. The results for three samples obtained by increasing and decreasing the saturation level are given in Fig. 2–4. In sample No. 1 (Fig. 2), the ε curve at reduction ofKW lies above a curve ofKW increase in the frequency band of a
dielectric relaxation (below 107Hz).
The hysteresis of ε and σ is more distinct in the samples saturated with salt solution. In sample No. 2 (Fig. 3) at frequencies lower than the band of dielectric relaxation (about 105Hz), ε curve at reduction of KW lies above a curve of increase KW. In the band of a dielectric relaxation (2·105– 2·107Hz), on the contrary, the curve of reduction of KW lies below. At frequencies above the band of dielectric relaxation (109Hz), the hysteresis is practically absent. There is a similar but less expressed situation in sample No. 1.
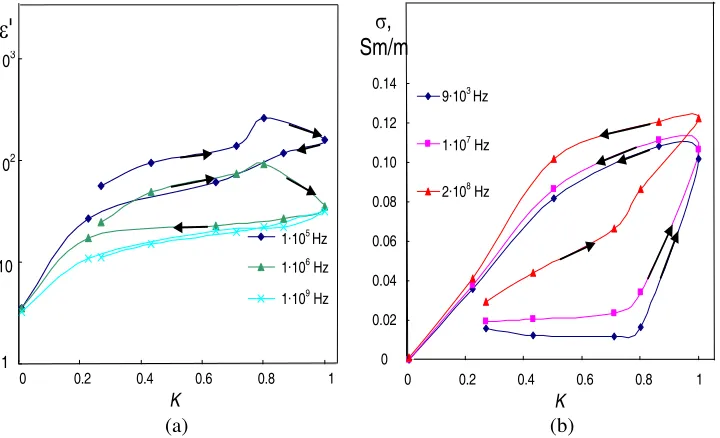
In sample No. 3 with larger granules ε curve, both in the band of a dielectric relaxation and at low frequencies, reduction of KW always lies below a curve of KW increase (Fig. 4). There are
similar but less expressed dependencies for sample No. 4. Thus, with increasing the size of the granules, dependencies ofε onKW show various features of hysteresis.
Changes of σ happen in such way that in all samples in all band of frequencies, the curves of reduction of KW lie above the curves of KW increase, and in the samples saturated with salt solution,
the conductivity atKW = 0.6–0.85 is even higher than atKW = 1. This can be explained by increasing
the solution concentration caused by reducing a water share due to the evaporation.
3 4 5 6 7 8
106
105
104
103
102
10
ε'
103
102
10
3 4 5 6 7 8 9
10-1
10-2
10-3
σ,
Sm/m
log f (Hz) log f (Hz)
3 4 5 6 7 8
log f (Hz)
ε''
Figure 1. Frequency dependencies for ε, ε and σ of the samples Nos. 1 and 2, at full saturation with salt solution of a 1.5 g/l concentration, sample No. 3 with salt solution of 2 g/l concentration. Continuous lines with dark markers show data forKW ≈0.5, shaped lines with light markers show data forKW = 1.
05
+05
08
1,E+05
E+08
0 0.2 0.4 0.6 0.8 1
ε
'
7.5·104 Hz
9·105 Hz
8·108 Hz
σ, Sm/m
KW
1·105 Hz
2·108 Hz
0.18
0.16
0.14
0.12
0.10
0.08
0.06
0.04
0.02
0 103
10
10
1
0 0.2 0.4 0.6 0.8 1
KW
(a) (b)
5,E+04 9,E+05 1,E+09 9,E+03 1,E+07 2,E+08 σ, Sm/m
5·104 Hz
9·105 Hz 1·109 Hz
9·103 Hz
1·107 Hz
2·108 Hz
104 103 102 10 0.14 0.12 0.10 0.08 0.06 0.04 0.02 0
ε
'
0 0.2 0.4 0.6 0.8 1
KW
0 0.2 0.4 0.6 0.8 1
KW
(a) (b)
Figure 3. Hysteresis of (a) the DP and (b) conductivity at changing the saturation level in the sample No. 2 saturated with salt solution of a 1.5 g/l concentration. Arrows show the direction of the KW
changing. 1,E+05 1,E+06 1,E+09 9,E+03 1,E+07 +08
0 0.2 0.4 0.6 0.8 1
ε
'
1·105 Hz
1·106 Hz
1·109 Hz
σ, Sm/m
9·103 Hz
1·107 Hz
2·108 Hz
103 102 10 1 0.14 0.12 0.10 0.08 0.06 0.04 0.02 0 K
0 0.2 0.4 0.6 0.8 1
K
(a) (b)
Figure 4. Hysteresis of (a) the DP and (b) conductivity in changing the saturation level in the sample No. 3 saturated with salt solution of 2 g/l concentration. Arrows show the direction of theKW changing.
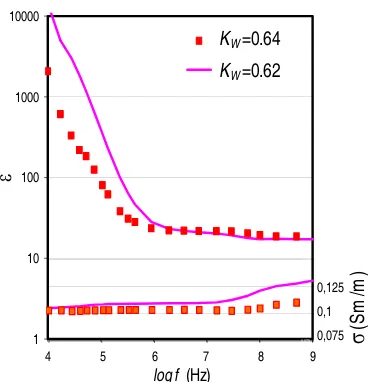
at almost the same concentration of 2.38 g/l. The saturation level KW = 0.64 was obtained by drying
the sample which was initially fully saturated up toKW = 1 with salt solution at concentration of 2 g/l.
The value KW = 0.62 was obtained at saturating the dry sample with salt solution at concentration
of 2.38 g/l. However, the values of ε found at primary imbibition at frequencies below 1 MHz are significantly higher than the values of ε found at drying. Thus, at frequency of 100 kHz, drying ε is 80.3, but at imbibition ε is 347. This proves that values of ε do not depend on the concentration of the solution as much as they depend on the saturation history.
1 10 100 1000 10000
1,00E+04 1,00E+05 1,00E+06 1,00E+07 1,00E+08 1,00E+09
1
2
0,075 0,1 0,125 0,15
1,00E+04 1,00E+05 1,00E+06 1,00E+07 1,00E+08 1,00E+09
4 5 6 7 8 9
log f (Hz)
0,125
0,1
0,075 σ(S
m/
m)
KW=0.64
KW=0.62
ε
'
Figure 5. Frequency dependencies forε and σ of the sample No. 3 saturated with salt solution of a 2.38 g/l. The value KW = 0.64 was obtained by drying the sample which was initially fully saturated with salt solution with concentration of 2 g/l. The saturation value KW = 0.62 was obtained by saturating the dry sample with salt solution with concentration of 2.38 g/l.
4 5 6 7 8 9
Attenuation, dB/m
log f (Hz) log f (Hz)
4 5 6 7 8 9
102
10
1
0.1
102
10
1
0.1
Attenuation, dB/m
(a) (b)
Figure 6. Frequency dependencies for attenuation in different samples withKW = 1 ((a) Dark markers
show results of saturation with distilled water, light markers show results of saturation with salt solution) and with KW ≈0.8. ((b) Dark markers on the right figure show results of imbibition, light ones show the results of drying).
by different values of contact angle and the curvature radius of the water drops surfaces on the area of solid particles in imbibition/drying.
Sharp increase ofσvalues when moistening toKW >0.8 at all frequencies is explained, apparently, by a percolation which disappears not at once while drying a sample. The researches conducted with higher concentration of salt solution show that the band of relaxation shifts up in frequency with increasing concentration.
0-50+
/ 40-70+
0.2 0.3 0.4 0.5 0.6 0.8 0.9 1
Attenuation, dB/m
2
3
K
6
5
4
3
2
1
0
0.7
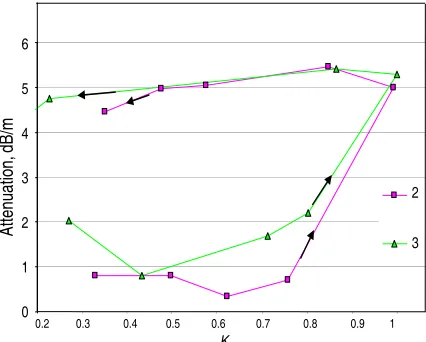
Figure 7. Hysteresis of attenuation at frequency of 1 MHz in samples Nos. 2, 3 in saturation level changing. Arrows show the direction of theKW changing.
attenuation can be hardly explained. The sample before the measurement was washed with distilled water. In the samples Nos. 2 and 3 saturated with the distilled water, attenuation is significantly less. Saturation of these samples with salt solution leads to considerable increase of attenuation. In the sample No. 4 saturated with distilled water attenuation is also great; it is much higher than in samples No. 2 and 3 with the same saturation. Thus, in samples with an average granule size of 30–55 microns not only more strongly expressed hysteresis in saturation with a weak salt solution is observed, but also one can observe essentially smaller attenuation under full saturation by distilled water than in samples of other granules sizes.
In Fig. 6(b) values of attenuation in the samples which are partially saturated with salt solution up to KW ≈0.8 by both gradual moistening and drying from a condition of full saturation are shown.
It is visible that the size of granules strongly affects the attenuation when moistening only. Herewith attenuation is much less than when drying. When drying, the dielectric relaxation is expressed poorly, and σ first of all influencing attenuation have higher values approximately identical in these samples.
The hysteresis of attenuation is shown in Fig. 7. The attenuation in sample No. 2 when drying almost coincides with the attenuation in sample No. 3 at all values of the saturation level.
4. CONCLUSION
As a result of measurements of complex dielectric permittivity of powders of quartz granules with different sizes, it is shown that in the sandy rocks saturated with water at values of saturation level between 0.6 and 0.9 (irrespective of the total pore volume), the relaxation phenomena which are assumedly caused by interfacial polarization on the water-air border can be observed. Wherein in the band of a relaxation, the real part of CDP of gradually saturated rocks is higher, and specific equivalent conductivity is significantly lower than in completely saturated rocks and rocks while drying. The result shows considerable reduction of attenuation in gradually saturated rocks that allows reaching a bigger sensing depth at a georadar-location in such cases.
Granules sizes have a significant impact on the frequencies band, in which the relaxation is shown, and on the attenuation reduction. With their increase, the band of the relaxation moves down in frequency. In sand with sizes of pores higher than 100–200 microns in the studied band of frequencies, a relaxation process was not observed. The minimum attenuation in all studied band of frequencies is observed in powders of granules with average sizes of 30–55 microns.
ACKNOWLEDGMENT
This work was supported by the Ministry of Education and Science of the Russian Federation through project 2014/336/1744.
REFERENCES
1. Bobrov, P. P., V. L. Mironov, and A. V. Repin, “Dielectric permittivity spectra of oil–water-saturated sandy-clayey rocks of different mineralogical compositions and relaxation properties of water in these rocks,”Russian Geology and Geophysics, Vol. 56, No. 7, 1065–1073, 2015.
2. Wagner, N., T. Bore, J.-C. Robinet, D. Coelho, F. Taillade, and S. Delepine-Lesoille, “Dielectric relaxation behavior of Callovo-Oxfordian clay rock: A hydraulic-mechanical-electromagnetic coupling approach,” J. Geophys. Res. Solid Earth, Vol. 118, 4729–4744, 2013.
3. Anderson, W. G., “Wettability literature survey — Part 2: Wettability measurement,” Journal of Petroleum Technology, 1246–1262, 1986.
4. Longeron, D. G., M. J. Argaud, and J. P. Feraud, “Effect of overburden pressure and the nature and microscopic distribution of fluids on electrical properties of rock samples,” SPE Format, Eval. 4, 194–202, 1989.
5. Knight, R. J. and A. Nur, “Geometrical effects in the dielectric response of partially saturated sandstones,” Log Anal., Vol. 28, 513–519, 1987.
6. Knight, R., “Hysteresis in the electrical resistivity of partially saturated sandstones,” Geophysics, Vol. 56, No. 12, 2139–2147, 1991.
7. Plug, W. J., E. C. Slob, J. Bruining, and L. M. M. Tirado, “Simultaneous measurement of hysteresis in capillary pressure and electric permittivity for multiphase flow through porous media,” Geophysics, Vol. 72, A41–A45, 2007.
8. Belyaeva, T. A., P. P. Bobrov, O. V. Kondratyeva, and A. V. Repin, “Dielectric properties of capillary-meniscus soil water,” Earth Research from Space, No. 3, 55–64, 2011 (in Russian). 9. Kavian, M., E. C. Slob, and W. A. Mulder, “Measured electric responses of unconsolidated layered
and brine-saturated sand and sand-clay packs under continuous fluid flow conditions,”Journal of Applied Geophysics, Vol. 80, 83–90, 2012.
10. Bobrov, P. P., A. V. Repin, and O. V. Rodionova, “Wideband frequency domain method of soil dielectric properties measurements,” IEEE Trans. on Geoscience and Remote Sensing, Vol. 53, No. 5, 2366–2372, 2015.
11. Bobrov, P. P., A. S. Lapina, and A. V. Repin, “Effect of the rock/water/air interaction on the complex dielectric permittivity and electromagnetic waves attenuation in water-saturated sandstones,” PIERS Proceedings, 1877–1880, Prague, July 6–9, 2015.