ISSN 2286-4822
www.euacademic.org DRJI Value: 5.9 (B+)
Genetic Potential of Newly Developed Bread Wheat
Advanced Lines for Important Traits under Normal
and Late Planting Dates
MUHAMAMD ISHAQ Wheat Breeding &Genetics Section Cereal Crops Research Institute (CCRI) Pirsabak Nowshera Khyber Pakhtunkhwa, Pakistan Department of Plant Breeding and Genetics University of Agriculture, Peshawar, Pakistan GULZAR AHMAD Wheat Breeding &Genetics Section Cereal Crops Research Institute (CCRI) Pirsabak Nowshera Khyber Pakhtunkhwa, Pakistan KHILWAT AFRIDI Wheat Breeding &Genetics Section Cereal Crops Research Institute (CCRI) Pirsabak Nowshera Khyber Pakhtunkhwa, Pakistan IBIN-AMIN KHALIL Wheat Breeding &Genetics Section Cereal Crops Research Institute (CCRI) Pirsabak Nowshera Khyber Pakhtunkhwa, Pakistan Department of Plant Breeding and Genetics University of Agriculture, Peshawar, Pakistan
Abstract:
sowing dates (November & December) as a separate factor. Statistical analysis of the data revealed that significant differences in days to heading, days to maturity, plant height, and grain yield kg ha-1 were observed for all the genotypes with respect to early and late sowing dates. The results indicated that the overall performance of the genotypes was the best with respect to normal sowing. Based on the average values of normal and late sowing, days to heading, days to maturity, plant height, and grain yield kg ha-1 ranged from 111 to 115 days, 147 to 151 days, 81.5 to 112.6 cm and 2048.1 to 4420.4 kg ha-1 respectively. Though all the characters were negatively affected as a result of late sowing .However the genotypes PS-11, PS-12 and SRN-10023 with grain yield of 4420.4, 4155.6 and 4006.5 kg ha-1 respectively performed well under Normal and late planting dates as compared to those of the best checks (Pirsabak-2013 & Pirsabak-2008). Genotype PS-11 was found best as it out yielded all other lines and checks and stable under both planting dates. Results indicated that these wheat genotypes among existing germplasm may have in built tolerance against terminal heat stress/ under late planting condition and can be sown by farmers under normal and late production system.
Key words: Advanced lines, Genetic potential, planting dates, High yield, Tolerance
Introduction
average yield of 2787 kg ha-1 during 2009-10 (Economic survey of Pakistan, 2012-113). The average yield of wheat in Pakistan is very low when compared with technologically advanced countries of the world like USA, Australia, France, China, Brazil etc.
Although timely sowing of wheat is a prime condition to achieve the maximum yield per hectare there are several constraints (viz., delay in rain fall, unavailability of irrigation water and machinery at proper time, sowing of wheat after sugarcane and rice crop etc.) which prevent timely sowing of the crop. Apart from other biotic and abiotic stresses responsible for low wheat productivity in the province, late heat stress during grain filling period of the normal as well as late planted wheat is also considered one of the major environmental factors drastically reducing wheat production in most of the wheat growing areas under different agro-ecologies of country including Khyber Pakhtunkhwa (Subhan et al., 2004).
Materials and Methods
The genotypes included in this study were developed by different Research Institutes across khyber Pakhtunkhwa. A set of twenty wheat genotypes listed in table1 were evaluated at Cereal Crops Research Institute, Pirsabak, Nowshera during 2013-2014, to identify high yielding bread wheat genotypes suited for Normal and late planting dates.(November & December). Genotypes were evaluated in randomized complete block design with replications. Each genotype was sown in 5 meter long 6 rows each with row to row distance of 30 cm. Plot area for each entry was 9 m2. Uniform seed rate of 100 kg ha-1 was used. Planting was done with hand hoe. Fertilizer was applied at the ratio of 120:60 kg ha-1 of NP in the form of Single Super Phosphate (SSP) and Urea. SSP was applied as basal dose at the time of sowing while urea was applied in split doses; half at the time of sowing and half with first irrigation. All other recommended and standard agronomic practices were kept normal and uniform for all the experimental units in order to reduce experimental error. Data were recorded on days to heading, days to physiological maturity, Plant height and grain yield (kg ha-1). Data were analyzed statistically with the statistical package MStat-c (Knowledge Dynamics Corporation, USA). LSD test was used for the significance of treatment differences.
Results and Discussion
Days to heading
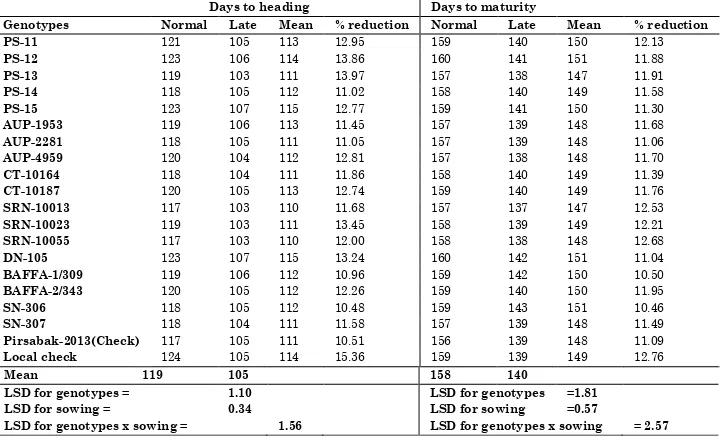
heading while, maximum (124) days were taken by local check Pirsabak-2008 to start heading. On the other hand under late sowing days to heading range from 103 to 107 days and genotypes PS-13, SRN-10013, SRN-10055 and SRN-10023 were found best as it headed earlier than the check cultivar. Based on the average values of normal and late sowing, reveal that minimum (111) days to heading were recorded for PS-13, AUP-2281, CT-10164, SRN-10023, SN-307, Pirsabak 2013 representing earliness of the genotypes where as maximum days to heading were recorded for the genotypes PS-15 , DN-105 followed by Local check Pirsabak 2008. Decrease in days to heading was observed when genotypes were sown late as compared to normal sowing. % reduction for days to heading range from 10.48 to 15.36 (Table III). Significant differences for days to heading were observed by when genotypes were planted on different sowing dates. These results are in agreement with those of Irfaq et al., (2005) &2007.
Days to physiological maturity
values of normal and late sowing, days to maturity ranged from147 to 151 days. Results revealed that minimum days to maturity were recorded for PS-13, SRN-10013 representing earliness of the genotypes where as maximum days to maturity were recorded for the genotypes PS-12, DN-105 and SN-306. For days to maturity % reduction ranged from 10.46 to 12.68 representing decrease in days to maturity. (Table III). Significant decrease in days to maturity was also reported by Jain et al., (1992) Irfaq et al., (2005) &2007.
Plant height (cm)
Grain yield
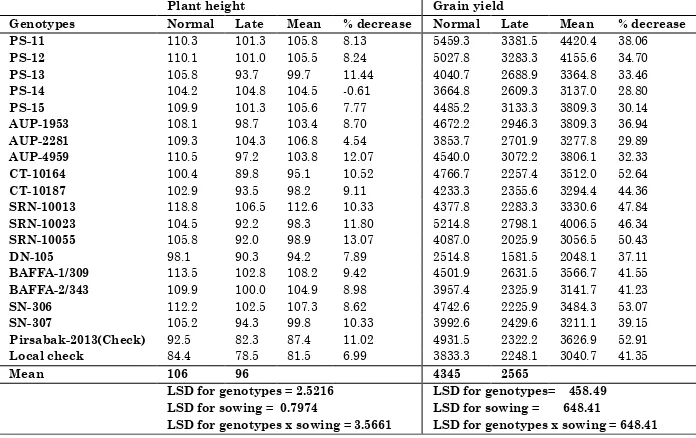
Significant differences in the mean values for grain yield was observed between different genotypes, dates and interaction b/w dates and genotypes under both normal and late sowing dates (Table II).Under normal sowing grain yield ranged from 2514.8 to 5459.3 kg ha-1. Genotype DN-105 produced minimum grain yield (2514.8 kg ha-1) while, PS-11 produced maximum (5459.3 kg ha-1) under normal sowing condition. On the other hand at late sowing condition grain yield ranged from 1581.5 to 3381.5 kg ha-1. Minimum grain yield was recorded for DN-105 while maximum grain yield was recorded for PS-11. Based on average value under normal and late planting dates, grain yield ranged from 2048.1 to 4420.4 kg ha-1.Average over both sowing dates DN-105 produced minimum grain yield (2048.1 kg ha-1) showing poor performance under both sowing dates. Genotypes PS -11 produced maximum gain yield (4420.4 kg ha-1) averaged over both planting conditions show its superiority over other genotypes. For grain yield reduction ranged from 29.89 to 53.07 % (Table IV). Decrease in grain yield was observed for different genotypes as a results of late planting. Grain yield is a complex and polygenic character and highly influenced by genotype, environment and genotype x environment interaction (Sial et al., 2003; Arain et al., 2001). Our results are in agreement to those of Okuyama et al., (2005) Darwinkel et al., (1977), Kirby (1967), Jain et al., (1992) and Kumar et al., (1994) who found that delay in sowing is directly associated with consistent reduction in grain yield.
Conclusion and Recommendation
Table I: List of the newly developed wheat lines included in the study
Wheat Lines Parentage/ Pedigree Breeding Statation
PS-11 MTRWA92.161/PRINIA/5/SERI*/SERI*3//RL6010/ 4*YR/3/PASTOR/4/BAV92 CCRI Pirsabak
PS-12 MTRWA92.161/PRINIA/5/SERI*3//RRRI*3//RL6010/4*YR/3/PASTOR/4/BAV92 -do-
PS-13 BERKUT/EXCALIBURCMSA02M00148S-028ZTM-028RLNIM-010Y-010M-5S-
OM-02Y-OB
-do-
PS-14 QUAICGSS01B00046T-099Y-099M-099M-099Y-099M-32Y-0BYPPM -do-
PS-15 PIN/BOW//OPATA/3/HXL7573/2*BAU -do-
AUP-1953 __________________ Agric Uni Peshawar
AUP-2281 ____________________ -do-
AUP-4959 _____________________ -do-
CT-10164 WAXWING*2/TUKURU NIFA Peshawar
CT-10187 PBW343/PASTOR//OTUS/TOBA97 -do-
SRN-10013 D67.2/P66.270//AESQURROSA 320)/3/…. -do-
SRN-10023 YANAC/3/PRL/SARA//TSI/VEE#5/4/CROC_1/… -do-
SRN-10055 PBW343*2/KUKUNA//KRONSTAD F2004/3/PBW 343*2/… -do-
DN-105 CHAM-8 ARI D.I.Khan
BAFFA-1/309 BABAX/LR2//BABAX/3/ER2000 ARS Baffa Mansehra
BAFFA-2/343 SOKOL/3/PASTOR//HXL 7573/2*BAU ---do---
SN-306 CROC_1/AE.SQUARROSA (224)//OPATA/3/BJY/COC// ARS Serai Naurang
SN-307 CROC_1/AE.SQUARROSA (205)//BORL95/3/KENNEDYCMSS99M02166S-040M-
040SY-11M-2Y-8M-0ZTB-OSY
---do---
Pirsabak-2013 check --- CCRI Pirsabak
Pirsabak-2008
Local check
Table II: Individual and combined ANOVA for various traits. Nor m al p lan tin g
SOV DF Days to heading Days to maturity Plant height Grain yield
Genotypes 19 81.210** 4.543** 176.15** 1278318.88**
Replication 2 15.417 8.550 40.34 379475.70
Error 38 3.031 1.006 5.35 216364.26
L at e p lan tin g
Genotypes 19 4.460** 6.957NS 167.178** 604521.63**
Replication 2 3.267 4.017 0.729 201460.39
Error 38 0.723 3.999 4.492 101549.73
Date of sowing 1 6497.41** 10193.6** 2721.77** 95040000**
Com
b
in
ed
AN
OVA Genotypes 19 13.8** 9.9** 325.83** 1514779**
Reps within sowing 4 1.79 6.3 19.67 290177
Date of sowing x Genotypes 19 4.64** 1.6NS 16.41** 368139**
Error 76 0.92 2.5 4.81 158983
CV(%) 0.86 1.06 2.17 11.54
**= Highly significant at 1% level of probability NS= Non signioficant
Table III: Mean values for days to heading and maturity of 20 wheat lines evaluated under normal and late planting dates at CCRI, Pirsabak Nowshera during 2013-14.
Days to heading Days to maturity
Genotypes Normal Late Mean % reduction Normal Late Mean % reduction PS-11 121 105 113 12.95 159 140 150 12.13 PS-12 123 106 114 13.86 160 141 151 11.88 PS-13 119 103 111 13.97 157 138 147 11.91 PS-14 118 105 112 11.02 158 140 149 11.58 PS-15 123 107 115 12.77 159 141 150 11.30 AUP-1953 119 106 113 11.45 157 139 148 11.68 AUP-2281 118 105 111 11.05 157 139 148 11.06 AUP-4959 120 104 112 12.81 157 138 148 11.70 CT-10164 118 104 111 11.86 158 140 149 11.39 CT-10187 120 105 113 12.74 159 140 149 11.76 SRN-10013 117 103 110 11.68 157 137 147 12.53 SRN-10023 119 103 111 13.45 158 139 149 12.21 SRN-10055 117 103 110 12.00 158 138 148 12.68 DN-105 123 107 115 13.24 160 142 151 11.04 BAFFA-1/309 119 106 112 10.96 159 142 150 10.50 BAFFA-2/343 120 105 112 12.26 159 140 150 11.95 SN-306 118 105 112 10.48 159 143 151 10.46 SN-307 118 104 111 11.58 157 139 148 11.49 Pirsabak-2013(Check) 117 105 111 10.51 156 139 148 11.09 Local check 124 105 114 15.36 159 139 149 12.76
Mean 119 105 158 140
LSD for genotypes = 1.10 LSD for genotypes =1.81 LSD for sowing = 0.34 LSD for sowing =0.57
Table IV: Mean values for days to heading and maturity of 20 wheat advanced lines evaluated under normal and late planting dates at CCRI, Pirsabak Nowshera during 2013-14.
Plant height Grain yield
Genotypes Normal Late Mean % decrease Normal Late Mean % decrease PS-11 110.3 101.3 105.8 8.13 5459.3 3381.5 4420.4 38.06 PS-12 110.1 101.0 105.5 8.24 5027.8 3283.3 4155.6 34.70 PS-13 105.8 93.7 99.7 11.44 4040.7 2688.9 3364.8 33.46 PS-14 104.2 104.8 104.5 -0.61 3664.8 2609.3 3137.0 28.80 PS-15 109.9 101.3 105.6 7.77 4485.2 3133.3 3809.3 30.14 AUP-1953 108.1 98.7 103.4 8.70 4672.2 2946.3 3809.3 36.94 AUP-2281 109.3 104.3 106.8 4.54 3853.7 2701.9 3277.8 29.89 AUP-4959 110.5 97.2 103.8 12.07 4540.0 3072.2 3806.1 32.33 CT-10164 100.4 89.8 95.1 10.52 4766.7 2257.4 3512.0 52.64 CT-10187 102.9 93.5 98.2 9.11 4233.3 2355.6 3294.4 44.36 SRN-10013 118.8 106.5 112.6 10.33 4377.8 2283.3 3330.6 47.84 SRN-10023 104.5 92.2 98.3 11.80 5214.8 2798.1 4006.5 46.34 SRN-10055 105.8 92.0 98.9 13.07 4087.0 2025.9 3056.5 50.43 DN-105 98.1 90.3 94.2 7.89 2514.8 1581.5 2048.1 37.11 BAFFA-1/309 113.5 102.8 108.2 9.42 4501.9 2631.5 3566.7 41.55 BAFFA-2/343 109.9 100.0 104.9 8.98 3957.4 2325.9 3141.7 41.23 SN-306 112.2 102.5 107.3 8.62 4742.6 2225.9 3484.3 53.07 SN-307 105.2 94.3 99.8 10.33 3992.6 2429.6 3211.1 39.15 Pirsabak-2013(Check) 92.5 82.3 87.4 11.02 4931.5 2322.2 3626.9 52.91 Local check 84.4 78.5 81.5 6.99 3833.3 2248.1 3040.7 41.35
Mean 106 96 4345 2565
LSD for genotypes = 2.5216 LSD for sowing = 0.7974
LSD for genotypes x sowing = 3.5661
LSD for genotypes= 458.49 LSD for sowing = 648.41 LSD for genotypes x sowing = 648.41
REFERENCES
Anonymous 2012-2013. Economic Survey of Pakistan. Government of Pakistan, Finance Division, Economic Advisory Wing, Islamabad.
Arain, M.A., M.Ahmad and M.A.Rajput.1999.Evaluation of wheat genotypes under varying environments induced through changing sowing dates. Proc. Symp. New Genetical Approaches to Crop Improvement-III. Nuclear Institute of Agriculture, Tandojam, Pakistan, Pp.163-173).
Irfaq, M., T. Muhammad, M. Amin and A. Jabbar. 2005. Performance of yield and other agronomic characters of four wheat genotypes under heat stress. Pak. Journal of Botany, 1(2):124-127.
Jain, M.P., J.P. Dixit, P.V.A. Pillai and R.A. Khan. 1992. Effect of sowing date on wheat varieties under late sown irrigated condition. Indian J. Agric. Sci., 62: 669-671. Kirby, E.J.M. 1967. The effect of plant density upon the growth
and yield of barley. Cambridge Journal of Agricultural Science,68: 317-324.
Okuyama, Lauro Akio, Federizzi, Luiz Carlos and Barbosa Neto, José Fernandes. 2005. Grain yield stability of wheat genotypes under irrigated and non-irrigated conditions. Braz. Arch. Biol. Technol., 48(5): 697-704. Reynolds, R.P. Singh, A. Ibrahim, O.A.A. Ageeb, A. Larque
Savedra and J.S. Quick. 1998. Evaluating physiological traits to complement empirical selection for wheat in warm environments. Euphytica, 100: 85-94.
Sial, M.A., M.A.Arain and M.Ahmad,.2000.Genotype x environment interaction on bread wheat grown over multiple sites and years in Pakistan. Pak. J. Bot.32: 85-91