Western University Western University
Scholarship@Western
Scholarship@Western
Electronic Thesis and Dissertation Repository
12-4-2015 12:00 AM
Seasonal and Long-term (1995-2009) Changes in the Distribution
Seasonal and Long-term (1995-2009) Changes in the Distribution
and Abundance of Submerged Aquatic Vegetation and Dreissenid
and Abundance of Submerged Aquatic Vegetation and Dreissenid
Mussels in Inner Long Point Bay, Lake Erie
Mussels in Inner Long Point Bay, Lake Erie
Robin TJ ChurchillThe University of Western Ontario
Supervisor Dr. Scott Petrie
The University of Western Ontario Graduate Program in Biology
A thesis submitted in partial fulfillment of the requirements for the degree in Master of Science © Robin TJ Churchill 2015
Follow this and additional works at: https://ir.lib.uwo.ca/etd
Part of the Biology Commons, and the Ecology and Evolutionary Biology Commons
Recommended Citation Recommended Citation
Churchill, Robin TJ, "Seasonal and Long-term (1995-2009) Changes in the Distribution and Abundance of Submerged Aquatic Vegetation and Dreissenid Mussels in Inner Long Point Bay, Lake Erie" (2015). Electronic Thesis and Dissertation Repository. 3400.
https://ir.lib.uwo.ca/etd/3400
This Dissertation/Thesis is brought to you for free and open access by Scholarship@Western. It has been accepted for inclusion in Electronic Thesis and Dissertation Repository by an authorized administrator of
SEASONAL AND LONG-TERM (1995-2009) CHANGES IN THE
DISTRIBUTION AND ABUNDANCE OF SUBMERGED AQUATIC
VEGETATION AND DREISSENID MUSSELS IN INNER LONG POINT
BAY, LAKE ERIE
(Thesis Format: Monograph)
by
Robin T.J. Churchill
Graduate Program in Biology
A thesis submitted in partial fulfillment of the requirements for the degree of
Master of Science
School of Graduate and Postdoctoral Studies The University of Western Ontario
ii
ABSTRACT
Invasion by mussels can cause rapid increases in the abundance of submerged aquatic
vegetation (SAV) by increasing water clarity and altering nutrient cycling, but rapid expansion of
the mussel population is often followed by a decline until a new regional carrying capacity is
reached. I sampled Long Point Bay (LPB), Lake Erie, in 2009 to quantify changes in SAV
communities and densities of zebra mussels (Dreissena polymorpha) since the peak of the latter
in the early 1990s, and modeled influences of year, water depth, and substrate type on the
probability of SAV detection. I detected a 96% decrease in mussel abundance/m2 (±SE) between
1992 (x = 457 ± 86)and 2009 (x= 19 ± 2). The five most abundant SAV species in 1992 had
decreased by 2009. Water depth and substrate type influenced probability of detection of SAV
species, suggesting that changes in Lake Erie water levels and sediment loading influence SAV
communities. Carrying capacity of LPB for waterfowl and other fish and wildlife that use and eat
SAV and mussels increased during the mid-1990s, but has since decreased.
Keywords: abundance, distribution, Dreissenid mussels, Lake Erie, Long Point, submerged
iii
ACKNOWLEDGEMENTS
I would like to thank Long Point Waterfowl, The Bluff’s Hunt Club, S.C. Johnson & Son,
Ltd., Ontario Ministry of Natural Resources, Ontario Federation of Anglers and Hunters, and
Ducks Unlimited Canada for providing funding for this project.
I thank my advisor, Scott Petrie. Without his patience and understanding over the past
few years (too damn many), I’m not sure I’d be where I am today. You can always count on
Scott to be in your corner as you roll along through the graduate process. Similarly, I’d like to
thank my co-supervisor Hugh Henry for all of his help along the way, especially with the
important details of grad work at UWO.
I am forever indebted to Ted Barney for luring me to the world of wildlife. Without Ted’s
guidance, teaching ability, and knowledge, I would not be where I am today (probably back at
the old hospital bed factory). It’s amazing what a dude with a beard, teaching Animal Ecology
could do with a road-kill deer to influence a young cidiot like myself. I look forward to many
more adventures with Ted.
A very special thank you has to go to Michael Schummer. There is no doubt in my mind
that Mike has been the biggest reason for me finally completing my thesis. I’ve been lucky
enough to benefit from the intense passion that Mike has for wetlands and waterfowl. Mike was
always available to steer me in the right direction after my (common) disappearing acts.
There is a small army of assistants and volunteers that made my project a decently
successful voyage, to whom I am eternally thankful. I would like to thank Jim Cook, who with
his sense of humor, boat driving skills, and life-saving ability was able to make the grueling days
iv
Dhamorikar, Spencer Hockley, Connie Walker and Scott Bossyut, whose assistance on board
was nothing but top-notch.
I would like to thank Janice Gilbert, Jason Palframan, Rachel Watt, Mike Morse, Ainsley
Winstanley-Hayes, and Amber Good for technical, field, and lab assistance. I also thank
members of the Scientific Advisory Committee at LPW for their helpful reviews of my thesis.
If there is a benefit to having numerous year X’s it’s the ability to have quite a few lab
mates. Whether it was at UWO, Long Point, or some conference, good times were had with
Jeremy Stempka, Nick Bartok, Big Dave Messmer, Caroline Brady, Rob Baden, Philly Wilson,
Katelyn Weaver, Matt Palumbo, Matt Dyson, Taylor Finger, Everett Hanna, and Lena
Vandenelsen. Though I might not have been the most present lab-mate, I consider myself lucky
to have spent time with you folks.
I’d like to thank my mom and dad for giving me the gift of life, and making sure I was
always a good student/human being. I am proud to call you guys my parents.
A special thank you has to go to the entire crew at Predator Bird Services, especially big
bossman/great friend Steve Bucciarelli. I never had to worry about missing out on work to get
anything done on this thesis, and was always reminded about getting it done. I couldn’t ask for a
better group of people to go to work with each day.
I thank my best pal Lance. There isn’t another creature on this planet that I can say with
100% certainty would give up anything just to be by my side. Don’t worry Olives, I didn’t forget
about you either little fella, thanks for keeping BL occupied. I’d also like to thank all the K-9’s
that have either pestered or been pestered by BL during his LP days, Rusty (Tollz), Dixie, Oscar,
v
Finally, I have to thank the heart of my support system, Alexandra Djorjevic. Her
patience, help, love, knowledge, and motivation over the past 5 years have not only helped the
vi
Table of Contents
ABSTRACT ii
ACKNOWLEDGEMENTS iii
Table of Contents vi
List of Tables viii
List of Figures ix
List of Abbreviations xi
1 INTRODUCTION 1
1.1 Coastal Wetlands 1
1.2 Impact of Exotic Species on Coastal Wetlands 2
1.3 Relationships between Dreissenid Mussels and Submerged Aquatic Vegetation 2
1.4 Coastal Wetlands of the Lower Great Lakes 3
1.5 Importance of Long Point Bay to Fish and Wildlife 4
1.6 Seasonal Trends in Submerged Aquatic Vegetation Biomass 4
1.7 Historical Studies and Available Data 5
1.8 Research Objectives and Predictions 5
2 METHODS 6
2.1 Study Area 6
2.2 Study Design and Sample Collection 7
2.3 Laboratory Procedures 9
2.4 Data Mapping and Analysis 12
2.4.1 Submerged Aquatic Vegetation Distribution and Abundance 12
2.4.2 Energetic Carrying Capacity 13
vii
3.1 Long-term Changes 18
3.1.1 Overall Changes 18
3.1.2 Species-specific Changes 27
3.2 Seasonal Changes in Energetic Carrying Capacity 34
4 DISCUSSION 40
4.1 Long-term Changes 40
4.2 Energetic Carrying Capacity 42
5 REFERENCES 46
viii
List of Tables
Table 1. Linear regressions for conversion of wet weights to dry weights for species of
submerged aquatic vegetation sampled at Long Point Bay, Lake Erie, autumn 2009 and spring 2010... 11
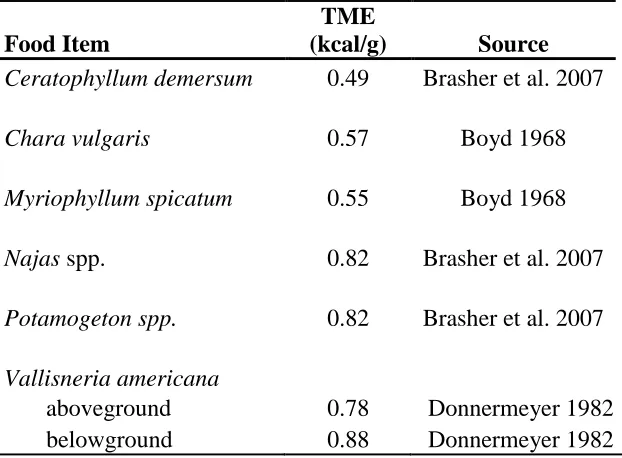
Table 2. True metabolizable energy values used to calculate energetic carrying capacity for food items in Long Point Bay, Lake Erie during summer/fall 2009. ... 16
Table 3. Daily energetic requirements of species and guilds and the percentage of diet consisting of stems/leaves of waterfowl species using submerged aquatic vegetation habitat within Long Point Bay, Lake Erie.. ... 17
Table 4. Results of the multiple logistic regression of the submerged aquatic vegetation
distribution data.………..…..28
Table 5. Seasonal biomass, of each species of submerged aquatic vegetation in Long Point Bay, Lake Erie, Ontario autumn 2009 and spring 2010. ... 35
ix
List of Figures
Figure 1. Locations forsampling dreissenid mussels, submerged aquatic vegetation distribution and abundance, water depth, and substrate type within Long Point Bay, Lake Erie. ... 9
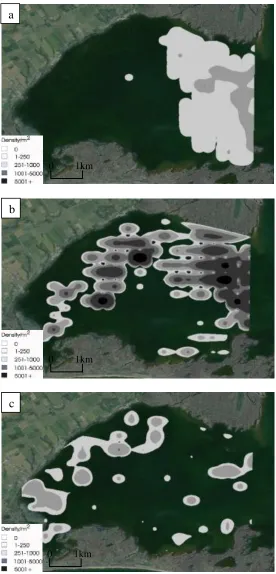
Figure 2. Distribution and abundance of Dreissenid mussels in Long Point Bay – Lake Erie a) 1991 b) 1992 and c) 2009. ... 19
Figure 3. Distribution and c) 1992 and d) 2009 abundance of muskgrass (Chara vulgaris) in Long Point Bay – Lake Erie a) 1976 b) 1991. ... 20
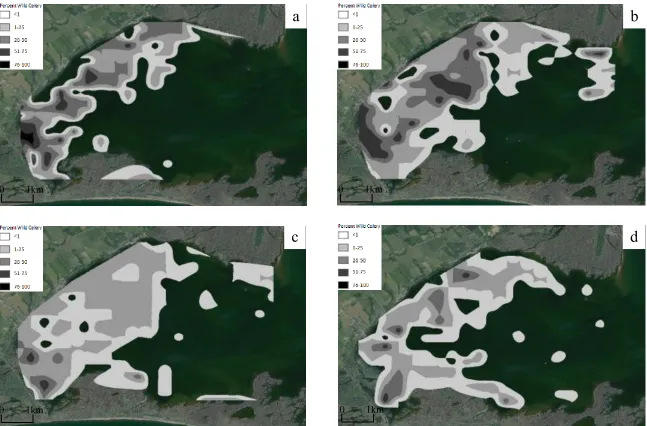
Figure 4.Distribution and abundance of wild celery (Vallisneria americana) in Long Point Bay – Lake Erie a) 1976 b) 1991 c) 1992 and d) 2009. ... 21
Figure 5. Distribution and abundance of Najas spp. in Long Point Bay – Lake Erie a) 1976 b) 1991 c) 1992 and d) 2009 ... 22
Figure 6. Distribution and abundance of Eurasian milfoil (Myriophyllum spicatum) in Long Point Bay – Lake Erie a) 1976 b) 1991 c) 1992 and d) 2009. ... 23
Figure 7. Distribution and abundance of Richardson’s pondweed (Potamogeton richardsonii) in Long Point Bay – Lake Erie a) 1976 b) 1991 c) 1992 and d) 2009. ... 24
Figure 8. Distribution and abundance of slender pondweed (Potamogeton pusilus) in Long Point Bay – Lakie Erie a) 1976 b) 1991 c) 1992 and d) 2009 ... 25
Figure 9. Total energy available from submerged aquatic vegetation in autumn 2009 and spring 2010 both with and without muskgrass (Chara vulgaris) in Long Point Bay – Lake Erie ... 26
Figure 10. Least-squared means of percent abundance for the most abundant species of
submerged aquatic vegetation in Long Point Bay. ... 30
Figure 11. Relationship between the predicted probability of submerged aquatic vegetation presence (a) muskgrass b) Eurasian milfoil c) slender pondweed) and the effects of substrate and year in Long Point Bay – Lake Erie in 1991, 1992, and 2009. ... 31
Figure 12. Relationship between the predicted probability of submerged aquatic vegetation presence (a) wild celery b) muskgrass c) Eurasian milfoil d) Richardson’s pondweed e) slender pondweed) and water depth in Long Point Bay – Lake Erie in 1991, 1992, and 2009. ... 32
Figure 13. Relationship between the predicted probability of submerged aquatic vegetation presence (a) wild celery b) Najas spp. c) Richardson’s pondweed) and the interactive effects of substrate and year in Long Point Bay – Lake Erie in 1991, 1992, and 2009. ... 33
x
Figure 15 Available autumn energy and the required energy from the stems/leaves of submerged aquatic vegetation within Long Point Bay (with Muskgrass). ... 38
Figure 16. Available autumn energy and the required energy from the stems/leaves of submerged aquatic vegetation within Long Point Bay (without Muskgrass)... 38
Figure 17. Available spring energy and the required energy from the stems/leaves of submerged aquatic vegetation within Long Point Bay (with Muskgrass). ... 39
xi
List of Abbreviations
ANOVA – Analysis of variance
DER- Daily energy requirement
DUD – Duck use days
IDW – Inverse distance weighted spatial interpolation
LGL – Lower Great Lakes
LPB – Inner Long Point Bay, Lake Erie
MANOVA – Multivariate analysis of variance
SCUBA – Self-contained underwater breathing apparatus
SAV – Submerged aquatic vegetation
1
1
Introduction
1.1 Coastal Wetlands
Coastal wetlands and associated submerged aquatic vegetation (SAV) include seasonal and
relatively permanent coastal-plain freshwater swamps and marshes, coastal beaches, rocky
shorelines, estuarine salt marshes, mangrove swamps, seagrass beds, mud flats, oyster reefs, and
sand bars (Prince et al. 1992, Bildstein et al. 1991). Coastal wetlands are among the most
productive and ecologically valuable natural habitats, because they are made up of
interconnected subsystems whose functions cannot be duplicated elsewhere. Coastal habitats are
home to a diversity and abundance of plants and animals and also serve the important role of
filtering impurities in the water that flows through them (Beatley et al. 2002). The productive
plant communities within the coastal wetlands of North America meet the life cycle needs of a
diversity of birds as they migrate and exploit available resources (Bildstein et al. 1991, Newton
2008).
Because of their productivity and value as transportation arteries, coastal wetlands have
been attractive sites for human settlement for centuries (Day et al. 1989). Approximately half of
the world’s wetlands have been drained, filled or degraded in the last century, and less than 3%
of the Western Hemisphere land surface consists of coastal wetlands (Bildstein et al. 1991).
Humans impact coastal wetlands directly through (1) physical alteration, (2) the introduction of
toxic materials, (3) enrichment with excessive levels of naturally occurring materials (including
nutrients) and heat, and (4) the introduction of exotic species that often replace the diverse native
plant communities and form monotypic communities and reduce habitat quality for wildlife (Day
2 1.2 Impact of Exotic Species on Coastal Wetlands
Many of the remaining coastal wetlands have been altered by various stressors, including
the introduction of exotic plants and invertebrates (Petrie 1998, Knapton and Petrie 1999, Petrie
and Knapton 1999). Invasive species can affect carrying capacity for staging waterfowl and other
animals by altering total biomass of submerged aquatic vegetation (SAV) or changing species
composition within wetlands (Crowder and Bristow 1988). For instance, the introduction and
proliferation of zebra mussels (Dreissena polymorpha) and quagga mussels (Dreissena
burgensis) (hereafter combined as Dreissenid mussels) has been associated with changes in the
abundance, distribution, and community composition of SAV (Blindlow 1992; Knapton and
Petrie 1999; Petrie and Knapton 1999). Dreissenid mussels reduce the number of suspended
particles in the water column through filtering, and thereby increase water clarity and decrease
light attenuation (Knapton and Petrie 1999). Decreased light attenuation enhances benthic
photosynthesis and influences the distribution and abundance of SAV (Wetzel 1983). In addition,
Dreissenid mussels can alter microbially-mediated nutrient cycling and the nearshore phosphorus
cycle (Wilson et al. 2006), further decreasing phytoplankton levels. Decreased phytoplankton
levels through Dreissenid filtering and the resulting increased water clarity can also increase
SAV abundance (Schloesser and Manny 2007).
1.3 Relationships between Dreissenid Mussels and SAV
Following introduction to a suitable, new locale, exotic species often occur in greater
abundance than observed in their native range, which often is followed by decline until a new
regional carrying capacity is reached (McKillup et al. 1988). Dreissenid mussels prefer to anchor
to hard substrate, but those types of substrates are not found extensively throughout LPB, so
3
influence water clarity and rates of eutrophication because they filter substantial amounts of
water (Knapton and Petrie 1999). Because angiosperm SAV species that reproduce via flowering
vegetative structures can outcompete algal species in eutrophic systems, changes in abundance of
Dreissenid mussels may cause measureable changes in SAV plant community composition
(Knapton and Petrie 1999). An angiosperm-dominated SAV community in LPB would provide
more nutritious food sources for certain species of waterfowl (Knapton and Petrie 1999) and
better spawning habitat for some fish species (Richardson et al. 1998).
1.4 Coastal Wetlands of the Lower Great Lakes
Coastal wetlands associated with the lower Great Lakes (LGL) are critically important to
a diversity of wetland-dependent organisms. SAV in coastal wetlands of the LGL is food for
migrating waterfowl (Knapton and Petrie 1999; Badzinski and Petrie 2006) and provides habitat
and nursery areas to fish (Richardson et al. 1998). In addition, SAV quantity and species
distribution are indicators of local water conditions, affect biogeochemical and sedimentological
processes, and protect shorelines from erosion by decreasing nearshore wave action (Moore et al.
1996). Despite their importance to fish, wildlife and humans, a substantial number of LGL
coastal wetlands have been drained for agriculture and other development (e.g., < 5% of western
Lake Erie wetlands remain intact), thereby increasing the importance of remaining coastal
wetland habitat for wetland-dependent organisms. Inner Long Point Bay – Lake Erie (LPB) is an
important remaining habitat that is in a relatively pristine state. LPB is important because it has a
fairly uniform depth of 2 m, which supports an extensive SAV community covering >99% of the
4
1.5 Importance of Long Point Bay to Fish and Wildlife
Diving ducks (e.g., Aythya spp. and Bucephala spp.) feed exclusively in aquatic habitats;
thus, the shallow, productive waters of LPB provide foraging habitat necessary to complete
migration (Petrie 1998). Expansion of introduced Dreissenid mussels to Lake Erie in the
early-1990s led to an initial increase in use of LPB by molluscivorous diving ducks (Petrie and
Knapton 1999). Lesser scaup (Aythya affinis) and greater scaup (Aythya marila), bufflehead
(Bucephala albeola), and common goldeneye (Bucelphala clangula) altered traditional migration
patterns to take advantage of this novel food source in LPB (Hamilton et al. 1994, Petrie 1998,
Petrie and Knapton 1999). However, since 2000, diving duck use has declined within LPB,
particularly among those species that consume Dreissenid mussels (Badzinski 2007). In addition,
the abundance of economically important fish species, such as yellow perch (Perca flavescens),
largemouth bass (Micropterus salmoideus), and smallmouth bass (Micropterus dolomieu), has
also decreased within LPB since the late 1990s (Ontario Ministry of Natural Resources 2007).
Causes of declines in fish populations and diving duck use remain unclear, but it is plausible that
a decline in abundance or distribution of Dreissenid mussels may be a direct or indirect
contributing factor.
1.6 Seasonal Trends in SAV Biomass
Seasonal changes in SAV biomass may influence availability of food and cover for
wetland fish and wildlife. In August, SAV typically reaches maximum aboveground biomass and
begins shifting resources to propagules (Rybicki and Landwehr 2007). Specifically, most
angiosperm species (e.g., wild celery, Vallisneria americana and pondweeds, Potamogeton spp.)
of SAV typically overwinter as belowground roots, tubers, and seeds (Kufel 2001). In addition to
5
portion of available biomass (Marklund et al. 2002). In December, aboveground biomass nears
zero and belowground biomass occurs as roots, tubers, and dormant seeds (Rybicki and
Landwehr 2007). During winter, aboveground biomass in LPB is dominated by muskgrass
(Chara vulgaris), a charophyte species capable of over-wintering in aboveground form (Kufel
2001). Although potentially important during spring to migrant waterfowl that require adequate
food resources to fuel migration to breeding grounds, seasonal reduction of SAV biomass in LPB
has not yet been documented.
1.7 Historical Studies and Available Data
Because LPB is an important wetland habitat used by staging waterfowl and other fish
and wildlife in the LGL, researchers have quantified the distribution, relative abundance and
long-term temporal dynamics of the SAV community; Smith(1979) mapped the distribution of
SAV in LPB during the 1960s and 1970s; Knapton and Petrie(1999) and Petrie and Knapton
(1999) assessed the distribution and relative abundance of SAV and Dreissenid mussels in the
mid-1990s and compared their findings with those of Smith (1979). However, no studies have
determined seasonal dynamics of SAV at LPB between autumn and spring. Seasonal abundance
is important in determining carrying capacity of LPB for waterfowl, and these data would be
beneficial to conservation planners charged with determining habitat suitability and availability
through the annual cycle of waterfowl.
1.8 Research Objectives and Predictions
My goal was to examine the relationship between declines in Dreissenid mussel
abundance (mussels/m2) and SAV that had appeared to have occurred since the peak mussel
population densities in the early 1990s (Petrie and Knapton 1999) to infer potential impacts on
6
abundance changed through time (year effect) and was influenced by substrate and water depth. I
predicted that changes in the distribution and abundance of SAV would have been consistent
with declines in Dreissenid mussel density. I also predicted that my estimates of angiosperm
(e.g., wild celery and pondweeds) and charophyte (e.g., muskgrass) SAV collected in 2009 and
2010 in LPB would be greater and lesser, respectively, than the estimates from the 1990s (Petrie
and Knapton 1999) 2) to quantify changes in above and belowground SAV biomass between
early autumn and late spring to determine the seasonal carrying capacity for waterfowl using
LPB. I predicted that SAV aboveground biomass would decrease more between autumn and
spring for those species that over-winter as belowground tubers and dormant seeds (wild celery,
pondweeds, or Najas spp. than for species such as muskgrass and Eurasian milfoil
(Myriophyllum spicatum), which retain aboveground vegetative structures during winter to a
lesser extent; and 3) because seasonal changes in biomass have implications for migrating
waterfowl, my last objective was to estimate the energetic carrying capacity within LPB. I
predicted that energy available from SAV was great enough to feed the average number of ducks
7
2
Methods
2.1 Study Area
My study was conducted at Long Point, Ontario (80° 30' E, 42° 35' N to 80° 03' E, 42°
33' N). Long Point is a sand-spit extending 35 km south-east into Lake Erie, and it has facilitated
the formation of the Inner and Outer Long Point Bays and associated freshwater marsh
complexes (Petrie 1998). The Inner Bay at Long Point is 78 km2 and mean depth (1 to 2 m)
varies depending upon annual and periodic changes in regional water budgets (Berst and
MaCrimmon 1966). Coverage of the Inner Bay by SAV is > 90% in most locales (Pauls and
Knapton 1993, Petrie 1998, Smith 1979). The mean temperature of the Inner Bay (22 oC; Pauls
and Knapton 1993, Smith 1979) provides favourable growing conditions for macrophytic SAV,
including muskgrass, wild celery, Eurasian milfoil, Najas spp., pondweeds, Canada water weed
(Elodea canadensis), and coontail (Ceratophyllum demersum; Petrie 1998). Big Creek is the
major tributary of the Inner Bay, and it drains a watershed comprised primarily of agricultural
land northwest of Long Point(Berst and MaCrimmon 1966, Leach 1981). Big Creek influences
the SAV communities in LPB because it is the primary source of nutrients and sediments in the
bay(Leach 1981). LPB substrate is predominantly mud at the mouth of Big Creek, sandy loam
over most of the central portion, and sand bordering the eastern and south-eastern portions
(Smith 1979).
2.2 Study Design and Sample Collection
I used a grid generated with geographic information system (GIS) software to uniformly
distribute 321 sampling stations throughout LPB (Figure 1). I used GPS coordinates to navigate
to sampling stations in the field. I collected SAV and Dreissenid mussels at the 321 stationsfrom
8
availability to ducks foraging during autumn and spring. SAV and Dreissenid mussel were
sampled at 100 stations selected using random stratification from 30 November – 7 December
2009. I collected SAV and Dreissenid mussels during these periods to enable comparisons of
seasonal biomass of food available to migrating ducks at LPB. A handheld GPS unit was used to
navigate to sampling stations throughout LPB. At each sampling station, I recorded water depth
and water clarity using a Secchi disc marked at 5 cm intervals. Using a digital thermometer (±
0.1 oC; Fisher Scientific 0666426), I also recorded water temperature at each sampling station. I
used a Self-Contained Underwater Breathing Apparatus (SCUBA) when diving to the substrate
where I collected SAV, Dreissenid mussel, and benthic substrate samples. I estimated SAV
percentage cover using a modified Braun-Blanquet scale of abundance and ascended to the
surface to record values. To create continuous values for multivariate analysis I modified the
Braun-Blanquet scale using categories 1-4 instead of 0-5. Using scissors I clipped all
aboveground SAV in a 0.5m x 0.5m quadrat at substrate level and placed the clippings in a
modified mesh bag to capture and strain samples. Tuber and substrate samples were collected
using three horizontal scoops of substrate with a perforated metal can (sample volume = 0.03 m3)
to emulate maximum foraging depth for diving ducks (Badzinski 2003). Dreissenid mussels were
removed from SAV samples on the deck of the boat, where I bottled and labelled each of the
mussel samples separately. Finally, I differentiated between above and belowground SAV
9
Figure 1. Locations for sampling Dreissenid mussels, SAV distribution and abundance, water depth, and substrate type within Long Point Bay, Lake Erie.
2.3 Laboratory Procedures
All species-specific aboveground vegetation samples were blotted dry using paper towel.
I weighed each sample using a digital balance (± 0.001 g; A&D Company Ltd. FX3000i) and
recorded values as wet mass. Belowground plant parts (i.e., roots, turions/tubers, and rhizomes)
were separated from benthic substrate using a fine mesh sieve (2 mm × 2 mm; Fisher Scientific
U.S. standard brass). Substrate type was classified into one of three groups (mud, sandy loam, or
sand) using the modified Wentworth scale (Wentworth 1922). Three substrate classifications
were selected based on previously reported substrate types within LPB (Smith 1979). Dry mass
of sub-samples was obtained to allow for estimation of dry mass for aboveground samples (by
species). I selected sub-samples from aboveground samples for each species and oven-dried
them separately at 80 °C to constant mass (± 0.001 g). I ensured that sub-samples represented the
range of wet masses observed in samples of each species. Thereafter, I used linear regression to
estimate dry mass using wet mass measurements (Table 1.). The only species I detected in 1km
10
belowground sampling was wild celery tubers and occurrence was negligible, accounting for
0.05% and 0.58% in autumn and spring respectively, of the total SAV biomass and were
included with the aboveground parts of wild celery in my analysis. The numbers of all dreissenid
11
Table 1. Linear regressions for conversion of wet weights to dry weights for species of SAV
sampled at Long Point Bay, Lake Erie, autumn 2009 and spring 2010.
Species n Intercept β R2
Chara vulgaris 23 2.5306 0.2544 0.99
Myriophyllum spicatum 32 0.2487 0.1524 0.98
Najas spp.
Najas flexilis
Najas guadalupensis
29
14
0.6847
0.1009
0.1218
0.1557
0.99
0.98
Potamogeton richardsonii 19 0.0341 0.1309 0.95
Potamogeton pusillus 25 0.6916 0.1141 0.99
12 2.4 Data Mapping and Analysis
2.4.1 SAV Distribution and Abundance
Abundance and distribution data from previous studies (1976, 1991, and 1992) were
obtained from Bird Studies Canada archives. In 1976, only cover data (using the Braun-Blanquet
scale) for each plant species were available. In 1991 and 1992, cover data for each plant species
were available, as well as water depth, Secchi depth, and Dreissenid mussel abundance. I used
inverse distance-weighted (IDW) spatial interpolation (Spatial Analyst tool, ArcGIS Desktop:
Release 10. Redlands, CA: Environmental Systems Research Institute) to estimate
species-specific distributions and changes in SAV and Dreissenid mussel distribution in LPB (Watson
and Philip 1985, Neckles et al. 2012). I mapped the abundances of Dreissenid mussels and the
six most abundant SAV species for 1976, 1991, 1992, and 2009 to provide a graphical
representation of community changes in LPB. The modified Braun-Blanquet scale described
above (to ensure data were ordinal) was used to map SAV. Using abundance of Dreissenid
mussels (mussels/m2) I was able to develop maps and show changes in relative abundance
among sampling periods. To test for temporal variation in mussel abundance, I used repeated
measures analysis of variance (ANOVA). Spatial interpolation provides a visual representation
of SAV coverage in LPB, but does not provide statistical comparisons of abundance among
years. Therefore, multivariate analysis of variance (MANOVA) was used to test for changes in
plant community (e.g., SAV) among years using SAV relative abundance data. I included
muskgrass, wild celery, Eurasian milfoil, Najas spp., slender pondweed (Potamogeton pusillus)
and Richardson’s pondweed (Potamogeton richardsonii) cover (modified Braun-Blanquet) as
response variables and year as a repeated measure to account for sampling the same points
through time. I included latitude and longitude as covariates to control for spatial autocorrelation
13
studentized residual plots from all models for normal distribution. I log-transformed SAV data to
normalize the residual distribution (Littell et al. 2007). I selected a 0.10 (α) level of significance
a priori because it is appropriate for observational data (Tacha et al. 1982). I used Wilks’
lambda and F-tests (type III sum of squares) to evaluate statistical significance of year effects
within multivariate (MANOVA) and univariate analyses, respectively.
Backwards elimination logistical regression was used to determine factors influencing
likelihood of detecting a species at a sampling station for the 6 most common species of SAV. I
included Dreissenid mussel abundance, substrate type, year, water depth, depth × depth, and
substrate × year as fixed effects and latitude and longitude as covariates to correct for spatial
autocorrelation. I included substrate × year to detect if changes in the likelihood of detecting
SAV changed through time within substrate types and within years among substrate types.
Secchi disk reading was not included, because it was strongly correlated with water depth (p <
0.01; r=0.90), but subject to greater error than water depth because of daily differences in
turbidity. I compared means of reduced models using post-hoc Tukey’s adjustment.
2.4.2 Energetic Carrying Capacity
Biomass of SAV, species-specific nutritional quality of plants, and information on energy
requirements of ducks were used to determine how many waterfowl the SAV in LPB could feed
during autumn, winter, and spring (i.e., SAV energetic carrying capacity). I compared the energy
available from SAV (kcal/m2) and requirements of migrating waterfowl using LPB to determine
energy surplus or deficit and how many ducks SAV could feed during winter if LPB remained
ice-free (i.e., consistent with climate change scenarios – see further discussion below). I
determined available energy by calculating g/m2 (dry mass) for each plant species within LPB. A
14
literature (Table 2). TME values represent energy available to waterfowl corrected for
endogenous (non-food) excretory energy and are appropriate for modeling of carrying capacity
(Sibbald 1976). Using inputs of dry biomass, TME and area in LPB, I calculated available
energy in LPB based on autumn 2009 and spring 2010 sampling.
I used data from standardized, aerial waterfowl surveys that were conducted
approximately once every two weeks, autumn and spring 1990-2006 (Long Point Waterfowl,
unpublished data) to estimate waterfowl usage of LPB. Duck Use Days (DUD) were determined
for each species by adding abundances on days of counts to estimates of abundance between
surveys. Duck abundances between surveys were estimated by averaging abundances from two
consecutive surveys and multiplying by the number of non-survey days between aerial surveys
(Korschgen et al. 1985). I calculated the energy needs of each waterfowl species that commonly
eats SAV using species-specific daily energy requirements (DER; Table 3). DER incorporates
the energetic costs of feeding and non-feeding behaviours and excludes the demands related to
reproduction, molt, and migration in waterfowl (Baldassarre and Bolen 2006). Because SAV is a
portion of total diet in waterfowl, I adjusted species-specific DER using data on waterfowl diets
(Petrie 1998), and the equation (see also Table 3):
Adjusted DER=DER × % stems/leaves in diet
To calculate energy needs of waterfowl derived from SAV in each season and year at
LPB, I multiplied adjusted DER by total seasonal DUDs for each species for autumn and spring
and summed energy requirements across species within seasons and years.
I considered autumn migration to be 15 September – 15 December (100 days) and spring
migration to be 1 March – 14 May (75 days). Autumn and spring migrations are separated by a
15
data; Bellrose 1980, Assel 2003). However, climate change scenarios and recent trends suggest
an increasing number of ice-free days at LPB (Assel 2003). To determine the energetic capacity
of SAV in LPB to feed waterfowl into winter, I calculated surplus energy by subtracting spring
energy needs of waterfowl using LPB 1990 - 2006 from estimates of energy available during
spring 2010. By subtracting the energy requirement in spring from energy available I
determined the surplus (or deficit) of energy estimated to be available for overwintering
waterfowl. I divided surplus energy by DER from stems and leaves (163.5 kcal/day; average of
grazing and diving ducks adjusted for stems/leaves only; Table 3) to determine available DUDs
16
Table 2. True metabolizable energy (TME) values (kcal/g) used to calculate energetic carrying
capacity for food items in Long Point Bay, Lake Erie during summer/fall 2009.
Food Item
TME
(kcal/g) Source
Ceratophyllum demersum 0.49 Brasher et al. 2007
Chara vulgaris 0.57 Boyd 1968
Myriophyllum spicatum 0.55 Boyd 1968
Najas spp. 0.82 Brasher et al. 2007
Potamogeton spp. 0.82 Brasher et al. 2007
Vallisneria americana
aboveground 0.78 Donnermeyer 1982
17
Table 3. Daily energetic requirements (DER) of species and guilds (bold) and the percentage of
diet consisting of stems/leaves of waterfowl species using SAV habitat within Long Point Bay,
Lake Erie (LPB). DER (guild) represents the mean of all species.
Species
DER (kcal/day)
% of diet consisting of stems/leaves
Grazers 268*
American wigeon (Anas americana) 255* 90.5†
Gadwall (Anas strepera) 280* 96.7†
Divers 274*
Bufflehead (Bucephala albeola) 213** 29.3†
Canvasback (Aythya valisineria) 347* 88†
Common goldeneye (Bucephala clangula) 249*** 51.7†
Redhead (Aythya americana) 311* 72.8†
Ring-necked duck (Aythya collaris) 234* 24.7††
Scaup (Aythya affinis and Aythya marila) 280* 9.3†
* Straub 2008
**McKinney and McWilliams 2012
*** DER migration = 3xBMR and DER wintering = 3xBMR (King 1974)
†
Petrie 1998
††
18
3
Results
3.1 Long-term Changes
3.1.1 Overall Changes
I detected an influence of sampling year on abundance of Dreissenid mussels in
LPB (F2,960=25.7, P<0.001) (Figure 2). Post-hoc comparisons indicated a 2110% increase
in Dreissenid mussel abundance between 1991 (mean number per site: 20.6) and 1992
(mean number per site: 456.8), and a 96% decrease between 1992 and 2009 (mean
number per site: 18.9) (P < 0.001), with no difference between 1991 and 2009 (P =
0.999). There was also an overall influence of sampling year on the percent cover of the
six most abundant SAV species in LPB between 1976 and 2009 (MANOVA: Wilks’ λ =
19 a
c b a
Figure 2. Distribution and abundance (mussels/m2) of
Dreissenid mussels in Long Point Bay – Lake Erie a)
1991 b) 1992 and c) 2009.
0 1km
0 1km
20
a
b
c
d
Figure 3. Distribution and.abundance (percent cover) of muskgrass (Chara vulgaris) in Long Point Bay – Lake Erie a) 1976 b) 1991
c) 1992 and d) 2009.
0 1km
0 1km
0 1km
21
Figure 4. Distribution and abundance (percent cover) of wild celery (Vallisnaria americana) in Long Point Bay – Lake Erie a) 1976
b) 1991 c) 1992 and d) 2009.
a
b
c
d
0 1km
0 1km
0 1km
22
Figure 5. Distribution and abundance (percent cover) of Najas spp. in Long Point Bay – Lake Erie a) 1976 b) 1991 c) 1992 and d)
2009
a
b
c
d
0 1km
0 1km
0 1km
23
Figure 6. Distribution and abundance (percent cover) of Eurasian milfoil (Myriophyllum spicatum) in Long Point Bay – Lake Erie a)
1976 b) 1991 c) 1992 and d) 2009.
a
b
c
d
0 1km
0 1km
24
Figure 7. Distribution and abundance (percent cover) of Richardson’s pondweed (Potamogeton richardsonii) in Long Point Bay –
Lake Erie a) 1976 b) 1991 c) 1992 and d) 2009.
a
b
c
d
0 1km
0 1km
25
gure 9. Distribution and abundance (percent cover) of slender pondweed (Potamogeton pusillus) in Long Point Bay – Lake Erie a)
a
b
c
d
Figure 8. Distribution and abundance (percent cover) of slender pondweed (Potamogeton pusilus) in Long Point Bay – Lakie Erie a)
1976 b) 1991 c) 1992 and d) 2009
0 1km
0 1km
26
a
b
c
d
Figure 9. Total energy available (kcal/m2) from submerged aquatic vegetation in autumn 2009 (a and c) and spring 2010 (b and d)
both with (a and b) and without (c and d) muskgrass (Chara vulgaris) in Long Point Bay – Lake Erie
0 1km
0 1km 0 1km
27 3.1.2 Species-specific Changes
Sampling year had an influence on the likelihood of detection for each of the six most
abundant SAV species’ (Table 4). Wild celery (P < 0.001; Figure 10), Richardson’s pondweed
(P < 0.001; Figure 10) and Eurasian milfoil (P < 0.001; Figure 10) had the highest detection
probability in sampling years 1991 and 1992. Najas spp. (P < 0.001; Figure 10) and muskgrass
(P < 0.001; Figure 10) were more likely to be detected in 1992, while slender pondweed (P <
0.001; Figure 10) was the only species with a higher detection probability in 2009.
Species responses to substrate type were varied; detection probability of muskgrass (P ≤
0.006; Figure 11) was greater on sand and sandy loam substrate, whereas slender pondweed (P =
0.018; Figure 11) and Eurasian milfoil (P < 0.001; Figure 11) were more likely to be detected on
mud substrate. The effects of substrate and sampling year had an interactive influence on the
detection probability of wild celery, Najas spp., and Richardson’s pondweed. Both wild celery
(P = 0.070; Figure 13) and Richardson’s pondweed (P = 0.019; Figure 13) had a higher detection
probability across all sampling years in mud substrate. Najas spp. (P < 0.001; Figure 13) was
more likely to be detected sandy loam during 1992, though this changed to mud in 1992 and
2009.
The likelihood of detecting Eurasian pondweed (P < 0.001; Figure 12), Richardson’s
pondweed (P = 0.002; Figure 12), and slender pondweed (P = 0.054; Figure 12) increased with
water depth. The detection probability of muskgrass decreased with increasing water depth
among all substrate types and sampling years (depth × depth) (Table 4, Figure 12). Najas spp.
28
Table 4. Results of the multiple logistic regression of the SAV distribution data (n=321).
Specific SAV species’ presence or absence was the response variable and the 11 site
characteristics were the explanatory variables.
Species Effect Estimate Error
Degrees of
freedom P X2
Wild Celery Intercept -1243.2 213.6 1 <0.001 33.8
Substrate 2 0.034 6.8
Mud -0.319 0.251 1
Sandy Loam -0.142 0.153 1
Depth -0.018 0.007 1 0.011 6.5
Year 2 0.067 5.5
1991 0.179 0.157 1
1992 0.162 0.162 1
Depth × Depth <0.001 <0.001 1 0.027 4.9
Substrate × Year 4 0.035 10.4
Muskgrass Intercept 1567.5 237.3 1 <0.001 43.6
Substrate 2 <0.001 22.1
Mud -0.56 0.208 1 0.007 7.2
Sandy Loam 0.671 0.144 1 <0.001 21.7
Depth 0.013 0.007 1 0.047 3.9
Year 2 <0.001 36.3
1991 -0.6 0.134 1 <0.001 19.9
1992 0.828 0.141 1 <0.001 34.6
Eurasian Milfoil Intercept -927.3 299.2 1 <0.001 16.4
Substrate 2 0.001 17.7
Mud 0.419 0.213 1 0.049 3.9
Sandy Loam -0.649 0.152 1 <0.001 17.7
Year 2 <0.001 90.5
1991 0.874 0.141 1 <0.001 38.6
1992 0.625 0.139 1 <0.001 20.3
Depth × Depth <0.001 <0.001 1 <0.001 11.6
Najas spp. Intercept -220.3 196.6 1 0.262 1.3
Substrate 2 <0.001 44.1
Sandy Loam 0.603 0.135 1 <0.001 20.1
Year 2 <0.001 104.4
29 Table 4. Cont
Species Effect Estimate Error DF P X2
Najas spp. Substrate × Year 4 <0.001 33.3
Richardson’s pondweed Intercept -618.4 240.1 1 0.01 6.6
Substrate
Mud 0.9420 0.734 1
Sandy Loam 0.1756 0.798 1
Depth -0.020 0.007 1 0.002 9.3
Year 2 <0.001 23.7
1991 2.787 0.635 1
1992 2.115 0.647 1
Depth × Depth <0.001 <0.001 1 0.002 9.9
Substrate × Year 4 0.047 9.7
Slender pondweed Intercept -1243.2 213.6 1 <0.001 33.9
Substrate 2 0.024 7.5
Mud 1.245 0.755 1
Sandy Loam -0.512 0.572 1
Depth -0.018 0.007 1 0.054 3.7
Year 2 <0.001 5.9
1991 -13.720 153.7 1
30
Figure 10. Least-squared means (log transformed) of percent abundance (± SE) for the most abundant
species of SAV in LPB: a) Wild celery b) Najas spp. c) Slender pondweed d) Richardson’s pondweed e)
Muskgrass and f) Eurasian milfoil.Years with the same letter are not significantly different (P > 0.10). b) a)
c) d)
31
Pre
di
ct
ed Pr
obab
il
it
y
Substrate Type Year
a)
b)
c)
Figure 11. Relationship between the predicted probability (± SE) of SAV presence (a)
muskgrass b) Eurasian milfoil c) slender pondweed) and the effects of substrate and year in
32
Figure 12. Relationship between the predicted probability of SAV
presence (a) wild celery b) muskgrass c) Eurasian milfoil d)
Richardson’s pondweed e) slender pondweed) and water depth (± 90%
confidence intervals) in Long Point Bay – Lake Erie in 1991, 1992, and
2009.
a)
e)
d) c)
33
a)
b)
c)
Figure 13. Relationship between the predicted probability (± SE) of SAV
presence (a) wild celery b) Najas spp. c) Richardson’s pondweed) and the
interactive effects of substrate and year in Long Point Bay – Lake Erie in
34
3.2 Seasonal Changes in Energetic Carrying Capacity
Muskgrass and wild celery provided the majority of SAV biomass within LPB during
both autumn and spring (Table 5). Mean biomass (g/m2 ± SE) of muskgrass during autumn was
60.6 ± 11.6, and spring mean biomass was 41.2 ± 3.4. Wild celery had a mean biomass of 3.2 ±
0.5 and 0.6 ± 0.5, during autumn and spring, respectively.
Based on the annual energy necessary to feed migrating diving and grazing ducks using
LPB, a surplus of available energy from SAV existed during autumn and spring when using SAV
data from 2009-2010 (Table 6 and Figures 15-18). I estimated that the mean adjusted energy
need of diving and grazing ducks migrating through LPB in autumn was 3.48 x 10⁸ kcals, 1990 -
2005. I calculated that there were 3.46 x 10⁹ kcals available in LPB in autumn 2009, leaving a
surplus of 3.11 x 10⁹ kcals available in LPB. However, because muskgrass is not consumed in
abundance by waterfowl in LPB (Petrie 1998), I removed it from the analysis to better estimate
available energy from SAV. My adjusted available energy estimate (muskgrass excluded) in
autumn was 7.63 x 10⁸ kcals, which represented a surplus of 4.16 x 10⁸ kcals. In spring, required
energy, adjusted for stems/leaves only, was 1.62 x 10⁸ kcals. The available energy (muskgrass
excluded) was 3.46 x 10⁸ kcals, with a surplus of 1.84 x 10⁸ kcals.
I also estimated required and available DUDs if LPB remained ice-free throughout
winter, exposing SAV to an additional 75 days of foraging. Using the surplus energy estimate
from spring 2010, between 1990-2006 (excluding 1998, in which I estimated a substantial deficit
of energy of -6 x 10⁷ kcals) the estimated ducks that LPB could feed each day for a 75 day
wintering period ranged from 3,466 (2.6 x 10⁵ DUDs) in 2000 to 24,000 (1.8 x 10⁶ DUDs) in
35
Table 5. Seasonal biomass (g/m2; mean ± SE), given by species of SAV in Long Point Bay, Lake Erie, Ontario autumn 2009 and
spring 2010.
Species Spring Mean Biomass (g/m2 ± SE) Autumn Mean Biomass (g/m2 ± SE)
Ceratophyllum demersum 0.48 ± 0.26 0.82 ± 0.21
Chara vulgaris 41.18 ± 8.35 60.55 ± 11.61
Myriophyllum spicatum 1.59 ± 0.76 3.20 ± 1.25
Najas spp. 1.17 ± 0.5 3.60 ± 1.05
Potamogeton richardsonii 0.07 ± 0.08 0.53 ± 0.24
Potamogeton pusillus 1.36 ± 1.43 1.54 ± 0.67
Vallisneria americana
aboveground 0.61 ± 0.49 3.20 ± 0.49
36
Table 6. Seasonal estimates of average required (1990-2006) and available energy (kcals; energetic carrying capacity) in LPB, Lake
Erie 2009.
Season Avg. Required† Avg. Required††
Total Carrying
Capacity Carrying Capacity*
Autumn 937,739,965 347,873,962 3,455,303,332 763,413,993
Spring 410,099,844 162,824,152 2,177,911,921 346,950,470
†
Total energy required
††
37 0
50,000,000 100,000,000 150,000,000 200,000,000 250,000,000
E
nerg
y
(
K
ca
l/s
ea
so
n)
Species
Required Energy
Required Energy from Stems/Leaves
Figure 14. Total required energy and the total required energy from stems/leaves for SAV
38 0 100,000,000 200,000,000 300,000,000 400,000,000 500,000,000 600,000,000 700,000,000 800,000,000 900,000,000
1991 1992 1993 1994 1995 1996 1997 1998 1999 2000 2001 2002 2003 2004 2005
E nerg y ( k ca l) Year
Required autumn energy (stems/leaves) Available autumn energy
0 500,000,000 1,000,000,000 1,500,000,000 2,000,000,000 2,500,000,000 3,000,000,000 3,500,000,000 4,000,000,000
1991 1992 1993 1994 1995 1996 1997 1998 1999 2000 2001 2002 2003 2004 2005
E nerg y ( k ca l) Year
Required autumn energy (stems/leaves) Available autumn energy
Figure 15. Available autumn energy and the required energy from the stems/leaves of SAV
within LPB (with Muskgrass).
Figure 16. Available autumn energy and the required energy from the stems/leaves of SAV
39 0 50,000,000 100,000,000 150,000,000 200,000,000 250,000,000 300,000,000 350,000,000 400,000,000 450,000,000
1991 1992 1993 1994 1995 1996 1997 1998 1999 2000 2001 2002 2003 2004 2005
E nerg y ( k ca l) Year
Required spring energy (stems/leaves) Available spring energy
0 500,000,000 1,000,000,000 1,500,000,000 2,000,000,000 2,500,000,000
1991 1992 1993 1994 1995 1996 1997 1998 1999 2000 2001 2002 2003 2004 2005
E nerg y ( k ca l) Year
Required spring energy (stems/leaves) Available spring energy
Figure 17. Available spring energy and the required energy from the stems/leaves of SAV within
LPB (with Muskgrass).
Figure 18. Available spring energy and the required energy from the stems/leaves of SAV within
40
4
Discussion
4.1 Long-term Changes
A diversity of fish and wildlife rely on SAV for food and cover in the Great Lakes region.
The distribution and abundance of SAV, and consequently its availability to fish and wildlife, is
a function of several environmental factors including light quantity, interspecific competition,
nutrient availability, herbivory, ice and storm damage, fluctuating water levels, temperature and
pH (Knapton and Petrie 1999, Petrie and Knapton 1999). However, Knapton and Petrie (1999)
determined that the introduction of Dreissenid mussels to the Inner Bay in the early 1990s had
the most pronounced recent influence on SAV. I initiated this study, in part, to assess the
abundance and distribution of Dreissenid mussels and SAV in LPB to make comparisons to prior
studies. Although the distribution of Dreissenid mussels in LPB has not changed since 1992,
total abundance has decreased substantially. The increase in Dreissenid mussel abundance in the
early-1990s resulted in increased water transparency and declines in all phytoplankton taxa and
chlorophyll concentrations in Lake Erie (Holland 1993). The decline in particulate matter within
the water column has likely contributed to the overall decline in Dreissenid mussels since 1992,
because they feed on phytoplankton. Furthermore, predation by both fish and waterfowl also
likely contributed to the decline in abundance of Dreissenid mussels (Mitchell 1995, Petrie and
Knapton 1999). As predicted, I detected changes in the SAV community that are consistent with
decreases in water clarity based on declining Dreissenid mussel abundance.
With the exception of slender pondweed, the 5 most abundant SAV species in LPB have
experienced declines in abundance since 1992. Although this response was predicted for
charophyte species in LPB (muskgrass), it contradicted the predicted increase in angiosperm
species abundance expected with more eutrophic conditions. Carter and Rybicki (1986)
41
attributed to either nutrient loading or water clarity. Because nutrient enrichment and light
availability are interrelated, it is possible that a synergistic effect could better explain SAV
growth within LPB. Although angiosperm SAV species are known to proliferate in eutrophic
water (Smith 1979), it is possible that there is a point at which there is not enough light available
to stimulate growth, regardless of nutrient availability. Inputs of nitrogen and phosphorus from
fertilizer applications can result in declines of SAV and enhancement of phytoplankton growth
(Twilley et al. 1985). Increased abundance of suspended particles in the water column decrease
light availability for SAV and reductions in growth are often observed. As such, the decline in
filter-feeding Dreissenid mussels in LPB and an associated increase in phytoplankton growth
may have reduced light availability for SAV below a threshold that retards growth of these
plants. My results suggest that SAV abundance is related to Dreissenid mussel densities within
LPB, with increased SAV and mussels in the 1990s. Further, SAV abundance decreased along
with a 96% decrease in mussel density between the mid-1990s and 2009.
Water depth and substrate type greatly influenced probability of detection for most species
of SAV I observed in LPB. My models could be used to predict future changes in SAV
communities in LPB, with decreasing water depth resulting from changes in climate and changes
in sediment loading from Big Creek. Winter precipitation and run-off are predicted to decrease
in the Great Lakes region, which would reduce spring run-off into LPB from Big Creek and
water coming from other areas of the Great Lakes watershed (Steen et al., 2006; Notaro et al.,
2014). Soil conservation practices aimed at reducing siltation in the Big Creek watershed
coupled with decreased flood intensity and duration from spring snow melt may reduce
development of mud substrate in LPB (Petrie 1998). My models predict that decreasing water
42
in LPB. Shifts in substrate type are difficult to predict, but my models suggest that decreases in
mud substrate would favor muskgrass relative to other SAV in LPB. Combined, decreased water
levels and mud substrate would favor muskgrass over other SAV in LPB. Muskgrass, while
eaten by waterfowl, is less preferred relative to pondweeds and wild celery (Bellrose 1980; Petrie
1998). Considering that 83% of the SAV community was musk grass in 2009, a scenario of
increasing musk grass would decrease plant diversity and quality of foods available to waterfowl
in LPB.
Further monitoring of SAV and Dreissenid mussels within LPB is necessary given the
importance of SAV to migrating waterfowl, especially diving ducks and dabbling ducks that
require an abundance of these plants to fuel migration (Petrie 1998, Baldassarree and Bolen
2006). Additionally, it would be beneficial for future studies to assess nutrient inputs and levels
in LPB, because they influence SAV growth and were not analyzed as part of this study. Nutrient
inputs also are important when considering substrate types in LPB. Big Creek flows into
northwest LPB, an area that is covered with dense, diverse stands of SAV. The Big Creek delta is
the only section of LPB that has a mud substrate, and this study shows the importance of this
substrate type to a variety of plants. Sediment from Big Creek watershed is deposited in LPB as
mud substrate and likely contributes substantially to turbidity, light attenuation, and nutrient
loading in LPB. Further research on landscape change and these inputs into LPB is necessary to
increase our ability to predict future changes to SAV in LPB. This study establishes a new
baseline for SAV and Dreissenid mussel distribution and abundance which can be used to detect
the ecological impacts of future invasive species introductions.
4.2 Energetic Carrying Capacity
Availability of food from SAV for waterfowl using LPB, particularly diving ducks, is at a
43
maximum aboveground biomass and begins shifting resources to propagules by late-September
(Rybicki and Landwehr 2007). Aboveground biomass senesces throughout the autumn, and is
further depleted through foraging by waterfowl and other wildlife. Remaining biomass is
available to spring migrating waterfowl after ice break-up, and was predicted to be potentially
limiting to foraging carrying capacity for waterfowl during the spring migration period.
Consistent with my prediction, data suggest that food availability and thus energetic
carrying capacity in LPB currently meets and exceeds the requirements of migrating waterfowl
in both the autumn and spring seasons (Figures 15-18). Considering all species of SAV, there is a
10-fold surplus of energy in LPB. However, previous studies suggest that some species of SAV
are avoided relative to their abundance. Specifically, in a study of waterfowl collected at LPB, it
was found that only Redhead and American wigeon consume muskgrass consistently (Petrie
1998), whereas it only occurred in trace amounts in other species. I determined that muskgrass
was > 80% of the plant community (dry weight) in autumn and spring, providing the majority of
potential available energy. When I excluded muskgrass from my analysis, energy available and
surplus were greatly reduced. Habitat managers should assess the utility of muskgrass for the
species of fish and wildlife that use LPB and, if justified, consider methods to reduce its
abundance while concurrently increasing availability of other SAV species to increase food
availability for waterfowl.
Over the past 30-years, percentage of ice cover has decreased and length of open water
periods has increased at the Great Lakes during winter (Assel 2003). Further, it is predicted that a
greater frequency of no-ice conditions will continue to increase with increased warming during
winter (Lofgren et al. 2002). I estimated potential increased foraging pressure if LPB was
44
from LPB. Decreased winter ice cover and associated increases in waterfowl foraging pressure
has the potential to decrease availability of SAV during spring migration.
My estimates suggested a wide range of available winter DUDs using energy needs of
waterfowl from 1990-2006 waterfowl surveys. In some years I detected an energy deficit in LPB,
but the 16-year mean suggests that LPB could support slightly over 16,000 ducks each day for
the 75 day wintering period without influencing availability of these plant foods for spring
migrating waterfowl. In winter 2011-2012, an estimated 30,000 redheads and canvasback spent
60 days at and around LPB in open water areas (M. Schummer, personal observation),
suggesting that recent trends in decreased ice cover during winter may currently have energetic
implications for spring migrating waterfowl in the Great Lakes basin. Specifically, this would
suggest that substantially less SAV biomass may be available to spring migrating waterfowl
requiring fuel to reach their breeding grounds. I was only able to compare the requirements for
wintering waterfowl with one year of availability data because my seasonal estimates are the
only ones on record. Thus, I suggest caution when interpreting estimates, because greater energy
needs of ducks (i.e., deficit years, Figure 18 – 1998) relative to availability suggest greater
availability of SAV or other foods eaten by waterfowl. Indeed, variation in abundance and
distribution of SAV is only quantified during 4 autumn periods (1976 – 2009) and I suggest that
variation among years and understanding mechanisms for these changes would greatly improve
our understanding of energetic carrying capacity of SAV in LPB. Further, the implication of a
greater number of ice-free days and associated foraging pressure could also be assessed. I also
suggest that waterfowl may shift to forage on muskgrass in years of greater foraging pressure or
decreased availability of preferred SAV. If waterfowl shift to forage on muskgrass when other
45
than was required by waterfowl that used LPB 1990–2006. Concurrently studying SAV and
Dreissenid mussel availability with waterfowl diets would help refine my energetic carrying
capacity estimates and our understanding of the potential influence of climate change on SAV
and waterfowl in LPB. In addition to understanding annual SAV and foraging dynamics, using
models that predict waterfowl migration based on weather severity to estimate how decreased ice
coverage and increasing temperatures may increase use of LPB by waterfowl during winter
46
5
References
Assel, R.A. 2003. Great lakes ice cover, first ice, last ice, and ice duration: Winters 1973-2002. Great Lakes Environmental Research Laboratory, US Department of Commerce, National Oceanographic and Atmospheric Administration.
Badzinski, S.S. 2003. Influence of tundra swans on aquatic vegetation and staging waterfowl at Long Point, Ontario. Unpublished Ph.D. dissertation, University of Western Ontario, London.
Badzinski, S.S. 2007. Toward rehabilitation of the Crown Marsh – Long Point, Lake Erie, Ontario. Unpublished report to the Long Point Crown Marsh Rehabilitation Steering Committee.
Badzinski, S.S., and Petrie, S.A. 2006. Lesser scaup spring nutrient reserve dynamics on the lower Great Lakes. Wildlife Society Bulletin 34:395-407.
Baldassarre, G.A., and Bolen, E.G. 2006. Waterfowl ecology and management. Malabar, Fl: Kreiger.
Beatley, T., Brower, D.J., and Schwab, A.K. 2002. An introduction to coastal zone management. Island Press. Washington DC.
Bellrose, F. C. 1980. Ducks, Geese, and Swans of North America. Harrisburg, Pa: Stackpole.
Berst, A.H., and McCrimmon, H.R. 1966. Comparative summer limnology of Inner Long Point Bay, Lake Erie, and its major tributary. Journal of the Fisheries Research Board of Canada. 23:275-291.
Bildstein, K.L., Bancroft, G.T., Dugan, P.J., Gordon, D.H., Erwin, R.M., Nol, E., Payne, L.X., and Senner, S.E. 1991. Approaches to the conservation of coastal wetlands in the Western Hemisphere. The Wilson Bulletin. 103: 218-254.
Blindlow, I. 1992. Long- and short term dynamics of submerged macrophytes in two shallow eutrophic lakes. Freshwater Biology 28:15-27.
Brasher, M.G., Steckel, J.D., and Gates, R.J. 2007. Energetic carrying capacity of actively and passively managed wetlands for migrating ducks in Ohio. Journal of Wildlife
Management. 71:2532-2541.
Boyd, C.E. 1968. Fresh water plants: a potential source of protein. Society for Economic Botany. 22:359-368.
47
Crowder, A.A., and Bristow, J.M. 1988. The future of waterfowl habitats in the Canadian lower Great Lakes wetlands. Journal of Great Lakes Research 14:115-127.
Day, J.W. Jr, Hall, C.A.S, Kemp, W.M., and Yanez-Arancibia, A.1989. Estuarine ecology. Wiley, New York, New York.
Donnermeyer, G.N. 1982. The quantity and nutritive quality of Vallisneria americana biomass, in navigation pool No. 9 of the upper Mississippi River. M.A. Thesis. University of Wisconsin – La Crosse, La Crosse Wisconsin.
Hamilton, D.J., Ankney, C.D., and Bailey, R.C. 1994. Predation of Zebra mussels by diving ducks: An exclosure study. Ecology. 75:521-531.
Holland, R.E. 1993 Changes in planktonic diatoms and water transparency in Hatchery Bay, Bass Island area, western Lake Erie since the establishment of the zebra mussel. Journal of Great Lakes Research. 19:617-624.
King, J.R. 1974. Seasonal allocation of time and energy and resources in birds. Avian Energetics. 15: 4-85
Knapton, R.W., and Petrie, S.A. 1999. Changes in distribution and abundance of submerged macrophytes in the Inner Bay at Long Point, Lake Erie: implications for foraging waterfowl. Journal of Great Lakes Research. 25:783-798.
Korschge, C.E., George, L.S., and Green, W.L. 1985. Disturbance of diving ducks by boaters on a migrational staging area. Wildlife Society Bulletin. 13:290-296.
Kufel, L. 2001. Chara beds acting as nutrient sinks in shallow lakes – a review. Aquatic Botany. 72: 249-260.
Leach, J.H. 1981. Comparative limnology on inner Long Point Bay, Lake Erie, and adjacent waters of the outer bay. Journal of Great Lakes Research. 7:123-129.
Littell, R.C., Milliken, G.A., Stroup, W.W., Wolfinger, R.D., and Schabenberger, O. 2007 SAS for mixed models. SAS Institute, Cary, NC.
Lofgren, B.M., Quinn, F.H., Clites, A.H., Assel, R.A., Eberhardt, A.J., and Luukkonen, C.L. 2002. Evaluation of potential impacts on Great Lakes water resources based on climate scenarios of two GCM’s. Journal of Great Lakes Research. 28(4):537-554.