Western University Western University
Scholarship@Western
Scholarship@Western
Electronic Thesis and Dissertation Repository
8-9-2017 12:00 AM
Navigating the "little brain": Comprehensive Mapping of Functional
Navigating the "little brain": Comprehensive Mapping of Functional
Organisation
Organisation
Maedbh King
The University of Western Ontario
Supervisor
Joern Diedrichsen
The University of Western Ontario
Graduate Program in Neuroscience
A thesis submitted in partial fulfillment of the requirements for the degree in Master of Science © Maedbh King 2017
Follow this and additional works at: https://ir.lib.uwo.ca/etd
Part of the Bioinformatics Commons, Cognitive Neuroscience Commons, Computational Neuroscience Commons, and the Systems Neuroscience Commons
Recommended Citation Recommended Citation
King, Maedbh, "Navigating the "little brain": Comprehensive Mapping of Functional Organisation" (2017). Electronic Thesis and Dissertation Repository. 4882.
https://ir.lib.uwo.ca/etd/4882
Abstract
Two decades of neuroimaging research suggests that the cerebellum is functionally involved in a range of cognitive and motor processes. However, missing from the literature is a comprehensive map detailing a clear functional organisation of the cerebellum. Previous studies have used a restricted task-mapping approach to localise task-specific functional activation to cerebellar lobules. However, this approach, which is often limited to one or two functional domains within individual subjects, fails to characterise the full breadth of functional specialisation within the cerebellum. To overcome this restricted task-mapping problem, we tested 17 subjects on a condition-rich task battery (61 task conditions) across 4 scanning sessions. We then adopted a bottom-up approach, which allowed us to characterise functional activations in terms of latent features, rather than tasks. In this way, we were able to describe a broad spectrum of
heterogeneous activity patterns using 11 latent features (rather than 61 task conditions). In deriving a functional map, we found that functional boundaries did not coincide with a lobular assignment, challenging the validity of the standard lobular nomenclature. This work offers two novel contributions to the field. First, the task battery that we designed is the most
comprehensive to date, making this work the veritable “look-up table” for functional topography of the cerebellum. Second, we show that functional and lobular boundaries do not align. Thus, we challenge the field to revise the standard lobular nomenclature, to include functional
subdivisions. In addition, we encourage the community to use the rich dataset generated by this expansive task battery with the aim of advancing the field towards a unified and testable theory of cerebellar function.
Keywords
Acknowledgements
Table of Contents
Abstract ... i
Acknowledgements ... ii
List of Tables ... iv
List of Figures ... v
1.Introduction ... 1
1.1 The Cerebellum is Functionally Heterogeneous ...1
1.2 Clinical Evidence ...1
1.3 Neuroimaging Evidence ...2
1.4 Cortical-Cerebellar Loops ...3
1.5 Gap in the Literature ...3
1.6 Comprehensive Map of Functional Organisation: A Novel Approach ...4
1.7 Summary of Results ...5
2. Methods... 6
2.1 Participants and Ethics Statement ...6
2.2 Behavioural Training ...6
2.3 Scanning Sessions ...6
2.4 Image Acquisition ...7
2.5 General Procedural Details ...7
...10
2.6 Imaging analysis ...11
2.7 Evaluation of Task-Evoked Activity Patterns ...12
2.8 Evaluation of Representational Structure ...12
2.9 Estimating a Comprehensive Map of Functional Organisation ...13
3. Results ... 15
3.1 Summary of Methods ...15
3.2 Activity Maps ...15
3.3 Understanding Task Structure in the Cerebellum ...19
3.4 Comprehensive Map of Functional Organisation ...24
...26
3.5 Functional Boundaries Do Not Coincide with Lobular Assignment ...27
4. Discussion ... 28
4.1 Summary of Approach and Results ...28
4.2 Functional Topography Relative to Previous Investigations ...28
4.3 Functional Boundaries of the Cerebellum ...31
4.5 Limitations of the Current Work ...31
4.4 Understanding the “What” and “Why” of Cerebellar Heterogeneity ...32
4.6 An Outlook to the Future of Cerebellar Neuroimaging ...33
5. Conclusion ... 34
5.1 Two Main Contributions to the Field ...34
List of Tables
Table 1. fMRI Study 1 Task Design……….14
List of Figures
Figure 1: Motor Feature Maps………..21
Figure 2: Task Activity Maps………...23
Figure 3: Reliability of Activity Patterns……….24
Figure 4: Representational Dissimilarity Matrix (RDM)……….26
Figure 5: Multi-Dimensional Scaling Plots (MDS)……….27
Figure 6: Reliability of Distances………28
Figure 7: Task Loadings onto Motor Features……….30
Figure 8: Comprehensive Map of Functional Organisation……….31
1.Introduction
1.1 The Cerebellum is Functionally Heterogeneous
The cerebellum, otherwise known as the “little brain’ is located on the back of the brainstem at the midbrain-hindbrain junction. Although it may be “little”, it contains roughly 50 billion neurons, approximately half the total number of neurons in the human brain (Azevedo et al. 2009). Traditional views of the cerebellum hold that the processing power of this structure is dedicated exclusively to sensorimotor control and learning, with important roles in coordination (Thach, 1998), balance (Morton and Bastian, 2004) and timing (Ivry and Keele, 1989). With the emergence of cognitive neuroscience in the 1980’s, it was first suggested that the cerebellum could be functionally involved in non-motor processes (see Schmahmann 1991, 2010 for
reviews). Leiner, Leiner, and Dow et al. (1986) formalised this idea, based on the finding that, in primates, the cerebellar cortex expanded in parallel with association regions of the cerebral cortex. Since this original paper, anatomical, clinical, and neuroimaging studies have
substantiated this original hypothesis by demonstrating an involvement of the cerebellum in a wide range of cognitive, motor, and affective processes (for reviews, see Fiez, 1996;
Schmahmann, 1996; Strick et al. 2009; Timmann et al. 2010).
1.2 Clinical Evidence
The cerebellum has been predominately associated with motor control, primarily for the reason that clinical manifestations following cerebellar damage relate most demonstrably to motor function impairments. For example, neurodegenerative diseases such as spinocerebellar ataxias (SCA’s) often lead to clinical manifestations of ataxic gait, dysarthria, dysmetric, and
dysdiadochokinesia (Manto, 2005) while cerebellar lesions can result in motor dysmetria and intention tremor (Holmes, 1939). However, cerebellar abnormalities have also been attributed to a host of social and cognitive impairments, and many neuropsychological studies have reported impairments on perceptual, executive, linguistic, emotional and cognitive tasks in patients with focal or degenerative disorders of the cerebellum (Botez-Marquard et al. 1994; Grafman et al. 1992; Levisohn et al. 2000; Molinari et al. 2004; Riva and Giorgi, 2000; Schmahmann et al. 2007). Indeed, there is strong evidence for a functional topography of the cerebellum based on structure-function relationships in sub-regions of this structure. Namely, the constellation of cognitive deficits, otherwise known as “cerebellar cognitive affective syndrome” (CCAS; Schmahmann and Sherman, 1998), occurs more often following posterior lobe damage (Schmahmann and Sherman, 1998) while sensorimotor impairments, such as ataxia, and dysmetria, are most often observed following anterior lobe damage (Schmahmann et al. 2009). Further, damage to the posterior midline vermal regions (Levisohn et al. 2000) has been linked to dysregulation of affective processing, predominately in children. The accumulation of this
clinical work, although inconsistent, points towards a functional involvement of the cerebellum in different cognitive, motor, and affective processes.
1.3 Neuroimaging Evidence
The advent of functional neuroimaging, in particular functional magnetic resonance imaging (fMRI), provided a unique opportunity to corroborate previous clinical findings by observing
cerebellar activity in vivo in human participants. This eventually lead to an explosion of papers
demonstrating cerebellar activations in response to motor, cognitive, and affective processing. Classically, fMRI studies have substantiated the well-documented finding of motor specialisation in the cerebellum, revealing a distinct somatotopy for hand, foot, and even tongue
representations. Specifically, there are two ipsilateral representations of hand movements, one in the anterior and the other in the posterior cerebellum (Wiestler et al. 2011), while saccadic eye movements are typically localised to the oculomotor vermis (Takagi et al. 1998). Extending beyond the motor domain, Petersen and colleagues published a pioneering positron emission tomography (PET) study, which revealed a prominent activation in right lateral cerebellum while participants performed a semantic retrieval task (Petersen et al. 1989). In the past 25 years, more than 15,000 fMRI studies have reported blood oxygen level dependent (BOLD) signal changes in the cerebellum during a wide range of mental and motor activities. Some examples are
sensorimotor processing (Grodd et al. 2001), semantic discrimination (Xiang et al. 2003), sensory processing (Blakemore et al. 2001), mental imagery (Lotze et al. 1999), classical conditioning (Thurling et al. 2015), linguistic processing (Ackermann et al. 1998), attentional modulation (Allen et al. 1997), timing estimation (Ivry and Keele, 1989), and emotion perception (Schmahmann, 2000).
One important insight to be gained from this extensive neuroimaging literature is that, functionally, the cerebellum is highly heterogeneous (for meta-analyses, see Stoodley and Schmahmann, 2009; Van Overwalle et al. 2014; Stoodley, 2012). Across studies, different tasks reliably activate different locations on the cerebellar cortex. The classic nomenclature of the cerebellum has focused on its lobular structure, with the 10 lobules (numbered I – X) organised along the superior to inferior axis (Larsell, 1947). Each lobule includes a vermal (medial) and hemispheric (lateral) component. The largest lobule VII is further subdivided into VIIa (Crus I and Crus II) and VIIb. On a broad level, the anterior lobe of the cerebellum is thought to be specialised for motor function, while the posterior lobe activates predominately in response to non-motor or “higher-order” cognitive processes (Stoodley and Schmahmann, 2010; Timmann et al. 2008). Beyond a relatively crude motor/non-motor dichotomy of cerebellar specialisation, there are other findings of cerebellar function that have been extensively reported in the literature. First, much like the cerebral cortex, there are laterality effects in the cerebellum, namely, there appears to be a right-hemisphere lateralisation for language and verbal working memory tasks (Crus I and II) while spatial processing tasks are lateralised to the left hemisphere of Crus I and II. Second, based on clinical and neuroimaging work, there is a possible
specialisation for affective and emotional processing in the vermis of the cerebellum (Schmahmann et al. 2007). Overall, cerebellar activity patterns are elicited in response to a plethora of tasks that span numerous cognitive, affective, social, and motor domains (for
1.4 Cortical-Cerebellar Loops
Evidence for functional heterogeneity in the cerebellum, as established by clinical and functional neuroimaging studies, is largely supported by early observations from anatomical work. The cerebral cortex projects to the cerebellum via the pontine nuclei. This projection constitutes one of the largest fiber systems in the human brain. Importantly, the system is organised in a highly specific manner, with each functional module of the cerebellum receiving input from a different cortical area. This finding is perhaps explained by the fact that the cerebellum evolved in parallel with the frontal lobes (Rilling and Insel, 1998) and that cerebellar areas interconnected with the prefrontal cortex (PFC) underwent a greater expansion compared to the somatomotor regions of the cerebellum. This highly organised topography is not specific to the cerebellar cortex, indeed ventral portions of the cerebellar dentate nucleus, the major output station from the cerebellum to the PFC, expanded much more rapidly than the dorsal portion, which connects the cerebellum with motor regions of the cerebral cortex. This expansion of the prefrontal cortical-cerebellar loop (Balsters et al. 2010) likely endowed the human cerebellum with an involvement in higher-order cognitive processes, providing an anatomical substrate for cerebellar contribution to cognition (Schmahmann and Pandya, 1997). These insights from evolution have been supported by studies using polysynaptic tracing agents in non-human primates. Specifically, polysynaptic tracing studies in non-human primates have shown that each functional area of the cerebellum appears to receive input from a relatively small cerebral area. For example, tracers injected into Brodmann area 46 label restricted lateral parts of Crus II. Importantly, the combined use of anterograde and retrograde viruses has shown that Area 46 projects to, and receives input from the same cerebellar area. These insights have motivated a vertical, closed-loop conceptualisation of the cerebellum, where each cerebellar region tightly interacts with a restricted set of cerebral regions. These circuits, demonstrated using connectional data from non-human primates, have also been reported using resting state functional correlations, demonstrating functionally and anatomically distinct cerebrocerebellar circuits (Buckner et al. 2011; Habas et al. 2009; O’Reilly et al. 2010). While the majority of the cerebral cortex projects parasynptically to the cerebellum, there are no known anatomical connections between the cerebellar cortex and the inferior
temporal gyrus and the primary visual cortex. Interestingly, in human brains, the dominant contribution to the cerebellum comes from the PFC and parietal lobe, with approximately 70% of all cortical-cerebellar projections originating from cerebral association areas. What this suggests is that PFC and parietal inputs to the cerebellum are at least, if not more, significant than inputs arising from the cerebral motor cortex. Overall, anatomical work promotes the idea that the cerebellum operates in a closed-loop circuitry with distinct regions of the cerebellum, both receiving projections from, and projecting back to these regions (Botez et al. 1985; Kelly & Strick, 2003; Middleton & Strick, 1994; Schmahmann, 1991, 1996; Voogd & Glickstein, 1998).
1.5 Gap in the Literature
The past two decades of neuroimaging, clinical, and anatomical work suggests an involvement of the cerebellum in tasks spanning motor, cognitive, affective, and social domains. Despite
attempted to understand functional specialisation of the cerebellum by mapping task-evoked activations to different locations on the cerebellar cortex, which were particularly responsive to some, or all, aspects of the task. Using this approach, most studies concluded that because region X was significantly activated by task A, it must follow that region X is functionally specialised for task A processing. Of course, the obvious problem with this restricted task-mapping approach is that it fails to fully characterise the functional specialisation of region X. In order to build up a fully representative picture of specialisation within region X, it is necessary to demonstrate that this region also becomes active in response to tasks B, C, and D, but not to tasks, E, F, and G. By incorporating a broader task battery, we avoid making specious inferences based on restricted task-mappings, and instead achieve a more complete understanding of functional specialisation within a given brain region (i.e. the cerebellum).
To provide a complete map of the functional organisation of the cerebellum, it is far more powerful to summarise activation in terms of features rather than tasks. A feature can be thought of as a hypothetical tuning function, a model of what the activation profile of a single unit of measurement (i.e. voxel) could be. Feature-based approaches, which describe activity patterns using latent variables of the data (i.e. bottom-up), are a particularly powerful way of providing an overall characterisation of functional organisation. By abstracting from task labelling, feature-based approaches can characterise the functional specialisation of a particular region for bottom-up features that are encoded by task-evoked activity patterns. This way, a region is not in danger of becoming a “theory of mind” region. Rather, functional activation within this region is
described in terms of an underlying feature that is inherent to some, if not all, aspects of a certain set of tasks.
1.6 Comprehensive Map of Functional Organisation: A Novel Approach
The primary aim of this work was to provide a comprehensive map of functional organisation in the cerebellum, using a bottom-up feature-based approach. We define functional topography as the spatially ordered projection of task-evoked activations to functionally specialised locations on the cerebellar surface. To do this, it was necessary to depart from traditional methods and procedures and adopt a novel and rather radical task design. Specifically, we acquired a condition-rich dataset (34 tasks; 61 task conditions) on seventeen participants across four separate fMRI scanning sessions, resulting in 8 hours of fMRI data per subject. This unique and exhaustive task battery was chosen for the express purpose of exploring the full breadth of the functional subspace spanned by the cerebellum, on the same set of subjects. The tasks included in the current design were chosen to reflect a broad range of motor, cognitive, and affective domains, far exceeding the scope of existing datasets (5-task maximum; Stoodley et al. 2012) that have been utilised to explore functional topography in the same set of subjects.
stereotaxic atlas, which partly explains its absence from many early fMRI studies. Of course, not only does this reduce the power of a meta-analytic approach but it also misrepresents the existing literature, which would introduce a bias into a meta-analysis. Second, the majority of studies report group-level, cluster activations in favour of individual-subject, unthresholded activity patterns. Group-level reporting is a problem because it obviates any existing inter-subject variability, while thresholded clustering fails to capture the full functional profile of activation. There are other problems with the meta-analytic approach, namely that imaging acquisition and analysis steps (i.e. field strength, sequence type, preprocessing pipelines etc) are inconsistent across studies, introducing variability into the results. Similarly, studies often include drastically different sample sizes, which impact the reliability of the findings. While a meta-analytic
approach is useful for providing a summary of the literature, it is not amenable to bottom-up feature modelling. For this reason, we decided to collect a condition-rich dataset on the same set of subjects, which allowed us to derive a comprehensive map of functional organisation using bottom-up feature modelling.
1.7 Summary of Results
2. Methods
2.1 Participants and Ethics Statement
All experimental procedures were approved by the nonmedical research ethics committee at Western University. All subjects gave their informed consent prior to study commencement. There were 21 subjects in study 1 and 17 of this original cohort returned approximately one year later (mean=11 months, s.d.=12 weeks) to participate in study 2. The 4 subjects (mean
age=24.19, s.d.=2.26) who did not return for study 2 were not included in the study 1 analysis. Therefore, in total, 17 healthy, right-handed individuals (10 females, 7 males; mean age=26.34, s.d.=4.25) with no self-reported history of neurological or psychiatric illness were included in both study 1 and study 2 analyses. Right-handedness was confirmed by a score greater than 40 on the Edinburgh Handedness Inventory (Oldfield, 1971).
2.2 Behavioural Training
All 17 participants underwent three days of training on the study 1 and study 2 task batteries respectively. All tasks except for rest and the three movie tasks (landscape, nature, and romance) were trained. For each study, all three behavioural sessions took place over the course of 5-7 days. Tasks were tested in short blocks of 35 s. An instruction screen was presented for the first 5 s of each block, specifying the upcoming task and instructions (e.g., ‘Theory of Mind Task!’ Use your LEFT hand. 1 = false belief. 2 = true belief), followed by 30 s for the designated task. On-line feedback was provided for response-dependent tasks (green or red squares to indicate correct or incorrect responses, respectively), and an overall accuracy score was provided at the end of the run for tasks requiring a button response. The first day was used to familiarise the
participants with the requirements for each of the 17 tasks. On the second day, 11 of the 17 tasks, those requiring button-press responses, were grouped together into 7-minute runs so that
participants could learn to alternate between tasks, and on the third day, participants practiced all 17 tasks in 10-minute runs. On training days 1 and 2, participants could read through the
instructions at their own pace while the instructions were automatically paced on the third training day, to prepare participants for testing in the scanner. The training program ensured that participants were familiar with task requirements and that they were experienced at switching between tasks. On the third behavioural training day, all participants reached asymptotic
performance (>85% correct on all tasks) with this amount of training. In this manner, we reduced the impact of learning during the scanning sessions.
2.3 Scanning Sessions
tasks and runs) to allow for cross-subject analyses on the time series level (results not presented here). Participants were well-trained on the tasks at the time of scanning, therefore, to reduce the recall of specific stimulus-response associations, novel sets of stimuli were used, where possible, across all imaging runs (see Tables 1 and 2 for full description).
2.4 Image Acquisition
All fMRI data were acquired at the Centre for Functional and Metabolic Mapping (CFMM) at Western University on a 3T Siemens scanner. Whole-brain functional images were acquired using an EPI sequence with multi-band acceleration (factor 3, interleaved) with an in-plane acceleration (factor 2), developed at the Centre for Magnetic Resonance Research at the University of Minnesota. Imaging parameters were: TR=1 sec, FOV=20.8cm, phase encoding direction=P>>A, acquiring 48 slices with in-plane resolution of 2.5 mm x 2.5 mm and 3 mm thickness. GRE field maps were also acquired in order to apply distortion correction in case EPI images were distorted due to B0 inhomogeneities (TR=.5 s, FOV=24 cm, 46 slices with in-plane resolution of 3 mm x 3 mm x 3 mm. We also acquired online physiological recordings of both heart and respiration during each functional run given that task-related changes in heart rate can impact the estimation of the hemodynamic response and first-level general linear model fit (Hillenbrand, Ivry, & Schlerf, 2016). No participants had to be excluded from either study 1 or study 2 due to excessive motion. For anatomical localisation and normalisation, a 5 min high-resolution scan of the whole brain was acquired (MPRAGE, FOV=15.6cm x 24 cm x 24 cm, at 1x1x1 mm voxel size).
2.5 General Procedural Details
We tested 17 tasks in study 1 and 17 tasks in study 2. Participants performed each of the 17 tasks for 35 s, once per scanning run. Each 35 s task was divided into a 5 s instruction period followed by a 30 s execution period. The motivation for testing all tasks in a run (rather than assigning one task per run) was to ensure a common baseline for all tasks, enabling optimal between-task comparison. Many of the tasks in both study 1 and study 2 were divided into more than one condition (e.g. simple finger movements and finger sequences in the motor task) resulting in a total of 29 task conditions for study 1 and 32 task conditions for study 2. Where possible, novel stimuli were introduced across imaging runs to reduce stimulus-response learning. For a full description of the tasks, along with the accompanying references, see Tables 1 and 2.
Shared Tasks
To assess the test-retest reliability of cerebellar activity patterns, 8 tasks from study 1 were repeated in study 2 (tasks flagged by an asterisk in Tables 1 & 2). Three of the 8 tasks (object N-Back, visual search, semantic retrieval) had a discrete trial structure, whereby each unique stimulus (e.g. picture, letter, noun) was presented 15 times for 1.6 s at a time, and the response was completed within this window, followed by an inter-trial interval (ITI) of 400 ms.
Exceptions were the motor task (trials=8; stim/resp duration=4.6 s; ITI=400 ms), theory of mind (trials=2; stim/resp = 9.6/4.6 s; ITI=400 ms) and action observation (trials=2; stim duration=14 s; ITI=1 s) while spatial navigation and rest did not have a discrete trial structure (trials=1;
Unique Tasks
There were 9 tasks unique to study 1 (i.e. tasks not shared with study 2). Six tasks had the same discrete trial structure, whereby a unique stimulus was presented 15 times for 1.6 s and the response was completed within this window, followed by an ITI of 400 ms. Exceptions were Go-No Go (trials=30; stim/resp duration=800 ms; ITI=200 ms) and motor imagery (trials=1;
duration=30 s; ITI=0 s). Similar to study 1, there were 9 unique tasks in study 2. The movie tasks (landscape, romance, and nature) did not have a discrete trial structure (trials=1;
duration=30 s; ITI=0) while the prediction, spatial map, and response alternatives tasks had the same trial structure (trials=6; stim/resp=4.8 s; ITI=200 ms). The other 3 tasks had a different trial structure: mental rotation (trials=9; stim/resp duration=3 s; ITI=300 ms), body motion processing (trials=10; stim/resp duration=3; ITI=0), rules task (trials=4; stim/resp duration=7.3s; ITI=200 ms).
Hand Assignment Across Tasks
To reliably elicit ipsilateral- and contralateral activation in the “hand knob” regions of the cerebellum, tasks requiring a motor response were assigned to either the left or right hands. The hand assignment was consistent across study 1 and 2 for the shared tasks to ensure test-retest reliability. For tasks requiring 2-choice discrimination, responses were made with the index or middle finger of the designated hand. All finger-press responses were recorded on a four-key button box.
Eye-Tracking
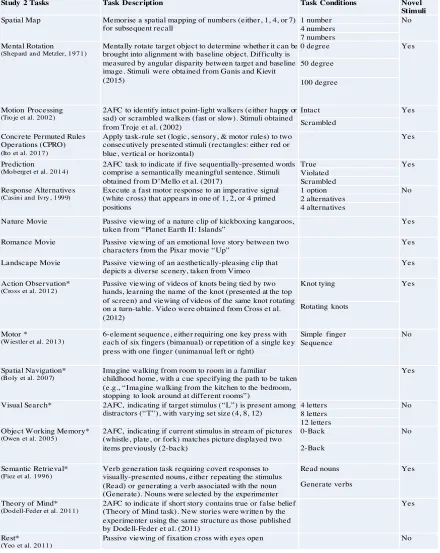
In total, there were 17 tasks in study 1 that were divided into 29 task conditions. Novel stimuli were introduced where possible (fourth column). Abbreviations: AFC – Alternative Forced Choice; IAPS – International Affective Picture System
Study 1 Tasks Task Description Task Conditions Novel Stimuli
Checkerboard (Krasnow et al. 2003)
Passive viewing, pictures of objects and a checkerboard pattern. Pictures were obtained from IAPS
No
Motor
(Wiestler et al. 2013)
6-element sequence , either requiring one key press with each of six fingers (bimanual) or repetition of a single key press with one finger (unimanual left or right)
Single finger No
Sequence
Action Observation (Cross et al. 2012)
Passive viewing of videos of knots being tied by two hands, learning the name of the knot (presented at the top of screen) and viewing of videos of the same knot rotating on a turn-table. Video were obtained from Cross et al. (2012)
Rotating knots Yes
Knot tying
Motor Imagery (Boly et al. 2007)
Imagine playing an energetic game of tennis No
Spatial Navigation (Boly et al. 2007)
Imagine walking from room to room in childhood home, with a cue specifying the path to be taken (e.g., “Imagine walking from the kitchen to the bedroom, stopping to look around at different rooms”)
Yes
Interval Timing (Schubotz et al. 2001)
2AFC, indicating if a tone is short (100ms) or long (175ms)
No
Arithmetic (Rickard et al. 2000)
2AFC, indicating if simple multiplication equations (e.g. 2x7=14) are correct or incorrect. For control task, participants viewed a series of four numbers (5,2,4,2) and indicated presence/absence of target number (e.g., 1)
Number identification Yes
Arithmetic Verification
Visual Search (Donner et al. 2002)
2AFC, indicating if target stimulus (“L”) is present among distractors (“T”), with varying set size (4, 8, 12)
4 letters No
8 letters 12 letters Stroop
(Egner et al. 2005)
3AFC, indicating color of stimulus word (red, blue, green, or yellow), comparing conditions in which colour-word mapping is congruent or incongruent
Congruent No
Incongruent
Verbal Working Memory (Owen et al. 2005)
2AFC, indicating if current stimulus in stream of letters (a, b, or c) matches letter displayed two items previously (2-back)
0-Back No
2-Back
Object Working Memory (Owen et al. 2005)
As above, with pictures (fire hydrant, lamp, or zip) instead of letters (2-back)
0-Back No
2-Back Semantic Retrieval
(Fiez et al. 1996)
Verb generation task requiring covert responses to visually-presented nouns, either repeating the stimulus (Read) or generating a verb associated with the noun (Generate). Example nouns were obtained from Kurland et al. (2014)
Read nouns Yes
Generate verbs
Affective Processing (Moulton et al. 2011)
2AFC, indicating if picture (scenes, animals, foods) is pleasant or unpleasant. Pictures were obtained from IAPS
Pleasant No
Unpleasant Facial Emotions
(Baumann et al. 2012)
2AFC, indicating if picture depicts sad or happy face. Pictures were obtained from IAPS
Happy No
Sad Go No-Go
(Elliott et al. 2000)
Go-No Go task with positive (Go) or negative (No Go) words. Stimuli were obtained from Elliott et al. (2000)
Go No
No-Go Theory of Mind
(Dodell-Feder et al. 2011)
2AFC to indicate if short story contains true or false belief. Example stories obtained from Dodell-Feder et al. (2011)
Yes
Rest
(Yeo et al. 2011)
Passive viewing of fixation cross with eyes open No
In total, there were 32 task conditions in study 1. Shared tasks (i.e. tasks common to both study 1 and study 2) are highlighted here with an asterisk. The task design for these shared tasks remained the same across both studies. Novel stimuli were introduced where possible (indicated by ‘yes’ or ‘no’ in the fourth column). Abbreviations: AFC – Alternative Forced Choice.
Study 2 Tasks Task Description Task Conditions Novel
Stimuli
Spatial Map Memorise a spatial mapping of numbers (either, 1, 4, or 7) for subsequent recall
1 number No
4 numbers 7 numbers Mental Rotation
(Shepard and Metzler, 1971)
Mentally rotate target object to determine whether it can be brought into alignment with baseline object. Difficulty is measured by angular disparity between target and baseline image. Stimuli were obtained from Ganis and Kievit (2015)
0 degree Yes
50 degree
100 degree
Motion Processing
(Troje et al. 2002)
2AFC to identify intact point-light walkers (either happy or sad) or scrambled walkers (fast or slow). Stimuli obtained from Troje et al. (2002)
Intact Yes
Scrambled Concrete Permuted Rules
Operations (CPRO)
(Ito et al. 2017)
Apply task-rule set (logic, sensory, & motor rules) to two consecutively presented stimuli (rectangles: either red or blue, vertical or horizontal)
Yes
Prediction
(Moberget et al. 2014) 2AFC task to indicate if five sequentially-presented words comprise a semantically meaningful sentence. Stimuli
obtained from D’Mello et al. (2017)
True Yes
Violated Scrambled Response Alternatives
(Casini and Ivry, 1999) Execute a fast motor response to an imperative signal (white cross) that appears in one of 1, 2, or 4 primed
positions
1 option No
2 alternatives 4 alternatives Nature Movie Passive viewing of a nature clip of kickboxing kangaroos,
taken from “Planet Earth II: Islands”
Yes
Romance Movie Passive viewing of an emotional love story between two characters from the Pixar movie “Up”
Yes
Landscape Movie Passive viewing of an aesthetically-pleasing clip that depicts a diverse scenery, taken from Vimeo
Yes
Action Observation*
(Cross et al. 2012) Passive viewing of videos of knots being tied by two hands, learning the name of the knot (presented at the top
of screen) and viewing of videos of the same knot rotating on a turn-table. Video were obtained from Cross et al. (2012)
Knot tying Yes
Rotating knots
Motor *
(Wiestler et al. 2013) 6-element sequence, either requiring one key press with each of six fingers (bimanual) or repetition of a single key
press with one finger (unimanual left or right)
Simple finger No Sequence
Spatial Navigation*
(Boly et al. 2007)
Imagine walking from room to room in a familiar childhood home, with a cue specifying the path to be taken (e.g., “Imagine walking from the kitchen to the bedroom, stopping to look around at different rooms”)
Yes
Visual Search* 2AFC, indicating if target stimulus (“L”) is present among distractors (“T”), with varying set size (4, 8, 12)
4 letters No
8 letters 12 letters Object Working Memory*
(Owen et al. 2005)
2AFC, indicating if current stimulus in stream of pictures (whistle, plate, or fork) matches picture displayed two items previously (2-back)
0-Back No
2-Back
Semantic Retrieval*
(Fiez et al. 1996)
Verb generation task requiring covert responses to visually-presented nouns, either repeating the stimulus (Read) or generating a verb associated with the noun (Generate). Nouns were selected by the experimenter
Read nouns Yes
Generate verbs
Theory of Mind*
(Dodell-Feder et al. 2011)
2AFC to indicate if short story contains true or false belief (Theory of Mind task). New stories were written by the experimenter using the same structure as those published by Dodell-Feder et al. (2011)
Yes
Rest*
(Yeo et al. 2011)
2.6 Imaging analysis
Image Preprocessing
Data preprocessing was carried out using tools from SPM 12 (Friston et al. 1994), Caret (Van Essen, 2012), Freesurfer (Fischl, 2012) and SUIT (Diedrichsen, 2006; Diedrichsen et al. 2009), as well as custom-written scripts written in MATLAB 2015b. The same processing pipeline was used for both study 1 and study 2. For all participants, the anatomical image was acquired in the first scanning session and it was then resliced into the Left-Inferior-Posterior (LPI) coordinate frames and the location of the anterior commissure was set to the origin of the image (xyz coordinate [0 0 0]). Functional data from sessions 1 and 2 were aligned using the 6-parameter rigid body transformation and the anatomical image was co-registered with the mean functional image. The aligned functional images were then realigned to the co-registered mean functional image. Smoothing was not applied to the functional images.
General Linear Model
A general linear model (GLM) was used to fit whole-brain data for study 1 and study 2
separately, using 29 and 32 task regressors respectively. The success of the GLM in estimating true neural signal from the data was determined by a measure of pattern consistency (i.e. signal-to-noise) yielded by the model fit. The high-dimensional autocorrelation model (FAST option in SPM), which determines the optimal temporal autocorrelation yielded the best signal-to-noise (SNR). Traditional high-pass filtering (HPF), as implemented in SPM was not applied. Instead, the FAST option was used as a filter in the GLM. The betas from the first-level GLM were univariately prewhitened: the betas were divided by the square root of the residual mean square image. Rather than using rest as a common reference, we used the mean of all task conditions during this session. This resulted in a more stable estimate of activation as we do not consider rest to yield zero activation, rather it involves specific activations of the so-called default mode network (Yeo et al. 2011).
SUIT
The spatially unbiased infratentorial template (SUIT) toolbox (v3.2) in SPM 12 was used to isolate the cerebellum from the rest of the brain and to provide a normalisation to the spatially unbiased template of the cerebellum. The segmentation implemented in the SUIT toolbox in SPM 12 was used to create tissue probability maps of cerebellar grey and white matter, and a cerebellar grey-matter isolation mask. The cerebellar isolation mask was modified to ensure that there were no shared voxels between the superior cerebellum and the directly abutting cortical regions of the inferior temporal and occipital cortex. A buffer zone was created by isolating the shared voxels between the occipital cortex and the superior cerebellum. This buffer zone was then removed from the cerebellar and cortical masks and visualised in the MRIcron tool
(http://people.cas.sc.edu/rorden/mricron/index.html) to ensure that there were no shared voxels
on a surface-based, flat-map representation of the cerebellar cortex, freely available in the SUIT toolbox (see Diedrichsen & Zotow, 2015 for more details).
2.7 Evaluation of Task-Evoked Activity Patterns
Motor Feature Model
We wanted to visualise task-evoked activity patterns in the cerebellum that extended beyond the domain of motor function. However, many of the 61 task conditions, although not designed to test motor function, were likely to evoke motor-related function (i.e. saccadic eye movements for a visual search task). Therefore, to account for motor-related activations across all 61 task
conditions, we built a motor feature model, which included three classical motor features: left and right hand movements (i.e. number of button presses), and saccades (i.e. number of eye movements). All motor features were normalised by the duration of each task condition. A velocity-based algorithm, implemented in the Eyelink toolbox (Cornelissen et al. 2002)
identified saccadic eye movements as periods in which the rate of change of the position of gaze
surpassed a fixed velocity threshold of 30deg/s. To provide an estimate of saccadic eye
movements, a group-averaged measure of saccades was computed per task condition. For example, tasks that required sentence-reading (i.e. social cognition task), elicited, on average, a larger number of saccades relative to tasks with little-to-no visual stimuli (i.e. rest).
We computed a design matrix for each individual subject that comprised the three motor features plus the 29 (study 1) and 32 (study 2) task conditions (identity matrix with 1 on the diagonal for each task condition). Then, to remove the influence of the motor features from the activation maps, we calculated an L2-norm regression (i.e. ridge regression) on the activation estimates of each individual subject. The “cleaned-up” activation estimates were then averaged across subjects and mapped onto the surface of the cerebellar cortex.
Reliability of Activity Patterns
To determine the within-subject reliability (across scanning sessions) and the true functional variability of the activity maps across subjects, we conducted a correlational analysis of activity patterns (across voxels). All correlations were calculated on all task conditions and on all voxels in SUIT space. To determine the within-subject reliability, we correlated the estimates from the
1st and 2nd session within each subject and session. These correlations could be directly
compared to the between-session, between-subject correlations. The difference in these two correlations were then taken as a measure of the true inter-subject variability of the functional organisation of the cerebellum.
2.8 Evaluation of Representational Structure
Distance Measure
differed from study 1 to 2, introducing a different baseline, therefore, dissimilarity estimates had to be estimated and predicted separately for both study datasets.
Reliability and Visualisation of Distance Measures
Between-subject reliability of the representational dissimilarity matrix (RDM) was computed by taking the average correlation of distances, across all possible participant pairs for study 1 and study 2 separately. Within-subject reliability was similarly computed by taking all possible session pairs, within each subject. The diagonal of the RDM was excluded from this correlational analysis. To quantify the heterogeneity of task-evoked activity patterns, one-sample t-tests
against zero (corrected for multiple comparisons) were calculated for all possible pairwise distances for the study 1 and study 2 representational matrices respectively.
Classical multidimensional scaling (MDS) was employed to visualise the distances between all possible pairs of task conditions for study 1 and study 2 separately. MDS is an effective
visualisation technique that projects the N-dimensional RDM into a lower-dimensional space so
that distances from the higher space are preserved with as much integrity as possible. MDS was performed on the group-averaged RDM and the first three dimensions were visualised in a 3-dimensional space. Although the coordinates corresponding to the task conditions can be rotated in the multi-dimensional space, we just show one example projection for the purposes of
visualisation. An agglomerative hierarchical clustering function was implemented in MATLAB and it was used to assign each task condition to a cluster. This clustering approach, which used a Euclidean distance as a measure of dissimilarity between pairs of tasks, allowed for optimal visualisation of task similarity in a 3-dimensional space.
2.9 Estimating a Comprehensive Map of Functional Organisation
We used spatial independent component analysis (ICA) to derive a functional feature map of the cerebellar cortex. ICA (Calhoun, 2009) attempts to describe the activity profile at each location on a map as a linear combination of a number of latent features. Each feature is characterised by an activation profile across tasks along with a map demonstrating how it is distributed across the cerebellar cortex. Spatial ICA attempts to make the spatial maps as independent as possible.
ICA was performed on the univariately prewhitened and group-averaged activity estimates, without first accounting for the motor features. The Fast ICA pipeline (Hyvarinen, 1999) started with a Principal Component Analysis (PCA) to reduce the group-averaged activity
estimates from an N-dimensional space to a lower dimensional projection, retaining the first 11
components (or “features”) best capturing >95% of the variance of the data. ICA then rotated these 11 axes non-orthogonally to maximize the non-Gaussianity of the task-evoked activity patterns. Each feature was assigned either a negative or positive sign by the fastICA algorithm. To capture the full spectrum, the feature matrix (11 features x P voxels) was modified to include both the positive and negative signs of each source (22 features x P voxels). A “winner-take-all” approach was then performed so that each vertex of the cerebellar surface was assigned to the feature (either positive or negative) that explained the largest amount of variance. From this “winner-take-all” approach, each feature was then assigned a colour, creating a map that detailed a bottom-up, functional organisation of the cerebellum.
of the features comprised a different weighting of task-evoked activity patterns. To determine which task conditions loaded most strongly onto each feature, the feature matrix was projected into task space. As a further visualisation, the task weights for two given features (e.g. feature 1 & 2) were plotted against each other to determine differences in task loadings.
Lobular versus Random Tessellation
We wanted to assess whether the functional boundaries, defined in the bottom-up feature map, coincided with the lobular nomenclature. The first step was to randomly tessellate the surface of the cerebellum 1000 times to test a null model of functional/lobular boundary correspondence. Random tessellations were calculated by computing a Voronoi tessellation, which partitioned the cerebellar surface into regions based on a distance measure between sampled points. As these tessellations were randomly constructed, the boundaries were not expected to overlap with meaningful functional or lobular demarcations. Then a G-test was calculated, first between each random tessellation and the latent feature map, and then between the lobular tessellation and the latent feature map. A G-test is a test that assesses the likelihood-ratio between observed and expected values. For example, the null model of the G-test states that a vertex in region X of the randomly tessellated map does not have any bearing on the same vertex being present in region Y of the latent feature map. By computing one likelihood-ratio estimate for each random tessellation (with the latent feature map), we built a null model that described the mutual information shared between maps. Similarly, we also calculated a likelihood-ratio estimate for the lobular tessellation (with the latent feature map) to determine whether the expected overlap between these two maps differed from the null distribution. This analysis allowed us to
3. Results
3.1 Summary of Methods
We implemented a novel approach, one that offers a dramatic departure from existing studies, in order to derive a comprehensive map of functional organisation in the cerebellum. To this end, we have developed an extensive task battery, comprising 34 tasks (or 61 task conditions) that leverages known functional heterogeneity, thereby allowing us to explore the full breadth of activity patterns in this structure. While conventional approaches typically describe a cerebellar region as being activated by a given task (task-mapping approach), we were interested in describing cerebellar activation in terms of its latent structure. To do this, we used a bottom-up approach to obtain the latent features that accounted for variance of the cerebellar activity patterns. Then, using a “winner-take-all” approach, these features were mapped onto the surface of the cerebellum, yielding a comprehensive, bottom-up map of functional organisation.
3.2 Activity Maps
To visualise the activity patterns of the 61 task conditions, we first corrected the activity maps for the three shared low-level motor features (see methods). Task-evoked activity patterns were then averaged across subjects, which were then presented as unthresholded maps on a flat representation of the cerebellar cortex (Diedrichsen and Zotow, 2015). We chose a flat-map representation for data visualisation so that the full spatial extent of task-evoked activity patterns could be visualised all at once. The disadvantage of the traditional volume-based displays is that they only provide one particular view of the data, and it is often the case that alternative
visualisations of neighbouring slices tell different visual stories.
Motor Feature Maps
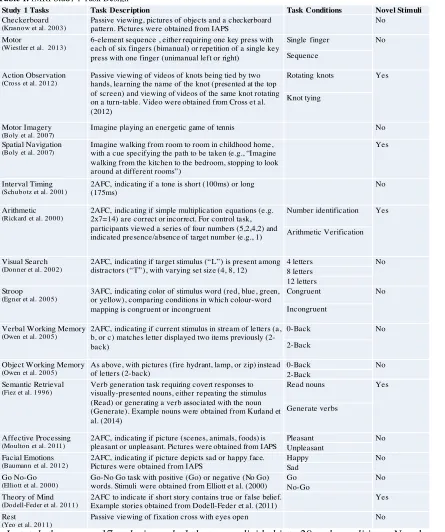
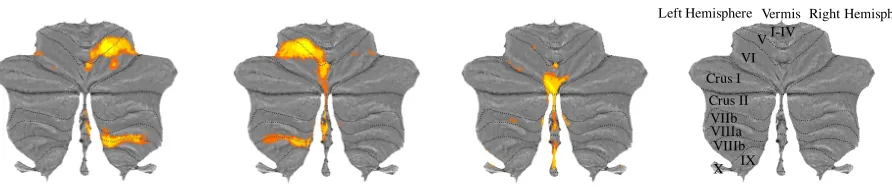
There was a distinct and stable somatotopy in the human cerebellum for left and right hand function (Figure 1A & 1B) and saccadic eye movements (Figure 1C). These results serve to validate the functional specialisation of the cerebellar motor cortex (V/VI lobular boundary and lobule VIIIb) for the representation of finger movements, and the oculomotor vermis as the region activated for saccadic eye movements. Left and right hand activity patterns closely
corresponded to previously reported finger-specific representations in the “hand knob” regions of the human cerebellum (Wiestler et al. 2011). The localisation of saccadic activation to the
Task-Evoked Activations
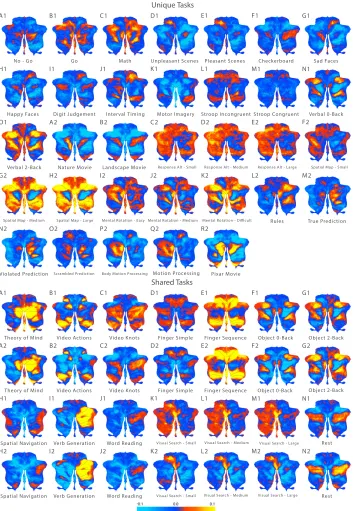
Even after accounting for motor requirements, the task conditions elicited distinct activity patterns in the cerebellum (Figure 2). Many tasks elicited a distributed spatial profile of activation that spanned many lobules, both in the anterior-to-posterior and medial-to-lateral directions.
Motor
In particular, complex finger sequences (shared: E) and the visual search task (shared: K-M) elicited strong activity in “hand knob” regions of the cerebellum (lobules V, VI) as well as the saccadic regions (oculomotor vermis) while the action video (shared: B), activated somatomotor regions surrounding the primary motor areas (VI, VIIb, VIIIa & VIIIb).
Social Cognition
In contrast to the motor-related tasks, medial hemispheric regions of Crus I and II were strongly activated by social cognitive tasks: the theory of mind task (shared: A) and the romance movie (unique: R2). Further, abstract mentalising tasks such as spatial navigation (shared: H) and motor imagery (unique: K1), elicited weak activations in lobule IX.
Working Memory
Tasks with high memory load: verbal N-Back (unique: N1-O1), picture N-Back (shared: F-G) and the spatial map task (unique: F2-H2) elicited bilateral activity in the most lateral aspects of Crus I.
Dynamic Viewing
Natural viewing tasks: nature and landscape movies (unique: A2-B2), and the romance and knot-viewing movies (unique: R2; shared: C) bilaterally activated medial Crus I and II and lobule IX.
Laterality Effects
Laterality effects were also observed for both the right and left cerebellar hemispheres. Tasks that required semantic and/or logical reasoning such as the permuted-rules and prediction tasks (unique: L2-O2) were right lateralised to Crus I hemisphere and lobule VIIb. Similarly, verb generation (shared: I), but not noun reading (shared: J), was strongly right lateralised to Crus I and II, while biological motion processing tasks (unique: P2-Q2) were left lateralised to Crus I and II.
Figure 1. Motor Feature Maps. Group-averaged activation estimates for right hand presses (A), left hand presses (B), and saccadic eye movements (C) presented on a flat-map representation of the cerebellar surface where lobules (I-X) are demarcated by dashed black lines across the left and right hemispheres and the vermis (D).
A. B. C. D.
Left Hemisphere Vermis Right Hemisphere I-IV
V VI Crus I
Crus II VIIb VIIIa
Remaining Tasks
Affective and emotional processing of pleasant/unpleasant and happy/sad pictures did not elicit distinct activation patterns compared to the passive viewing of checkerboards (unique: D1-H1). Similarly, executive function tasks such as the Go/No-Go (unique: A1-B1) and stroop tasks (unique: L1-M1) did not elicit very strong or distinct activity patterns, much beyond motor-related activations. Highly automatised tasks such as noun reading (shared: J) and simple finger movements (shared: D) showed activity similar to rest (shared: N), with relatively high activity across the full extent of Crus I and II, the equivalent of a default-mode network within the cerebellum (Habas et al. 2009; Buckner et al. 2011).
Figure 2. Task Activity Maps. Unthresholded, group-averaged activity patterns for 61 task conditions (after the removal of activity patterns related to basic motor output). Upper panel: tasks unique to study 1 (denoted by 1) and tasks unique to study 2 (denoted by 2). Lower panel: tasks shared across study 1 (denoted by 1) and study 2 (denoted by 2). Brighter
colours indicate increased activation and darker colours indicate decreased activations (both relative to baseline).
Unique Tasks
Shared Tasks No - Go
A1
Checkerboard Go Math Unpleasant Scenes Pleasant Scenes
B1 C1 D1 E1 F1
Stroop Incongruent
Sad Faces
Happy Faces Digit Judgement Interval Timing Motor Imagery
G1
H1 I1 J1 K1 L1
Verbal 2-Back
Stroop Congruent Verbal 0-Back
M1 N1
O1
Spatial Map - Small Response Alt - Small Response Alt - Medium Response Alt - Large
Nature Movie Landscape Movie
A2 B2 C2 D2 E2 F2
Rules
Spatial Map - Medium Spatial Map - Large Mental Rotation - Easy Mental Rotation - Medium Mental Rotation - Difficult
G2 H2 I2 J2 K2 L2
True Prediction
Violated Prediction Scrambled Prediction Body Motion Processing Motion Processing Pixar Movie
M2
N2 O2 P2 Q2 R2
Theory of Mind Video Actions Video Knots Finger Simple Finger Sequence Object 0-Back
A1 B1 C1 D1 E1 F1
Object 0-Back Finger Sequence
Finger Simple Video Knots
Video Actions Theory of Mind
A2 B2 C2 D2 E2 F2
Object 2-Back
Spatial Navigation Verb Generation Word Reading Visual Search - Small Visual Search - Medium
G1
H1 I1 J1 K1 L1
Visual Search - Medium Visual Search - Small
Word Reading Verb Generation
Spatial Navigation
Object 2-Back
L2
J2 K2
I2 H2
G2
Visual Search - Large Rest
Rest
Visual Search - Large
M1 N1
Reliability of Activity Patterns
In our paradigm we chose to study the functional organisation of the cerebellum in a small set of participants across a broad range of tasks. This contrasts with a meta-analytical approach that compares activation patterns both across tasks and subjects. The advantage of the former
approach is that we can account for the inter-subject variability of the functional organisation. To measure the extent to which the functional organisation is shared or idiosyncratic, we computed the correlation of the activity patterns of all tasks between every possible pair of subjects and sessions.
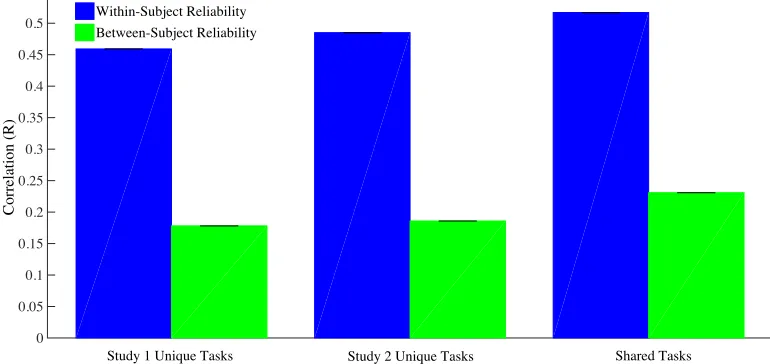
Within- and between-subject values were calculated for the average betas (Figure 3), and separately for tasks unique to study 1, tasks unique to study 2, and shared tasks. Average task-evoked activity patterns were reliable within the same subjects (i.e. across independent scanning sessions) and these correlations were consistent across datasets; R=.45 for unique study 1 tasks, R=.48 for unique study 2 tasks, and R=.51 for shared tasks. Similarly, average task-evoked activity patterns were reliable across subjects and again, these correlations were consistent across datasets; R=.17 for unique study 1 tasks, R=.19 for unique study 2 tasks, and R=.22 for shared tasks.
Thus, we found that the task activity patterns were reliable, even on a voxel-by-voxel basis without any applied spatial smoothing. Further, we found that there was considerable and true inter-subject variability, accounting for approximately 60% of the systematic variance of these functional maps. This stresses the importance of a “deep phenotyping” approach (Poldrack et al. 2015) in trying to understand functional organisation in the brain.
3.3 Understanding Task Structure in the Cerebellum
Univariate contrast analysis, computed from the first-level general linear model (GLM), was
0 0.05 0.1 0.15 0.2 0.25 0.3 0.35 0.4 0.45 0.5
Correlation (R)
Within-Subject Reliability Between-Subject Reliability
Study 1 Unique Tasks Study 2 Unique Tasks Shared Tasks
from investigating individual task maps, however, is limited. Specific regions do not activate for one set of tasks only, but usually are co-activated to a certain degree by many different task paradigms. Rather than labelling a specific cerebellar region as being the “theory-of-mind region”, our approach allows us to determine the underlying processes or features that best describe task-evoked cerebellar activation.
Here, we take a purely “bottom-up” approach to this question, trying to infer the latent task activations from the cerebellar activity patterns. As a first step, we visualised the arrangement of the different tasks in functional space. Multivariate analysis, specifically representational
similarity analysis (RSA), achieves this goal by quantifying pairwise similarity measures of task-evoked activity patterns, on the same set of subjects. This approach complements a univariate analysis by providing a quantitative measure of similarity between all pairs of task-evoked activity patterns. By compiling these distance measures into a representational dissimilarity matrix (RDM), we were able to provide a quantitative measure of task similarity. Further, to visualise the relative similarity of task conditions in a representational space, we projected the data into a lower dimensional space and visualised a 3-dimensional projection using multi-dimensional scaling (MDS). Overall, representational similarity analysis proved exceptionally useful for both quantifying and visualising the “uniqueness” of task-evoked activity patterns in the cerebellum.
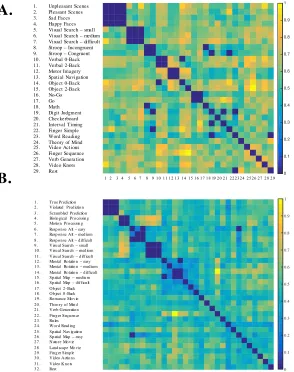
Representational Dissimilarity Matrix (RDM)
A representational dissimilarity matrix (RDM) was computed for the pairwise dissimilarities for study 1 (29 task conditions) and study 2 (32 task conditions) separately. Dissimilarity was given in terms of the cross validated squared Mahalonbis distance between the true activity patterns for pairwise task conditions, normalised by the number of voxels. Of all the possible pairwise
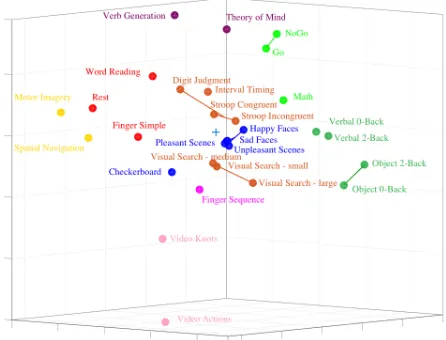
Multi-Dimensional Scaling (MDS)
In order to visualise the relative similarity of task conditions in representational space, the distance measures were projected into a lower dimensional space. While the MDS plot can be rotated to project different 3-dimensional views, one example projection was chosen for visualisation purposes for both study 1 (Figure 5A) and study 2 (Figure 5B). Task conditions were organised into 9 (study 1) and 8 (study 2) distinct clusters, characterised by high similarity of task-evoked activations. For example, in both study 1 and 2, simple finger movements and word reading were very similar to the rest condition while the complex finger sequence task was very distinct from most other task conditions. Again in both studies, working memory tasks (study 1: verbal and object N-Back; study 2: object N-Back and spatial map) clustered together. In study 1, picture-based tasks, such as happy/sad faces, checkerboard, and pleasant/unpleasant scenes were clustered together while movie-based tasks in study 2 (landscape, nature, and action observation movies) were highly similar. In both study 1 and study 2, there were certain tasks,
1 2 3 4 5 6 7 8 9 10 11 12 13 14 15 16 17 18 19 20 21 22 23 24 25 26 27 28 29 30 31 32 0 0.1 0.2 0.3 0.4 0.5 0.6 0.7 0.8 0.9 1 1 2 3 4 5 6 7 8 9 10 11 12 13 14 15 16 17 18 19 20 21 22 23 24 25 26 27 28 29 0 0.1 0.2 0.3 0.4 0.5 0.6 0.7 0.8 0.9 1
A.
1. Unpleasant Scenes2. Pleasant Scenes 3. Sad Faces 4. Happy Faces 5. Visual Search – small 6. Visual Search – medium 7. Visual Search – difficult 8. Stroop – Incongruent 9. Stroop – Congruent 10. Verbal 0-Back 11. Verbal 2-Back 12. Motor Imagery 13. Spatial Navigation 14. Object 0-Back 15. Object 2-Back 16. No-Go 17. Go 18. Math 19. Digit Judgment 20. Checkerboard 21. Interval Timing 22. Finger Simple 23. Word Reading 24. Theory of Mind 25. Video Actions 26. Finger Sequence 27. Verb Generation 28. Video Knots 29. Rest
1 . Tru e Pred ictio n 2 . Vio lated Pred ictio n 3 . Scramb led Pred ictio n 4 . Bio lo g ical Pro cessin g 5 . Mo tio n Pro cessin g 6 . Resp o n se Alt – easy 7 . Resp o n se Alt – med iu m 8 . Resp o n se Alt – d ifficu lt 9 . Visu al Search – small 1 0 . Visu al Search – med iu m 1 1 . Visu al Search – d ifficu lt 1 2 . Men tal Ro tatio n – easy 1 3 . Men tal Ro tatio n – med iu m 1 4 . Men tal Ro tatio n – d ifficu lt 1 5 . Sp atial Map – med iu m 1 6 . Sp atial Map – d ifficu lt 1 7 . Ob ject 2 -Back 1 8 . Ob ject 0 -Back 1 9 . Ro man ce Mo v ie 2 0 . Th eo ry o f Min d 2 1 . Verb Gen eratio n 2 2 . Fin g er Seq u en ce 2 3 . Ru les 2 4 . Wo rd Read in g 2 5 . Sp atial Nav ig atio n 2 6 . Sp atial Map – easy 2 7 . Natu re Mo v ie 2 8 . Lan d scap e Mo v ie 2 9 . Fin g er Simp le 3 0 . Vid eo Actio n s 3 1 . Vid eo Kn o ts 3 2 . Rest
1 2 3 4 5 6 7 8 9 10 11 12 13 14 15 16 17 18 19 20 21 22 23 24 25 26 27 28 29
1 2 3 4 5 6 7 8 9 10 11 12 13 14 15 16 17 18 19 20 21 22 23 24 25 26 27 28 29 30 31 32
B.
namely, verb generation, theory of mind, finger sequence, and video actions and knots that elicited the most dissimilar activity patterns in the cerebellum.
Overall, The MDS plots for study 1 and study 2 indicate a rich representational structure in the cerebellum for task conditions spanning multiple motor, cognitive, and affective domains. In particular, tasks that engage working memory processes as well as social cognitive processes seem to be particularly successful in differentially activating specialised regions of the
cerebellum while tasks that rely on heavy visual input (picture-based tasks) do not elicit strong or distinct differences.
A.
B.
Figure 5. Multi-dimensional scaling (MDS) plots in three dimensions depicting the relative similarity of the activity patterns for study 1 (A) and study 2 (B) task conditions.
Reliability of distances
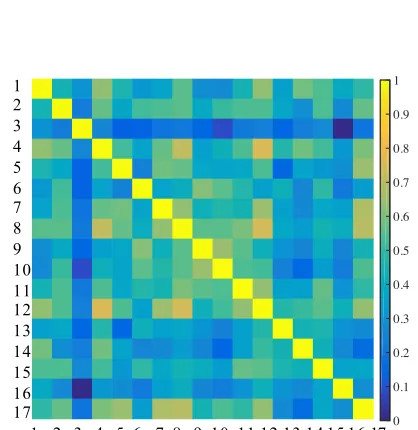
The RDM and MDS results were presented on the group-level. Therefore, to ensure both
between- and within subject consistency of distance measures, we computed 1) between-subject correlations for each individual subject RDM, and 2) within-subject correlations for the 14 task conditions common to study 1 and study 2 (across 4 scanning sessions). The average between-subject correlation was .54 for the study 1 RDM and .61 for the study 2 RDM while the within-subject correlation for shared tasks was .88. We can report good between- and within-within-subject reliability of distance measures, which indicates 1) that on average, similar patterns of activation were elicited across subjects, and 2) that robust activity patterns for shared tasks were elicited within individual subjects across four independent scanning sessions spanning 12 months.
Figure 6. Reliability of Distances. Reliability matrix of between-subject correlations of distances for study 1 (A) and study 2 (B) for all 17 subjects. The diagonal includes a correlation of 1 (each subject correlated with themselves) while the off-diagonal
1 2 3 4 5 6 7 8 9 10 11 12 13 14 15 16 17 1 2 3 4 5 6 7 8 9 10 11 12 13 14 15 16 17 0 0.1 0.2 0.3 0.4 0.5 0.6 0.7 0.8 0.9 1
1 2 3 4 5 6 7 8 9 10 11 12 13 14 15 16 17 1 2 3 4 5 6 7 8 9 10 11 12 13 14 15 16 17 0 0.1 0.2 0.3 0.4 0.5 0.6 0.7 0.8 0.9 1
A.
B.
1 2 3 4 5 6 7 8 9 10 11 12 13 14 15 16 17
Overall, by leveraging insights from multivariate methods, namely representational similarity analysis, we were able to show that our chosen task battery was successful in exploring a heterogeneous subspace of the cerebellum. This is good news, as the success of determining latent features describing task-evoked activations is dependent on the far-reaching exploration of a rich functional subspace.
3.4 Comprehensive Map of Functional Organisation
The aim of this study was to explore the entire breadth of cerebellar functional activations in order to provide a comprehensive map of functional organisation within this structure. Unlike previous studies which have used restricted task-sets to investigate functional topography (e.g. Stoodley et al. 2012), our rich and comprehensive task-set (61 task conditions) allowed us to characterise the functional organisation of the cerebellum in terms of latent bottom-up features. By employing an extensive task battery spanning multiple cognitive, motor, and affective domains, we were able to leverage the known functional heterogeneity of this structure and simultaneously activate all functional subdivisions within the same set of subjects.
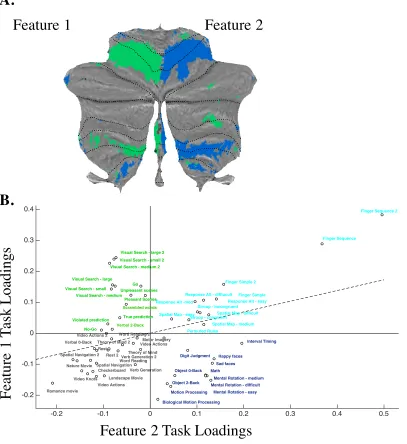
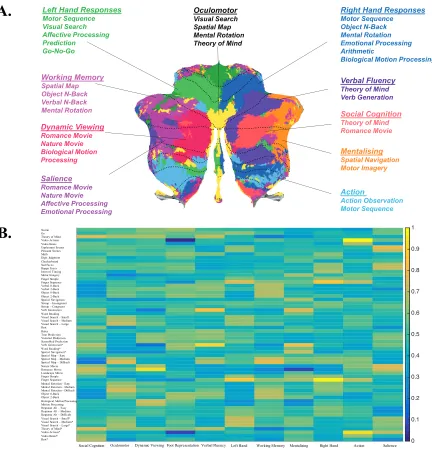
Independent component analysis (ICA) yielded 11 dominant features that largely accounted for the variance of cerebellar activity patterns. A “winner-take-all” approach was then used to assign each cerebellar voxel to the features that had the most similar profile of functional activation, producing a map that revealed a structured, bottom-up organisation of the cerebellum (Figure 8A). Of the 11 features, three were spatially aligned with regions of the cerebellum that typically activate in response to classical motor features; these were left hand presses, right hand presses, and saccadic eye movements. Specifically, two of the three features were localised to the left and right “hand knob” regions of the anterior and posterior cerebellum (Figure 7A) while the third feature was localised to the oculomotor vermis. Tasks that elicited a large number of saccadic eye movements (i.e. visual search, spatial map, theory of mind, and mental rotation) loaded most strongly onto the feature in the oculomotor vermis, while tasks that had been assigned to the left and right hands were most strongly weighted by the left and right lateralised features that were spatially localised to lobules V, VI, and VIIIb (Figure 7B).
Beyond these motor features, there appeared to be medial-to-lateral subdivisions, most dominant in Crus I and II and lobule VIIb, regions that are typically associated with higher-level cognitive functions. A task loading matrix (Figure 8B) characterises the loadings of each task condition onto the 11 features. Working memory tasks (i.e. verbal and object N-Back, spatial map) loaded most strongly onto the left lateralised feature in hemispheric Crus I and II; dynamic viewing tasks (i.e. romance, landscape, nature movie tasks and the biological motion processing task) were strongly weighted by the left lateralised feature in medial Crus I and II; word-dominant tasks (i.e. theory-of-mind, verb generation) loaded most strongly onto the right lateralised feature in medial-to-lateral Crus I and lobule VIIb and medial Crus II; social cognitive tasks (i.e. theory-of-mind, romance movie) were heavily weighted by the right lateralised feature in medial-to-lateral Crus I and II; mentalising tasks (i.e. spatial navigation, motor imagery) were strongly weighted by the right lateralised feature in hemispheric Crus I and II and lobule VIIb and action tasks (i.e. action observation, motor sequence) loaded strongly onto a distributed set of
Figure 7. (A) Task loadings onto motor features, derived using a bottom-approach. Features 1 and 2 were localised to the left and right motor regions of the cerebellum. Dashed lines represent lobular boundaries (I-X). (B) Tasks assigned to the left hand (green) loaded onto feature 1, tasks assigned to the right hand (blue) loaded onto feature 2, bimanual tasks (cyan) loaded strongly on both features while non-response dependent tasks (black) did not load strongly onto either feature 1 or 2.
-0.2 -0.1 0 0.1 0.2 0.3 0.4 0.5
-0.2 -0.1 0 0.1 0.2 0.3 0.4 No-Go Go
Theory of Mind Video Actions Video Actions Unpleasant scenes Pleasant Scenes Math Digit Judgment Checkerboard Sad faces Happy faces Interval Timing Motor Imagery Finger Simple Finger Sequence Verbal 0-Back Verbal 2-Back Object 2-Back Spatial Navigation
Stroop - incongruent
Stroop - congruent
Verb Generation Word Reading Visual Search - small
Visual Search - medium Visual Search - large
Rest 2
Permuted Rules
True prediction Violated prediction
Scrambled words
Verb Generation 2 Word Reading 2
Spatial Navigation 2
Spatial Map - easy
Spatial Map - medium Spatial Map - difficult
Nature Movie
Romance movie
Landscape Movie
Finger Simple 2
Finger Sequence 2
Mental Rotation - easy Mental Rotation - medium Mental Rotation - difficult Object 0-Back
Motion Processing
Biological Motion Processing
Response Alt - easy Response Alt -med
Response Alt - diffiucult
Visual Search - small 2 Visual Search - medium 2
Visual Search - large 2
Theory of Mind 2 Video Actions 2
Video Knots Rest
Feature 2 Task Loadings
F
ea
tur
e
1
T
as
k
L
oa
di
ngs
B.
Feature 1
Feature 2
Figure 8. Comprehensive Map of Functional Organisation (A) and Task Loading Matrix (B). A bottom-up approach (using ICA) identified 11 features that characterised cerebellar
organisation in a maximally independent fashion (A). A “winner-take-all” approach was used to assign different parts of the cerebellum to specific features. The features were tentatively semantically labelled based on their task-activity profiles (see B). Task conditions that strongly loaded onto these features are listed below each semantic label and are coloured in brighter colours in the task loading matrix. Dashed black lines represent lobular boundaries (I-X).
0 0.1 0.2 0.3 0.4 0.5 0.6 0.7 0.8 0.9 1 No-Go Go Theory of Mind Video Actions Video Knots Unpleasant Scenes Pleasant Scenes Math Digit Judgment Checkerboard Sad Faces Happy Faces Interval Timing Motor Imagery Finger Simple Finger Sequence Verbal 0-Back Verbal 2-Back Object 0-Back Object 2-Back Spatial Navigation Stroop – Incongruent Stroop – Congruent Verb Generation Word Reading Visual Search – Small Visual Search – Medium Visual Search – Large Rest Rules True Prediction Violated Prediction Scrambled Prediction Verb Generation* Word Reading* Spatial Navigation* Spatial Map – Easy Spatial Map – Medium Spatial Map – Difficult Nature Movie Romance Movie Landscape Movie Finger Simple Finger Sequence Mental Rotation – Easy Mental Rotation – Medium Mental Rotation – Difficult Object 0-Back Object 2-Back Biological Motion Processing Motion Processing Response Alt – Easy Response Alt – Medium Response Alt – Difficult Visual Search – Small* Visual Search – Medium* Visual Search – Large* Theory of Mind* Video Actions* Video Knots* Rest*
Social Cognition Oculomotor Dynamic Viewing Foot Representation Verbal Fluency Left Hand Working Memory Mentalising Right Hand Action Salience Verbal Fluency
Theory of Mind Verb Generation
Left Hand Responses
Motor Sequence Visual Search Affective Processing Prediction Go-No-Go
Right Hand Responses Motor Sequence Object N-Back Mental Rotation Emotional Processing Arithmetic
Biological Motion Processing
Working Memory Spatial Map Object N-Back Verbal N-Back
Mental Rotation Social Cognition
Theory of Mind Romance Movie
Oculomotor
Visual Search Spatial Map Mental Rotation Theory of Mind