© 2018 IJSRCSEIT | Volume 3 | Issue 3 | ISSN : 2456-3307
Cancer Gene Detection Using Neuro Fuzzy Classification
Algorithm
S . Parvathavardhini, Dr .S . Manju
Department of Computer Science, Sri Ramakrishna college of arts and science for women, Coimbatore, Tamil Nadu, India
ABSTRACT
Clustering has been used extensively as a vital tool of data mining. A Neuro-Fuzzy method is proposed in this research for analyzing the gene expression data from microarray experiments. Analysis of gene expression data leads to cancer identification and classification, which will facilitate proper treatment selection and drug development. The proposed approach was tested on three benchmark cancer gene expression data sets. Experimental results show that our Neuro-Fuzzy method can be used as an efficient computational tool for microarray data analysis. The Neuro-Fuzzy classification system, which is based on a built clustering algorithm reached recognition rates than other classifiers. Gene expression data sets for liver cancer were analyzed in this research. A training and test data set for each cancer was used to analyze the quality of the genes. The researchers with a better understanding of the data.
I.
INTRODUCTION
Advanced technologies have enabled us to collect large amounts of data on a continuous or periodic basis in many fields. The data present the potential for us to discover useful information and knowledge that we could not see before. On the other hand, it is restricted in our ability to manually process large amounts of data to discover useful information and knowledge. This limitation demands automatic tools for data mining to mine useful information and knowledge from large amounts of data. Data mining has become an active area of research and development. Necessary materials for data mining are presented and organized coherently in one volume. This enables one to quickly start and conduct research work or practical applications of data mining without spending precious time searching for those materials from many different sources. Data mining an vast area in computer science, is the computational flow of identifying patterns in large data sets which holds methods at
the centre point of artificial intelligence, statistics, and database systems.The vital aim of the data mining is to explore information from a data set and transform it into an meaningful structure for research in future.
training phase, where a classification algorithm constructs the classifier by learning from a training data set and their associated class label attributes. In the next step the model is used for classification. In order to estimate the performance of the classifier a test set independent of the training tuples is used. Several preprocessing steps such as data cleaning, data selection and data transformation are also applied to the data set before the classification procedure takes place.
Feature selection is an important topic in data mining, especially for high dimensional datasets. Feature selection (also known as subset selection) is a process commonly used in machine learning, wherein subsets of the features available from the data are selected for application of a learning algorithm. The best subset contains the least number of dimensions that most contribute to accuracy; we discard the remaining, unimportant dimensions. This is an important stage of preprocessing and is one of two ways of avoiding the curse of dimensionality (the other is feature extraction). There are two approaches in Feature selection known as Forward selection and backward selection. Feature selection has been an active research area in pattern recognition, statistics, and data mining communities. The main idea of feature selection is to choose a subset of input variables by eliminating features with little or no predictive information. Feature selection methods can be decomposed into three broad classes.
High dimensional data is popularly common in many research areas[1]. When the number of dimensions increased, many clustering methods start to suffer from the trial of dimensionality, humiliating the excellence of the results. In high dimensions, data becomes very thin and distance measures become meaningless. This problem has been experimented extensively and there are different solutions, each suitable for various methods of high dimensional data and data mining procedures. Subspace clustering tries
to feature estimation and clustering in order to detect clusters in various subspaces
The Neuro-Fuzzy classification system, which is based on a built clustering algorithm reached recognition rates than other classifiers. Our experiment results recommend that Neuro-Fuzzy classification algorithms have the capability a lot to progress common classification systems that can be used in ultrasonic tissue characterization.
The objective of feature selection for unsupervised learning is to find the smallest feature subset that best uncovers clusters form data according to the preferred criterion. Feature selection in unsupervised learning is much harder problem, due to the absence of class labels. Feature selection for clustering is the task of selecting significant features for the underlying clusters. Feature selection for unsupervised learning can be subdivided into filter methods and rapper methods.
The aim of our work was to investigate the performance of different Neuro-Fuzzy classification methods for the distinction of benign and malign tissue in ultrasound prostate diagnosis. This study was done on segments with confirmed histology in small regions of interest within the area and it continuing to gather lymphoma data in order to result a data base of benign and malign tissue in genes. Our results suggest that Neuro-Fuzzy classification algorithms have the potential to significantly improve common classification methods for the use in ultrasonic tissue characterization.
II.
REVIEW
number of data points. However, there has been much less work on methods of efficiently clustering datasets that are large in all three ways at once for example, having millions of data points that exist in many thousands of dimensions representing many thousands of clusters.
3.1 UNSUPERVISED CLUSTERING
Unsupervised clustering techniques have been applied to many important problems. By clustering patient records, health care trends are discovered. By clustering address lists, duplicate entries are eliminated[2]. By clustering astronomical data, new classes of stars are identified. By clustering documents, hierarchical organizations of information are derived. To address these applications, and many
others, a variety of clustering algorithms have been developed[3]. However, traditional clustering algorithms become computationally expensive when the data set to be clustered is large. There are three different ways in which the data set can be large: (1) there can be a large number of elements in the data set, (2) each element can have many features, and (3) there can be many clusters to discover.
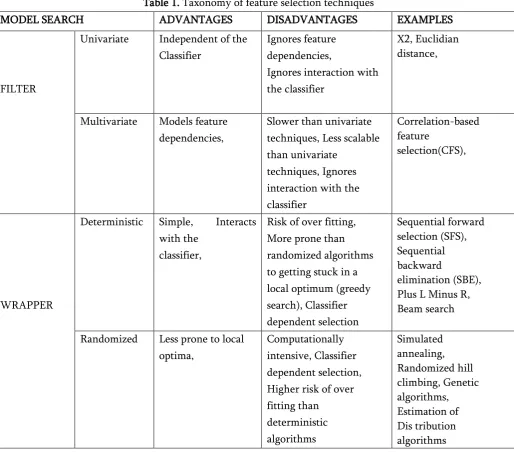
Taxonomy of feature selection techniques is shown in the following table. For each feature selection type, we highlight a set of characteristics which can guide the choice for a technique suited to the goals and resources of practitioners in the field as shown in table 1
Table 1. Taxonomy of feature selection techniques
MODEL SEARCH ADVANTAGES DISADVANTAGES EXAMPLES
FILTER
Univariate Independent of the Classifier
Deterministic Simple, Interacts with the
3.2 FEATURE SUBSET SELECTION ALGORITHM Irrelevant features, along with redundant features, severely affect the accuracy of the learning machines Thus, feature subset [4] selection should be able to identify and remove as much of the irrelevant and redundant information as possible. Moreover, “good feature subsets contain features highly correlated with (predictive of) the class, yet uncorrelated with (not predictive of) each other.” [30] Keeping these in mind, we develop a novel algorithm which can efficiently and effectively deal with both irrelevant and redundant features, and obtain a good feature subset[5].
We achieve this through a new feature selection framework which composed of the two connected components of irrelevant feature removal and redundant feature lamination. The former obtains features relevant to the target concept by eliminating irrelevant ones, and the latter removes redundant features from relevant ones via choosing representatives from different feature clusters, and thus produces the final subset.
In the presented novel clustering-based feature subset selection algorithm for high dimensional data. The algorithm involves as follows 1) removing irrelevant features, 2) constructing a minimum spanning tree from relative ones, and 3) partitioning the MST and selecting preventative features.
3.3 NAIVE BAYS CLASSIFICATION
Naive Bays methods are a set of supervised learning algorithms based on applying Bayes’ theorem with the “naive” assumption of independence between every pair of features. Given a class variable and a dependent feature vector through , Bays’ theorem states the following relationship, And we can use Maximum A Posteriori (MAP) estimation to estimate and ; the former is then the relative frequency of class y in the training set. The different naive Bays classifiers differ mainly by the assumptions they make regarding the distribution of
. In spite of their apparently over-simplified assumptions, naive Bayes classifiers have worked quite well in many real-world situations, famously document classification and spam filtering. They require a small amount of training data to estimate the necessary parameters. (For theoretical reasons why naive Bayes works well, and on which types of data it does, see the references below.) Naive Bays learners and classifiers can be extremely fast compared to more sophisticated methods.
The naive Bayes classifier is a generative model wherein we make the oversimplifying assumption that our inputs are independent given the label. The processing speed reduced greatly in the case that the data set is so large that can not fit in the memory .At present, the literature about the improvement on the efficiency of decision tree classification algorithm For example, Wei Zhao, Jamming Su in the literature [6] .
Proposed improvements to the ID3 algorithm, which is simplify the information gain in the use of Taylor's formula. But this improvement is more suitable for a small amount of data, so it's not particularly effective in large data sets[7]. Due to dealing with large amount of datasets; a variety of decision tree classification algorithm has been considered. The advantages of C4.5 algorithm is significantly, so it can be choose. But its efficiency must be improved to meet the dramatic increase in the demand for large amount of data.
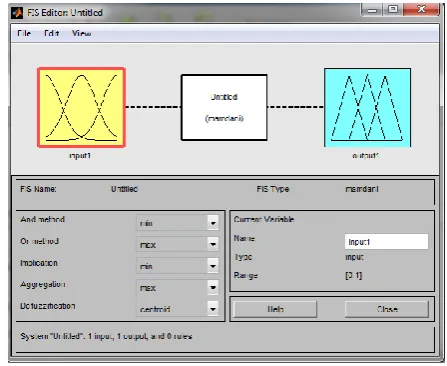
3.4 Neuro fuzzy classification
A Neuro-Fuzzy method is proposed in this paper for analyzing the gene expression data from microarray experiments. The proposed approach was tested on three benchmark cancer gene expression data sets. Experimental results show that our Neuro-Fuzzy method can be used as an efficient computational tool for microarray data analysis. In addition, compared to some current most widely used approaches, Neuro-Fuzzy method based models not only supply good classification results, but their behavior can also be explained and interpreted in human understandable terms, which provides the researchers with a better understanding of the data.
Unfortunately, Neuro-Fuzzy method methods have suffered some well-known limitations in dealing with high dimensional data. Although some fuzzy-rule-based applications for microarray analysis have already been presented [8] [9], all these reported systems are small models and only perform well on simple data sets. Because large rule-based models imply huge computational cost, they sometimes are unacceptable in practice. In order to improve the inherent weakness of other models, a Neuro-Fuzzy method is developed in this thesis. The proposed Neuro-Fuzzy method is tested on three benchmark microarray cancer data sets, including lymphoma cancer data set.
Compared to some other benchmark problems in machine learning, microarray data sets may be problematic. The number of features (genes), usually in the range of 2,000-30,000, is much larger than the number of samples (usually in the range of 40-200). But not all of these genes are needed for classification. Most genes do not influence the performance of the classification task. Taking such genes into account during classification increases the dimension of the classification problem, poses computational difficulties and introduces unnecessary noise in the process. A major goal for diagnostic research is to develop diagnostic procedures based on inexpensive
microarrays that have enough probes to detect certain diseases. This requires the selection of some genes which are highly related to the particular classification problem, i.e., the informative genes. This process is called gene selection, or feature selection in machine learning in general. Most widely used gene selection method, Information Gain (IG), is adopted for the purpose of this work.
Intuitively, a class is a set that is defined by a certain property, and all objects having that property are elements of that class. The process of classification evaluates for a given set of objects whether they fulfill the classification property, and consequentially are a member of the corresponding class. However, this intuitive concept has some logical subtleties that need clarification.
A class logic (Glubrecht, Oberschelp, &Todt, 1983) is a logical system which supports set construction using logical predicates with the class operator { .| .}. A class C = { i | Π(i) } is defined as a set C of individuals i satisfying a classification predicate Π which is a propositional function. The domain of the class operator { .| .} is the set of variables V and the set of propositional functions PF, and the range is the power set of this universe P(U) that is, the set of possible subsets:
{ .| .} ∶V×PF⟶P(U)
Here is an explanation of the logical elements that constitute this definition:
An individual is a real object of reference.
A universe of discourse is the set of all possible individuals considered.
A variable V:⟶R is a function which maps into a predefined range R without any given function arguments: a zero-place function. A propositional function is “an expression
assigned to these constituents, the expression becomes a proposition” (Russell, 1919, S. 155).
In contrast, classification is the process of grouping individuals having the same characteristics into a set. A classification corresponds to a membership function μ that indicates whether an individual is a member of a class, given its classification predicate Π.
μ∶PF × U ⟶ T
The membership function maps from the set of propositional functions PF and the universe of discourse U into the set of truth values T. The membership μ of individual i in Class C is defined by the truth value τ of the classification predicate Π.
μC(i):=τ(Π(i))
In classical logic the truth values are certain. Therefore a classification is crisp, since the truth values are either exactly true or exactly false.
The fuzzy robust principal component analysis algorithm used here and from where the nonlinear case is derived were introduced . The robust principal component algorithms which Yang & Wang proposed in are basically based on Xu&Yuilles algorithms [10], [11]. where PCA learning rules are related to energy functions and they proposed an objective function with the con-side ration of outliers. In Yang & Wang's proposed methods the objective function was extended be fuzzy and they includes Xu&Yuilles algorithms as a crisp special cases. Next these methods are briefly presented. A more thorough description can be found in and
The emergence of various new application domains, such as bioinformatics and e-commerce, underscores the need for analyzing high dimensional data. In a gene expression microarray data set, there could be tens or hundreds of dimensions, each of which corresponds to an experimental condition. In a customer purchase behavior data set, there may be up to hundreds of thousands of merchandizes, each of which is mapped to a dimension. Researchers and practitioners are very eager in analyzing these data sets.
Various data mining models have been proven to be very successful for analyzing very large data sets. Among them, frequent patterns, clusters, and classifiers are three widely studied models to represent, analyze, and summarize large data sets. In this chapter, we focus on the state-of-art techniques for constructing these three data mining models on massive high dimensional data sets.
dimensional data, many dimensions are irrelevant and can mask existing clusters in noisy data. Feature selection removes irrelevant and redundant dimensions by analyzing the entire dataset. Subspace clustering algorithms localize the search for relevant dimensions allowing them to find clusters that exist in multiple, possibly overlapping subspaces. There are two major branches of subspace clustering based on their search strategy. Top-down algorithms find an initial clustering in the full set of dimensions and evaluate the subspaces of each cluster, iteratively improving the results. Bottom-up approaches find dense regions in low dimensional spaces and combine them to form clusters. This research presents a survey of the various subspace clustering algorithms along with a hierarchy organizing the algorithms by their defining characteristics. We then compare the two main approaches to subspace clustering using empirical scalability and accuracy tests and discuss some potential applications.
Figure 1. Neuro Fuzzy classification
Recent researches have shown that a small number of genes is sufficient for accurate diagnosis of most cancers, even though the number of genes vary greatly between different diseases. Indeed, a large set of gene expression features will not only significantly bring higher computational cost and slow down the learning process, but also decrease the classification accuracy due to the phenomenon known as curse of dimensionality, in which the risk of over-fitting increases as the number of selected genes grows.
More importantly, by using a small subset of genes, we can not only get a better diagnostic accuracy, but also get an opportunity to further analyse the nature of the disease and the genetic mechanisms responsible for it. Therefore, the microarray cancer classification problem can be classified as a combinational optimization problem with two main objectives: minimizing the number of selected genes and maximizing the classification accuracy.
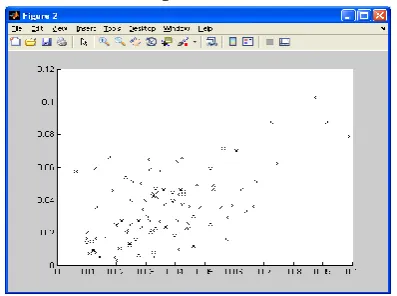
3.5CLASSIFICATION OF CANCER
DNA microarrays are an exciting new technology with the potential to increase our understanding of complex cellular mechanisms. Microarray datasets[12][13] provide information on the expression levels of thousands of genes under hundreds of conditions. For example, we can interpret a lymphoma dataset as 100 cancer profiles with 4000 features where each feature is the expression level of a specific gene. This view allows us to uncover various cancer subtypes based upon relationships between gene expression profiles. In addition, individual gene products have many different roles under different circumstances.
Techniques for clustering high dimensional data have included both feature transformation and feature selection techniques. Feature transformation techniques attempt to describe a dataset in minimum dimensions by creating mixture of the exact attributes. These methods are very helpful in uncovering latent structure in datasets.
Realizing the differences between cancer subtypes on a genetic level is vital to understanding which types of treatments are most preferable to be effective.
Figure 2. Cancer data classification
3.6 Lymphoma Dataset
The lymphoma cDNA array dataset comprises gene expression patterns of genes involved in different classes of lymphoma and normal cell lines from Alizadeh et al [14].The mechanism of cancer is characterized by uncontrolled growth and proliferation brought about by mutations to vital genes. Cancer diagnosis has traditionally been carried out based on clinical and molecular evidence such as cell and tissue type, and heredity. However, such information is mostly incomplete for evaluation or prognosis. It also leads to revalidation or re-classification in some cases of cancer. The microarray dataset consists of expression values from 4026 genes involved in 96 subpopulations. Each data point Xij represents the logarithm of the Cy5/Cy3 fluorescence ratio for gene j in tissue sample i.
Figure 3. Lymphoma Tissue types
III.
DISCUSSION
In general the Bayes classifier and the KNN[3] classifier could not handle the massive data as good as the Neuro-Fuzzy classification systems. This helps our earlier analysis using artificial neural networks. This effect was not experimented with the lymphoma data which can be contributed to the different statistical properties of the two data sets. With the lymphoma data all system had problems to find the similar four outliers which limited the achievable recognition rate to 95.85 %. This well-maintained a smooth relationship between sensitivity, specificity and produced maximum recognition rates. We adopt three important criteria for empirical evaluation of the performance of our models:
Number of selected genes,
Predictive accuracy on selected genes,
Extracted knowledge from the trained models.
Figure 4. Classification Error Comparison for Cancerous/Non-cancerous Cells
The Cluster analysis itself is not one specific, but the general task to be solved. It can be achieved by various algorithms such as KNN, SVM and Neuro fuzzy classification algorithm that differ significantly in their notion of what constitutes a cluster and how to efficiently find them. Clustering can therefore be formulated as a multi objective optimization problem.
0 2 4 6 8 10
Avg error rate
Figure 5. Comparison of time period
Figure 6. Comparison of Neuro-Fuzzy, SVM, KNN based on speed, error rate and accuracy
The Figure 6 shows the comparison results of Neuro-Fuzzy, SVM, KNN based on speed, accuracy and error rate. From this it is clear that the proposed Neuro fuzzy classification algorithms have low error rate and performs better than Existing SVM and KNN classifiers in terms of speed and accuracy.
The Neuro-Fuzzy classification system, which is based on a built clustering algorithm reached recognition rates above in comparison to the SVM and KNN classifier. Our experiment results recommend that Neuro-Fuzzy classification algorithms have the capability a lot to progress common classification systems that can be used in ultrasonic tissue characterization.
IV.
CONCLUSION
High dimensional data is popularly common in many research areas. When the number of dimensions increased, many clustering methods start to suffer from the trial of dimensionality, humiliating the
excellence of the results. In high dimensions, data becomes very thin and distance measures become meaningless. This problem has been experimented extensively and there are different solutions, each suitable for various methods of high dimensional data and data mining procedures. Subspace clustering tries to mis-feature estimation and clustering in order to detect clusters in various subspaces. The Neuro-Fuzzy classification system, which is based on a built clustering algorithm reached recognition rates above in comparison to the SVM and KNN classifier. Our experiment results recommend that Neuro-Fuzzy classification algorithms have the capability a lot to progress common classification systems that can be used in ultrasonic tissue characterization.
V.
REFERENCES
[1]. F.N.Afrati,A.Gionis,and
H.Mannila.Approximating a collection of frequent sets.In Proc.2004 ACM SIGKDD Int.Conf.Knowledge Discovery in Databases (KDD’04),pages 12-19,Seattle,WA,Aug.2004. [2]. Manju.S,M.Punithavalli,"An Analysis of
Q-Learning Algorithms with Strategies of Reward Function,International Journal on Computer Science and Engineering",ISSN : 0975-3397 Vol.3 No.2 Feb 2011.
[3]. Manju.S ,M.Punithavalli,"Neural network-based ideation learning for intelligent agents:
e-brainstorming with privacy
preferences",International Journal of
Computational Vision and
Robotics,Vol.5,No.3,2015.
[4]. C.H.Q.Ding and H.Peng,"Minimum redundancy feature selection from microarray gene expression data." in CSB,2003,pp.523-529.15] M.Xiong,W.Li,J.Zhao,L.Jin,and E.Boer winkle,"Feature (gene)selection in gene expression-based tumor classification," Molecular Genetics and Metabolism,pp.239-247,2001.
[5]. H.Ressom,R.Reynolds,and
R.S.Varghese,"Increasing the efficiency of 0
1 2 3 4
Time
Time
0 2 4 6 8
Speed
Error rate
fuzzy logic-based gene expression data analysis," Physiol.Genomics,vol.13,pp.107-117,2003.
[6]. J.Biesiada and W.Duch,"Features Election for High-Dimensional data a Pearson Redundancy Based Filter," Advances in Soft Computing,vol.45,pp.242-249,2008.
[7]. Agrawal ,J.Gehrke,D.Gunopulos,and P.Raghavan.Automatic subspace clustering of high dimensional data for data mining applications.In Proc.1998 ACM-SIGMOD
Int.Conf.Management of Data
(SIGMOD’98),pages 94-105,Seattle,WA,June 1998.
[8]. X.-R.Jiang and L.Gruenwald,"Microarray gene expression data association rules mining based on bsc-tree and fis-tree," Data Knowl.Eng.,vol.53,no.1,pp.3-29,2005.
[9]. H.Ressom,R.Reynolds,and
R.S.Varghese,"Increasing the efficiency of fuzzy logic-based gene expression data analysis," Physiol.Genomics,vol.13,pp.107-117,2003.
[10]. S.Y.Belal,A.Taktak,A.Nevill,S.Spencer,D.Roden ,and S.Bevan,"Automatic detection of distorted plethysmogram pulses in neonates and paediatric patients using an adaptive-network-based fuzzy inference system," Artificial Intelligence in Medicine,no.24,pp.149-165,2002.
[11]. B.Gabrys,"Combining neuro-fuzzy classifiers for improved generalization and reliability," in Proceedings of the Int.Joint Conference on
Neural Networks
(IJCNN’2002),Honolulu,USA,2002,pp.2410-2415.
[12]. S.Cho and H.Won,"Machine learning in dna microarray analysis for cancer classification," in APBC,vol.34,2003,pp.189-198
[13]. U.Fayyad and K.Irani,"Multi-Interval Discretization of Continuous-Valued Attributes for Classification Learning," Proc.13thInt’l
Joint Conf.Artificial Intelligence,pp.1022-1027,1993.