International Journal of Scientific Research in Computer Science, Engineering and Information Technology
© 2018 IJSRCSEIT | Volume 3 | Issue 3 | ISSN : 2456-3307
Anger Detection from Emotional Body Movements
V. Abinaya1, Dr. M. Kalaiselvi Geetha2, R. Santhoshkumar 31Department of CSE, Annamalai University, Tamil Nadu, Chidambaram, India
2Associate Professor, Department of CSE, Annamalai University, Tamil Nadu, Chidambaram, India 3PhD Scholar, Department of CSE, Annamalai University, Tamil Nadu, Chidambaram, India
ABSTRACT
Recognizing emotions from human full body activity is attracting the researchers in recent days due to its potential applications. Detecting the suspicious activity and thereby preventing any terrorism focuses on emotion recognition. This work aims to detect emotions from actions particularly distinguishing anger from other emotions in video. In this work, the feature is extracted using BLOB feature extraction[16].The BLOB features include area, shape and luminance are defined. Then the extracted feature is fed through K-Nearest Neighbours (KNN) classifier to get the accuracy percentage of recognized emotion.
Keywords: Emotion Recognition, suspicious activity, anger detection, BLOB , K-Nearest Neighbours (KNN).
I.
INTRODUCTION
Expressions are expressed through various modalities. Our body also expresses emotional information and less studies are seen in this topic. Emotion recognition from body movements can be used in various application areas. The importance of emotion recognization is to avoid or protect the public or a person before something goes wrong. The emotions of the humans can be detected through their activities. Various emotions like happy, anger, sad, fear etc., may be identified from human activity. The aim of this work is to distinguish anger and non-anger emotions from human activities. In current scenario, it is vital to monitor the public areas. Monitoring includes protecting the public from any suspicious activity. Suspicious activity detection can be done by identifying the human emotions through videos. In this work, area, shape, luminance are used as BLOB feature extraction [16]. Then the extracted feature is fed into KNN classifier to get the accuracy percentage of emotion recognized.
A. Outline of the work
This paper deals with human emotion (anger or non-anger) recognition, which aims to identify emotion from the video sequences. The proposed approach is evaluated using GEMEP dataset. The videos are converted into frames. Thus, the features are extracted using BLOB feature extraction. The extracted features are modeled by KNN classifiers for training and testing.
The rest of the paper is structured as follows. Section 2 gives discussion about related works. Section 3 provides an overview of the proposed system. Section 4 describes experimental results. Finally, Section 5 Gives the contributions made by this current work and concludes with directions for future research based on my results.
II.
LITERATURE SURVEY
theory. Konrad Schindlera et al. [2] approaches recognition of basic emotional categories from a computational perspective. They construct a biologically plausible hierarchy of neural detectors, which can discriminate seven basic emotional states from static views of associated body poses. Castellano et al. [3] presented an approach for the recognition of acted emotional states based on the analysis of body movement and gesture expressivity. According to research showing that distinct emotions are often associated with different qualities of body movement, we use non- propositional movement qualities to infer emotions, rather than trying to recognise different gesture shapes expressing specific emotions.
Radoslaw Niewiadomski et al. [4] recognized that laughter from the human full-body movement in social and ecological contexts. A vision-based system prototype for automated laughter detection from human full-body movement was designed and evaluated. Jing Zhu et al. [5] concluded that the concept of emotion deserves a more distinctive and central place in philosophical theories of action. Nesrine Fourati et al. [6] conveyed they present the Random Forest based feature selection approach for the identification of relevant expressive body cues in the context of emotional body expression classification and also discuss the ranking of relevant body cues according to each expressed emotion across a set of daily actions.Neha Shirbhate et al. [7] They are proposing a system that uses semantic rules to define emotional activities. We have opted for semantics-based approach instead of machine learning enables us to detect the actions without requiring to train the system. This also makes the system better performance-wise; and enables action detection in real time. Bruce D. Keefe et al. [8] presented a database of high-definition videos for the study of traits inferred from whole-body actions. The database they can be used are useful database of stimuli of multiple actions conveying multiple traits to investigate the contribution of static and dynamic body postures to the perception of body actions. They
discuss potential uses for the database in the analysis of the perception of whole-body actions.
Haris Zacharatos et al. [9] outlines the findings relating to the area of body emotion recognition by describing emerging techniques and modalities as well as recent advances on the challenging task of automatic emotion recognition. Important aspects are analyzed, application areas and notation systems are described and the importance for movement segmentation is discussed. The survey concludes with a detailed discussion on unsolved problems in the area and provides promising directions for future work. J. Arunnehru et al. [10] proposed an Automatic human emotion Recogniton in surveillance video based on gesture dynamic’s features and the features are evaluated by svm , Naïve Bayes and dynamic time wrapping. M. KalaiselviGeetha et al. [11] developed a video retrievel applications for video classification and shot detection using Block intensity comparison code (BICC) and unsuperized shot detection. A Noval AANN misclusting Rate(AMR) algorithm is used to detect the shot transitions. J. Arunnehru et al. [12] assigns motion intensity code for action recognition in surveillance video using Region Of Interest (ROI) from the difference image. J. ArunNehru et al. [13] proposed an applications for Action Recognition in automated surveillance. The 18 dimensional Block intensity vector are extracted and evaluated through SVM. Michael Garber-Barron et al. [14] explored the use of features that represent body posture and movement for automatically detecting people’s emotions in non-acted standing scenarios. We focused on four emotions that are often observed when people are playing videogames: triumph, frustration, defeat and concentration.
including simultaneous superposed or masked emotions. This method consists of two main steps: the training step and the detection step. In the First step, our algorithm extracts the features of emotion from the data to generate an emotion training data base. Then in the second step, we apply the k-nearest-neighbor classifier to assign the predefined classes to instances in the test set. The final result is defined as an eight components vector representing emotion in multidimensional space. Experiments show the efficiency of the proposed method in detecting basic emotion by giving hight recognition rate. Jie Yang et.al.,[16] presented a novel approach for human activities recognition in the video. We analyze human activities in the sequential frames because human activities can be considered as a temporal object which contains a series of frames. Firstly, we establish a statistical background model and extract foreground object through background subtraction in the video stream. Then, we use foreground blobs of the current frame and a series of frames before the current frame to form a new feature image in certain rules. Finally, we combine the non-zero pixels in the feature image into blobs using the connected component method. Then each blob corresponds to an activity which is characterized by the blob appearance. By recognizing blob features we can recognize activities. We use Gaussian Mixture to model features for each type of human activities and employ distance to measure the similarity.
III. PROPOSED SYSTEM
A. Block diagram
Figure 1.Proposed work.
Figure 1. shows that the steps involved in this proposed approach, First step in the proposed system is preprocessing, Secondly the feature is extracted and finally, the extracted feature is send through Classifier.
B. Preprocessing
Pre-processing is a common name for operations with images at the lowest level of abstraction -- both input and output are intensity images. The goal of pre-processing is making to suppresses unwanted distortions or enhances some image features important for next processing stage.
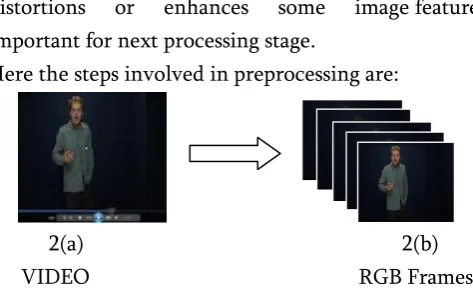
Here the steps involved in preprocessing are:
2(a) 2(b)
VIDEO RGB Frames Figure 2. Converting videos into RGB frames.
Here 2(a) shows the video and 2(b) shows the RGB frames, figure 2 shows the conversion of videos into RGB frames.
3(a) 3(b)
RGB Frames GRAY Frames Figure3. Converting RGB frames into gray frames.
Here 3(a) shows the RGB frames and 3(b) shows the GRAY frames, figure 3 shows the conversion of RGB frames into GRAY frames.
-
4(a) 4(b)
GRAY Frames Bounding box
Here 4(a) shows the GRAY frame and 4(b) shows the Bounding box frame, figure 4 shows the conversion of GRAY frames into bounding box.
C. Feature Extraction (BLOB)
In computer vision, [16]blob detection methods are aimed at detecting regions in a digital image that differ in properties, such as brightness or color, compared to surrounding regions. Informally, a blob is a region of an image in which some properties are constant or approximately constant; all the points in a blob can be considered in some sense to be similar to each other. The most common method for blob detection is convolution.Given some property of interest expressed as a function of position on the image, there are two main classes of blob detectors: (i) differential methods, which are based on derivatives of the function with respect to position, and
(ii) methods based on local extreme, which are based on finding the local maxima and minima of the function.
With the more recent terminology used in the field, these detectors can also be referred to as interest point operators, or alternatively interest region operators. There are several motivations for studying and developing blob detectors. One main reason is to provide complementary information about regions, which is not obtained from edge detectors or corner detectors. In early work in the area, blob detection was used to obtain regions of interest for further processing. These regions could signal the presence of objects or parts of objects in the image domain with application to object recognition and/or object tracking.
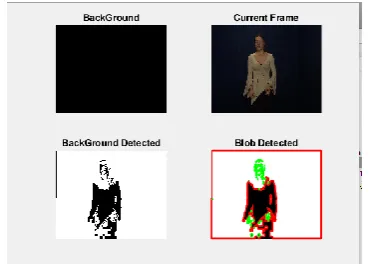
Each activity can cause the changes of a group of neighbouring pixels, and the changed pixels are spatially connected. We combine the non-zero pixels in the feature image into blobs using the connected component analysis.
Then each blob corresponds to a human activity which is characterized by the blob appearance. The blobs capture many features of the activities including speed of the people, shape of the action. In the feature image, each blob can be described by some blob-level features, such as shape, area, statistic of the pixel luminance in the blob. The chosen features involve mean and variance of each blob luminance, the ratio of length and width of the bounding box and 7-hu moments which are known to yield reasonable shape discrimination. We use these features to constitute a feature vector. Among these features, the mean of blob luminance is first order statistic and variance of blob luminance is second order statistic. They capture speed and other motion information of the activity. Low mean of blob luminance reflects high speed of the activity and high mean of blob luminance reflects low speed of the activity[16].
The 7-hu moment captures shape of the action. Each type of activities has its corresponding blob shape. The 7-hu moments are rotation, scaling, displacement invariant and they can describe shape information independent of area, size, and orientation.
Figure 5. BLOB Feature Extraction i) AREA
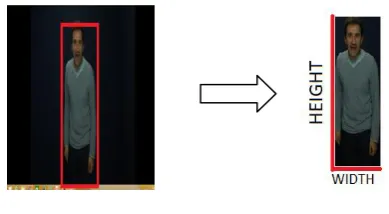
• AREA is calculated using the height and width of the bounding box[16].
Figure 6.measuring height and width
ii) SHAPE
SHAPE is calculated using the 7hu invariant moments. The use of moments as invariant binary shape representations was first proposed by Hu in 1961 . Hu successfully used this technique to classify handwritten characters.
=
…..(2) = +
…..(3)
= +
…..(4)
= +
…..(5)
= [
]
[ ]….(6)
= [
]+
…..(7)
[
]
[ ]
…..(8)
iii) LUMINANCE
Luminance is a photometric measure of the luminous intensity per unit area of light travelling in a given direction. It describes the amount of light that passes through, is emitted or reflected from a particular area, and falls within a given solid angle. The SI unit for luminance is candela per square metre (cd/m2). A non-SI term for the same unit is the nit. The CGS unit of luminance is the stilb, which is equal to one candela per square centimetre or 10
kcd/m2.Luminance is often used to characterize emission or reflection from flat, diffuse surfaces. The luminance indicates how much luminous power will be detected by an eye looking at the surface from a particular angle of view. Luminance is thus an indicator of how bright the surface will appear. In this case, the solid angle of interest is the solid angle subtended by the eye's pupil. Luminance is used in the video industry to characterize the brightness of displays. A typical computer display emits between 50 and 300 cd/m2. The sun has luminance of about 1.6×10⁹ cd/m2 at noon.
Luminance is invariant in geometric optics. This means that for an ideal optical system, the luminance at the output is the same as the input luminance. For real, passive, optical systems, the output luminance is at most equal to the input. As an example, if one uses a lens to form an image that is smaller than the source object, the luminous power is concentrated into a smaller area, meaning that the illuminance is higher at the image. The light at the image plane, however, fills a larger solid angle so the luminance comes out to be the same assuming there is no loss at the lens. The image can never be "brighter" than the source.
The luminance of a specified point of a light source, in a specified direction, is defined by the derivative
∑ …..(9)
where
Lv is the luminance (cd/m2),
d2Φv is the luminous flux (lm) leaving the area
dΣ in any direction contained inside the solid angle dΩΣ,
dΣ is an infinitesimal area (m2) of the source
containing the specified point,
dΩΣ is an infinitesimal solid angle (sr),
θΣ is the angle between the normal nΣ to the
surface dΣ and the specified direction.
the ray crosses an arbitrary surface S, the luminance is given by
…..(10)
where
dS is the infinitesimal area of S seen from the source inside the solid angle dΩΣ,
dΩS is the infinitesimal solid
angle subtended by dΣ as seen from dS,
θS is the angle between the normal nS to
dS and the direction of the light.
More generally, the luminance along a light ray can be defined as
…..(11)
where
dG is the etude of an infinitesimally narrow beam containing the specified ray,
dΦv is the luminous flux carried by this beam,
n is the index of refraction of the medium.
D. KNN classifier:
In pattern recognition, the k-nearest neighbors algorithm (k-NN) is a non-parametric method used for classification and regression. In both cases, the input consists of the k closest training examples in the feature space. The output depends on whether k-NN is used for classification or regression:
In k-NN classification, the output is a class membership. An object is classified by a majority vote of its neighbors, with the object being assigned to the class most common among its k nearest neighbors (k is a positive integer, typically small). If k = 1, then the object is simply assigned to the class of that single nearest neighbor.
In k-NN regression, the output is the property value for the object. This value is the average of the values of its k nearest neighbors.
k-NN is a type of instance-based learning, or lazy learning, where the function is only approximated locally and all computation is deferred until
classification. The k-NN algorithm is among the simplest of all machine learning algorithms.
ALGORITHM
The training examples are vectors in a multidimensional feature space, each with a class label. The training phase of the algorithm consists only of storing the feature vectors and class labels of the training samples.In the classification phase, k is a user-defined constant, and an unlabeled vector (a query or test point) is classified by assigning the label which is most frequent among the k training samples nearest to that query point.
A commonly used distance metric for continuous variables is Euclidean distance. For discrete variables, such as for text classification, another metric can be used, such as the overlap metric (or Hamming distance). In the context of gene expression microarray data, for example, k-NN has also been employed with correlation coefficients such as Pearson and Spearman.[3] Often, the classification accuracy of k-NN can be improved significantly if the distance metric is learned with specialized algorithms such as Large Margin Nearest Neighbor or Neighborhood components analysis.
the original training data. K-NN can then be applied to the SOM.
A confusion matrix or "matching matrix" is often used as a tool to validate the accuracy of k-NN classification. More robust statistical methods such as likelihood-ratio test can also be applied.In KNN, the extracted feature are fed and the output is predicted. The higher accuracy level obtained in KNN classifier is 84.49%.
IV. EXPERINMENTAL RESULTS
In this work, The GEMEP dataset is used. That extracted feature is send through KNN classifier to get the accuracy level. The highest F-measure value obtained by KNN classifier is 84.49%.
A. Dataset
A data set (or dataset, although this spelling is not present in many contemporary dictionaries like Merriam-Webster) is a collection of data. Most commonly a data set corresponds to the contents of a single database table, or a single statistical data matrix, where every column of the table represents a particular variable, and each row corresponds to a given member of the data set in question. The data set lists values for each of the variables, such as height and weight of an object, for each member of the data set. Each value is known as a datum. The data set may comprise data for one or more members, corresponding to the number of rows. The term data set may also be used more loosely, to refer to the data in a collection of closely related tables, corresponding to a particular experiment or event.
B. GEMEP Dataset
The GEneva Multimodal Emotion Portrayals (GEMEP) is a collection of audio and video recordings featuring 10 actors portraying 18 affective states, with different verbal contents and different modes of expression. It was created in Geneva by Klaus Scherer and Tanja Bänziger, in the framework of a project funded by the
Swiss National Science Foundation. Figure 8. shows the example pictures of actors performing various emotions.
PERSON 1
(A)ANGER PERSON 2
PERSON 1
(B)JOY PERSON 2
Figure 7. GEMEP Dataset
C. Confusion matrix
A confusion matrix is a table that is often used to describe the performance of a classification model (or "classifier") on a set of test data for which the true values are known. The confusion matrix itself is relatively simple to understand, but the related terminology can be confusing.
The most basic terms, which are whole numbers (not rates):
True Positives (TP) - These are the correctly predicted positive values which means that the value of actual class is yes and the value of predicted class is also yes.
True Negatives (TN) - These are the correctly predicted negative values which means that the value of actual class is no and value of predicted class is also no.
False Positives (FP) – When actual class is no and predicted class is yes.
False Negatives (FN) – When actual class is yes but predicted class in no.
Table 1. Confusion Matrix
ACTUAL PREDICTED
POSITIVE NEGATIVE
POSITIVE TP FN
NEGATIVE FP TN
The above table represents the confusion matrix, TP,TN,FP,FN are actual and predicted values.
Precision
Precision is the ratio of correctly predicted positive observations to the total predicted positive observations.
In statistical analysis of binary classification, the F-score (also F-F-score or F-measure) is a measure of a test's accuracy.
It considers both the precision and the recall of the test to compute the score.
F-score=2. …….(14)
D. Performance measures
In Table 2. describes various accuracy (Precision, Recall, F-Measure) predicted using different features using KNN classifier are listed.
Table 2. Performance of different features using KNN classifier
Table 3. Various accuracy value for different emotions
*A-Area, S-Shape, L-Luminance
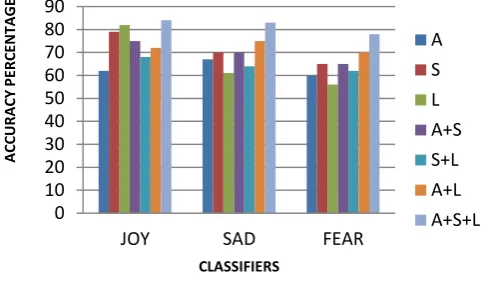
Three different features such as Area, Shape and Luminance values are calculated and all the values are separately classified using SVM, KNN, RF classifiers. The features are combined and classified, where the more accuracy values are obtained when all three features are combined as shown in table 3.
The graphical representation is shown below
*A-Area, S-Shape, L-Luminance
Figure 8. Chart for different accuracy level from KNN classifier
V.
CONCLUSION AND FUTURE WORK
A. Conclusion
In this proposed work, The techniques to detect anger or non anger emotions through full body movement activity. The emotion can be detected through BLOB
feature extraction such as AREA ,SHAPE, LUMINANCE and KNN classifier is used to predict correct accuracy level. The performance can be evaluated by recall, precision and F-Measure. The system is used in various application to detect anger of the person to avoid critical situation.
The idea is to make the user explicitly aware that a machine is analyzing his or her body cues and hence create a kind of dialogue between the user’s emotional behavior and the machine’s appropriate responses. This kind of situation is much more similar to person-person communication. The kinds of emotional signals that get sent during these kinds of interactions may be more intentional, very different and potentially easier to analyze by statistical algorithms.
B. Future work
Our proposed work is detecting anger or non-anger emotion of a person. Future work has been planned along several directions. Firstly and most importantly, we intend to examine whether the features we applied in this work are useful for identifying a wider range of emotions. In particular, we are aimed to consider other emotions also in various environments. Secondly, we plan to improve the accuracy of our emotion detection algorithms by incorporating additional features in it.
VI. REFERENCES
[1] Nele Dael, Marcello Mortillaro, and Klaus R.
Scherer University of Geneva.,” Emotion Expression in Body Action and Posture”., American Psychological Association 2012, Vol. 12, No. 5, 1085–1101.
[2] Konrad Schindlera, Luc Van Goola,b, Beatrice
de Gelderc.,” Recognizing Emotions Expressed by Body Pose: a Biologically Inspired Neural Model”
[3] Ginevra Castellano, Santiago D. Villalba, and Antonio Camurri., Infomus Lab, DIST, University of Geno MLG, School of Computer
Science and Informatics, University College Dublin., “Recognising Human Emotions from Body Movement and Gesture Dynamics“. [4] Radoslaw Niewiadomski, Maurizio Mancini,
Giovanna Varni, Gualtiero Volpe, and Antonio Camurri,.” Automated Laughter Detection From Full-Body Movements”,. IEEE TRANSACTIONS ON HUMAN-MACHINE SYSTEMS, VOL. 46, NO. 1, FEBRUARY 2016. [5] Jing Zhu & Paul Thagard. “Emotion And
Action”., Philosophical Psychology, Vol. *15, No. 1.
[6] Nesrine Fourati, Catherine Pelachaud . “Relevant body cues for the classification of emotional body expression in daily
actions”,8/15/$31.00 ©2015 IEEE.
[7] Neha Shirbhate ,Kiran Talele, Mumbai, India. ”Human Body Language Understanding for Action Detection using Geometric Features” 2016, IEEE.
[8] Bruce D. Keefe & Matthias Villing & Chris Racey & Samantha L. Strong & Joanna Wincenciak & Nick E. Barraclough.,” A database of whole-body action videos for the study of action, emotion, and untrustworthiness”.
[9] Haris Zacharatos, Christos Gatzoulis and Yiorgos Chrysanthou ”Automatic Emotion Recognition based on Body Movement Analysis:A Survey”.,
[10] J. Arunnehru and Kalaiselvi M Geetha.
“Automatic Activity Recognition for Video Surveillance”. International Journal of Computer Applications, Published by Foundation of Computer Science, New York, USA, August 2013.
[11] M. Kalaiselvi Geetha, S. Palanivel, “Video
Classification and Shot Detection for Video Retrieval Applications”, International Journal of Computational Intelligence Systems, vol. 2, no. 1, pp. 39-50, March 2009.
Video Using PCA and SVM ”, Lecturer Notes in Artificial Intelligence (LNAI), Springer International Publishing, Switzerland, Vol. 8284, pp. 70–81, December 2013.
[13] Arunnehru, J., and M. Kalaiselvi Geetha, “Automatic Human Emotion Recognition in Surveillance Video.” Intelligent Techniques in Signal Processing for Multimedia Security, Springer-Verlag, pp. 321-342, Oct. 2017. [14] Michael Garber-Barron , Mei Si .,”Using Body
Movement and Posture for Emotion Detection in Non-Acted Scenarios”., WCCI 2012 IEEE World Congress on Computational Intelligence June, 10-15, 2012 - Brisbane, Australia.
[15] Imen Tayari Meftah, Nhan Le Thanh, and Chokri Ben Amar,” Emotion Recognition Using KNN Classification for User Modeling and Sharing of Affect States”, Springer-Verlag Berlin Heidelberg 2012.