Performance of Clustering Algorithms on Home
Interview Survey Data Employed for Travel Demand
Estimation
Anand Sesham #1, Padmanabham P#2, Goverdhan A#3, Sai Hanuman A#4
#1
Associate. Professor,Dept of CSE, MVSR Engg College, Hyderabad, INDIA, #2
Professor of CSE and Director,Bharat group of Institutions,Hyderabad, INDIA, #3
Professor, Dept of CSE, SIT, JNTU Hyderabad ,INDIA, #4
Professor, Dept of MCA, GRIET, Hyderabad, INDIA,
Abstract - Clustering is one of the useful unsupervised data mining techniques which determine groups in data without labels or classes. Most clustering algorithms behave differently depending on the features of the data set and the initial assumptions for defining groups. Hence, in most applications the clustering scheme requires evaluation and assessment of its validity. In this paper it is proposed to compare different clustering algorithm results with respect to a real world dataset namely Household Interview Survey(HIS) data and make a study of the dependency of clustering criteria on the dataset and assess their suitability. Prior work [4], [5] involved application of data mining techniques including clustering and classification techniques on home interview survey data and showed their use in extracting previously unknown knowledge. There are a number of widely used algorithms in data mining commonly implemented in commercial and open source software which have been used in the present work. The present paper compares the results of various clustering algorithms on the transportation data and explores their use in this domain. Specifically, EM algorithm is compared with other algorithms using the popular log likelihood criteria for comparison and the problems of these algorithms are identified on the dataset
Keywords – Travel Demand Estimation, Socio-Economic Data, Home Interview Survey.
I.INTRODUCTION
The data to be used in this work has been extracted from [11]. Home Interview Surveys (HIS), obtained from surveys conducted in Hyderabad in connection with a Transportation project. It involved conducting personal interviews and collecting information from specially designed questionnaire from all persons who perform travel in the household. The sample used in the present work consists of 25,000 individuals information drawn from randomly selected households based on standard procedures. The main purpose of organizing such a large scale Home Interview Surveys was to understand the present day travel patterns and relate these travel patterns to the Socio-Economic characteristics of Trip makers, the type of activity after reaching the end of trip, and to the transportation supply provided in the form of road network, public transportation facilities etc. Through a set of models the Travel Demand is estimated for any horizon year. While so doing several socio economic and vehicle
ownership properties are captured through a set of questions administered on them. As will be seen, enormous data is collected, which is fit for further analysis through data mining techniques.
In this process it is established that startification of trip makers into homoheneous groups presents better predictive abihit. Hence data is stratified and seperate models are calibrated. For instance, sample is stratified based on Income level, or on Vehicle ownership, or alternative based on employment category. The objective of this research is to explore whether Data Mining techniques could extract a different set of homogeneous cluster that could better explain the travel behaviour.
Few attempts have been made recently to explore the possibility of using data mining techniques in the transportation related projects Some of the potential problems for data mining mentioned are traffic management, monitoring drowsy drivers, pavement management data, global positioning systems data, roadway videologs spatial data, geographical information systems for transportation data, road roughness data analysis etc. . Barai [12] explored the possibility of using data mining techniques on Vehicle Crash Study for road accident data and gives a list of various applications. Khaled Nasser[13] studied the use of data mining for the construction industry. Various others like [14], [15], [16] etc have attempted to use data mining applications on various transportation related data.
The present paper proposes to apply data mining clustering algorithms on Household Interview Survey Data and make a comparative analysis of the results. Clustering algorithms viz. K-Means, Expectation-Maximization(EM), Self Organizing Map(SOM), FarthestFirst, available in WEKA are used for the study.
II.TRANSPORTATION DEMAND ESTIMATION
The data to be used has been collected from a survey made in the city of Hyderabad. While so doing several properties are captured through a set of questions administered on each individual in the house. Basically they are addressed to answer the following basic properties.
3. What is his Vehicle Availability other than public transport services?
4. One of the concerns of this study is the vehicle ownership of families.
5. Preferences of people for public transportation. 6. Travel performed during the previous working day
24 hour period.
To answer these questions one has to analyze the variations in the following characteristics
• Is it possible to establish as to why they are investing money to acquire a Vehicle of their own, and if so is it related to the inadequacy of public transport system, or has it anything to do with their Occupation or to number of earning members?
• Is it possible to predict the potential of any household who at present do not have any vehicle but likely to acquire in future based on the analysis made on those who have already purchased them? The main objective of this study is to ultimately get answers to the above raised points.
III.HOME INTERVIEW DATASET DESCRIPTION
In the survey questionnaire [10], the information is collected in three parts. The travel patterns in the form of “Number of Trips” performed by each member in a city, from a identifiable location in the city called “Origin” to another identifiable location called “Destination”, together with the trip makers “Socio Economic characteristics”, is the primary bed block based on which future predictions of travel are made.
Details of the format and how the samples were created can be found in [11]. Table 1 presents the list of 28 socio economic variables collected from home interview survey. The main issue is to capture attributes that are relevant, causative and should not contain noise or redundancy.
A. Home Interview Survey Format
The format is briefly described below. Essentially it consists of three parts.
Part 1 A-House hold information:
Part 2 B- Details of each member of the household: Part 3 C-Trip Information:
There were 40 questions, out of whom the relevant socio economic variables are selected for the present analysis. TableI gives a description of the variables selected for this study.
The original dataset consists of more than 30,000 instances with more than 140 variables. Lot of computational problems have been encountered running the algorithms on a system with Intel Core 2 DuoTM processor, 3GM RAM . Hence sampling techniques were used to randomly select 1500 instances with 28 attributes. All the algorithms are administered on this data.
The computational times for the different algorithms have been presented.
Since it is not possible to accurately determine the number of clusters using algorithms like K-means, the EM algorithm using 10 fold cross-validation has been used for deciding upon the number of clusters.
TABLE IDETAILS OF DATA VARIABLES
Variable
No. Attribute Full Name
1 2 3
4
5
6
7
8
9
10
11
12
13 14 15 16
17 18
19 20
21
22 23
24 25 26 27 28
House hold details
MALES FEMALES TOTAL_NO
NO_MEM_STU
VO_CY
VO_SCOOTER
VO_MOTORCY
VO_CAR
TOTAL_VEHI
MONTH_INCO
MONTH_TRAN
RESIDENCE
Personal Details
AGE SEX
EDUCATION INCOME
OCCU_CODE RAIL_BUS_P
Travel details
TRIP_NO DISTANCE
PURPOSE
Work_1 Edn_2
Social_3
Shop_4 Emp_Bus_5 Other_6
Total number of males Total number of females Total members in household
No. of members in the family studying
Total number of cycles in the house
Total number of scooters in the house
Total number of motorcycles in the house
Total number of cars in the house
Total No. of vehicles in the house
Total Monthly income in Rs of house hold
Monthly expenditure Rs on transport in house hold
Residence Type; Owned or Rented
Age in years Sex Male or Female Education level code 1 to 5 Income per month Rs
Occupation code 1 to 11
Rail/Bus pass holder Trip number
Total distance traveled km
Purpose of travel 1 to 6, 11 to 16
Travel for work Travel for educational purposes
Travel for social gatherings
IV.CLUSTERING
Cluster analysis is an unsupervised process that divides a set of objects into homogeneous groups. It is a method of creating groups of objects, or clusters, in such a way that objects in one cluster are very similar and objects in different clusters are quite distinct. Since the goal of HIS is data exploration for specific observations, clustering techniques are to be used for further study. The aim is to come out with a framework which can be used to apply on these kinds of datasets to give solution to the experts in the domain.
A. Discussion of Algorithms used 1. k-Means Algorithm
k-Means algorithm [1] is very popular among researchers and data mining specialists. The k-means algorithm functions in two phases. In the first phase, it randomly assigns all instances into k clusters. In the second phase, it calculates the distance between each instance to each cluster and assigns the instance to the nearest cluster.This algorithm defines an objective function called sum of squared error which defines the goodness of a cluster. It is defined as
E = kΣ
i=1ΣxєCi d(x,µ(Ci))
Where Ci, i=1,2…k are k disjoint clusters, µ(Ci) is the mean of cluster Ci and x is a data point. This process of partitioning followed by updating is repeated until either the cluster centers do not change or there is no significant change in the J values of two consecutive iterations. This algorithm is selected to indicate partitional algorithms. The distance measure used is the standard L1 norm Deuc (x,y) =
where xj and yj are the jth components
of x and y respectively.
2 EM Algorithm
The EM [20] (Expectation Maximization) algorithm is an example of soft clustering, which performs clustering in two important ways. This algorithm assigns instances or observations to clusters to maximize the differences in means. It computes probabilities of cluster memberships based on one or more probability distributions. It then maximizes the overall probability or likelihood of the data, given the final clusters. This algorithm is selected to indicate probability based algorithms.
3. SOM Algorithm
Self-Organizing Map (SOM)[21] algorithm is a kind of artificial neural network which is trained using unsupervised learning to produce a low-dimensional, discretized representation of the input space of the training samples, called a map. The architecture of SOM consists of two fully connected layers: an input layer and Kohonen layer. The neurons in Kohonen layer are arranged in a one or two dimensional lattice. The number of neurons in the input layer matches the number of attributes of the instances. The algorithm basically has three processes: competition, cooperation and adaptation. The height and width of lattice is taken as 2. This algorithm is selected to indicate the neural network based algorithms.
4. Farthest First Algorithm
Farthest First is a variant of k-means algorithm that places each cluster centre in turn at the point farthest from the existing cluster centers. This point must lie within the data area. This greatly speeds up the clustering in most cases since less reassignment and adjustment is needed. This algorithm also uses euclidean distance for calculating similarities.
5. Sequential Information Bottleneck (sIB) Algorithm [23]This is based on the information bottleneck method. The sIB algorithm performs partitions equal to K clusters. The algorithm starts from an initial random partition T = {t1, t2, ..., tK} of the original data X. At each step, some x ∈ X is drawn out of its current cluster t(x) and represented as a new singleton cluster. Using a greedy agglomeration step x is merged with tnew such that tnew = argmint∈T dF({x},
t), to obtain a new partition Tnew. Assuming that tnew != t, F(Tnew) > F(T). Each such step either improves the score, or leaves the current partition unchanged. Here d(x, t) = (p(x) + p(t)). JS(p(y|x), p(y|t)), where JS is the Jensen-Shannon divergence[24]
JS(p, q) = π1DKL(p|| ¯p) + π2DKL(q||¯p).
V. Number of clusters
All the algorithms chosen require the user to specify the number of clusters. This is seen as a major research problem by itself. There are many ways of deciding the number of clusters available in the literature like simple trial and error process can be used or other algorithms like Expectation Maximization, SOM etc can be used which can decide on the number of groups[7]. In this paper SOM algorithm is used to decide the number of clusters as 4.
VI.COMPARISON OF ALGORITHMS ON DATASET
Clustering algorithms have been classified into various types like partitioning, hierarchical, model based, grid based etc. It will be beneficial to the domain experts if a comparative study of the suitability of these algorithms on the given dataset is done. The objective of the current research is to do the same on the transportation dataset using the [8] k-means, EM, Self Organizing Map[9], FarthestFirst, algorithms implemented in java based software called WEKA.
A. Experimental Setup
The dataset has been normalized and clustering was performed by training on two thirds of data and the rest was used to test. All the algorithms were run on WEKA software.
B. Cluster Evaluation
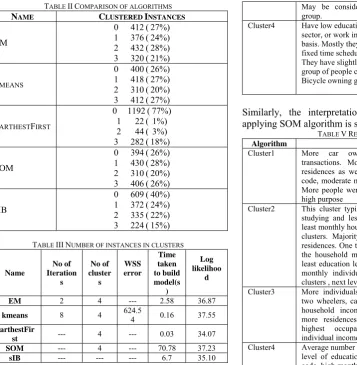
TABLE IICOMPARISON OF ALGORITHMS
NAME CLUSTERED INSTANCES
EM
0 412(27%)
1 376(24%) 2 432(28%)
3 320(21%)
KMEANS
0 400(26%)
1 418(27%) 2 310(20%)
3 412(27%)
FARTHESTFIRST
0 1192(77%)
1 22( 1%) 2 44( 3%)
3 282(18%)
SOM
0 394(26%) 1 430(28%)
2 310(20%) 3 406(26%)
SIB
0 609(40%) 1 372(24%)
2 335(22%) 3 224(15%)
TABLE IIINUMBER OF INSTANCES IN CLUSTERS
Name
No of Iteration
s
No of cluster s
WSS error
Time taken to build model(s
)
Log likelihoo
d
EM 2 4 --- 2.58 36.87
kmeans 8 4 624.54 0.16 37.55 FarthestFir
st --- 4 --- 0.03 34.07
SOM --- 4 --- 70.78 37.23
sIB --- --- --- 6.7 35.10
With reference to Table III, EM, kmeans, SOM, sIB algorithms produced clusters with almost same number of instances whereas FarthestFirst produced clusters with lot of variation by placing maximum instances in first cluster.
VII.INTERPRETATION OF CLUSTERING
k-means algorithm[4][5] was applied to the dataset and 4 clear clusters were identified and already reported in [4] and as it is presented here. The inferences are drawn by applying SOM algorithm which also automatically selected 4 clusters:
TABLE IVRESULTS OF K-MEANS
Algorithm Kmeans
Cluster1 Is associated with Persons having high Income,
having car ownership, persons having fewer dependents, or more earners, houses located away from public transport systems etc. In other words they belong to Prosperous families. One can identify the prosperity by associating Car with the house
Cluster2 Consists of people whose incomes are slightly
lower than the first group, but with more dependents, or less earners, with slightly less educational standards. They possess at least a Two Wheeler like, scooter, motor cycle, moped etc. This group can be considered as upper middle class and can be considered as those who own Two Wheeler.
Cluster3 consists of people mostly who do not have any
vehicle but, may have occasionally Two Wheeler, but they prefer to travel by public transport. Their family size is slightly bigger, and this group can be considered as Middle Income group people.
May be considered has No vehicle Owning group.
Cluster4 Have low educational level, work in private
sector, or work in some activity on daily wage basis. Mostly they have a bicycle if they work in fixed time schedule activity, or on contract basis. They have slightly lower type of residences. This group of people can be considered as having Bicycle owning group.
Similarly, the interpretation of clusters obtained after applying SOM algorithm is shown in Table V.
TABLE VRESULTS OF SOM
Algorithm SOM
Cluster1 More car ownership and more monthly
transactions. Moderate levels of ownership of residences as well as education, moderate occu_ code, moderate monthly income of the household. More people were opting for rail and bus passes, high purpose
Cluster2 This cluster typically has less number of people
studying and less vehicle ownership and having least monthly household income compared to other clusters. Majority of the people lived in rented residences. One typical observation is that most of the household members were of young age, and least education levels, least occupation code, least monthly individual income compared to other clusters , next level purpose
Cluster3 More individuals, fewer instances, cycles, more
two wheelers, cars, more vehicles, more monthly household income, more monthly transactions, more residences, more elders, high education, highest occupation code, highest monthly individual income, least purpose of travel
Cluster4 Average number of individuals, two wheelers, high
level of education, medium level of occupation code, high monthly income, high ownership of rail bus pass, moderate values of purpose of travel Table VI shows the clusters obtained after applying sIB algorithm.
TABLE VIRESULTS OF SIB
Algorithm sIB
Cluster1 Maximum people using rail and bus pass,
travelling with a purpose
Cluster2 Maximum males, females, no of members
studying, cycles, two wheelers, total vehicles, monthly incomes,
Cluster3 Medium values of purpose of travel,
Cluster4 High values of purpose of travel, high S1_type_pa,
medium levels of ownership of vehicles
Table VII shows the clsuetrs interpretation for EM algorithm.
TABLE VIIRESULTS OF EM
Algorithm EM
Cluster1 High usage of Rail and bus pass, high levels of
distance travelled,
Cluster2 Medium levels of distance travelled, nothing more
significant
Cluster3 Medium number of males and females, medium
number of members studying, medium cycles, medium two wheelers, medium vehicles, medium monthly income, medium education level, high S1_TYPE_PA
Cluster4 Maximum number of males, females, highest no of
It is evident that different algorithms grouped the instances into different clusters. As an illustration we show the clusters contents for the algorithms. Results of kmeans have been taken from the authors earlier work[4]. Incidentally SOM algorithm selected the number of clusters as four. Looking at the clustering results confirms the fact that different algorithms are giving different clusterings. It is to be investigated whether the clusters we got are valid or not by using validity indices.
VIII.SOME OBSERVATIONS
Evaluating clustering results on HIS dataset lead to the following observations
a) Schema integration issue: As the data was spread around five flat files with many variables distributed with different names and formats. b) A lot of computational problems have been
encountered running the algorithms on a system with Intel Core 2 DuoTM processor, 3GM RAM on more than 30,000 instances. Hence sampling without replacement is used to get 1500 instances. The computational times for the different algorithms have been presented.
c) The number of clusters has to be decided either by domain experts using trial and error process or use other algorithms like EM etc.. it is intended to make a study of optimisation of the number of clusters by using evolutionary computation techniques.
d) It is proposed to study the use of cluster validity indices on the dataset to check the validity of clustering process using various algorithms. e) Clustering algorithms were grouping the data
differently. A proper decision is to be made regarding the choice of the algorithm.
IX.CONCLUSION
Experimental runs of different algorithms indicate that the selection of number of clusters and the algorithm itself is effecting the results of clusters. Also, partitional clustering seems to be more suitable for the dataset. kmeans algorithm gave better performance in terms of computational times. Evaluation and inferring the output of k-means and SOM algorithms has been done and presented. All the algorithms require the entire dataset to be present in main memory which is a major bottleneck. Instead of clustering on original data, it is proposed to use Principal Component Analysis(PCA) and Factor Analysis(FA) on the data and then apply clustering on the components. A comparision is to be made. Optimisation techniques like evolutionary algorithms need to be studied on the given dataset.
REFERENCES
[1] MacQueen, J. B. (1967), Some Methods for classification and
Analysis of Multivariate Observations, Proceedings of 5th Berkeley Symposium on Mathematical Statistics and Probability, Berkeley, University of California Press, 1:281-297
[2] Micheal Kerns, Yishaymansour, Andrew Y. Ng, An
Information-Theoretic Analysis of Hard and Soft Assignment Methods for Clustering,
http://citeseerx.ist.psu.edu/viewdoc/summary?doi=10.1.1.48.3989, www.aaai.org/Papers/Workshops/2000/WS-00-01/WS00-01-11.pdf
[3] Sesham Anand, Sai Hanuman A, Dr. Govardhan A, and Dr.
Padmanabham P, Application of Data Mining Techniques to
Transportation Demand Modelling Using Home Interview Survey Data, International Conference on Systemics, Cybernetics and Informatics 2008.
[4] Sesham Anand, Sai Hanuman A, Dr. Govardhan A, and Dr.
Padmanabham P, Use of Data Mining Techniques in understanding
Home Interview Surveys Employed for Travel Demand Estimation, International Conference on data Mining(DMIN ’08) at Las Vegas, USA, 2008
[5] Mark Hall, Eibe Frank, Geoffrey Holmes, Bernhard Pfahringer,
Peter Reutemann, Ian H. Witten, The WEKA Data Mining Software:
An Update; SIGKDD Explorations, Volume 11, Issue 1(2009).
[6] WEKA mailing list:
https://list.scms.waikato.ac.nz/mailman/htdig/wekalist/2011-February/024843.html.
[7] Dan Pelleg, Andrew W. Moore, X-means: Extending K-means with
Efficient Estimation of the Number of Clusters,Proceeding ICML '00 Proceedings of the Seventeenth International Conference on Machine Learning.
http://staff.utia.cas.cz/nagy/skola/Projekty/Classification/Xmeans.pd f.
[8] Vesanto J, Alhoniemi E, Clustering of the self-organizing map, IEEE
Transaction on Neural Networks.2000;11(3):586-600.
[9] Sai Hanuman A, SeshamAnand, Dr. Vinaybabu A, Dr. Govardhan A
and Dr. Padmanabham P, Efficient Use of Open Source Software for
Knowledge Discovery from Complex Databases, 2009 IEEE International Advance Computing Conference (IACC 2009)Patiala, India, 6–7, March 2009.
[10] Development of Hyderabad Multimodal Suburban Commuter
Transportation System, Government of Andhra Pradesh, 2004.
[11] Sudhir Kumar Barai, Data Mining Applications in Transportation
Engineering, Transport , Vol XVIII, No 5, 216-223, 2003.
[12] KhaledNassar, Application of data mining to state transportation
agencies projects databases, http://itcon.org/2007/8/
[13] Tibebe Beshah, Shawndra Hill, Mining Road Traffic Accident Data
to Improve Safety: Role of Road-related Factors on Accident Severity in Ethiopia http://ai-d.org/pdfs/Beshah.pdf.
[14] Tibebe Beshah Tesema, Ajith Abraham and CrinaGrosan, Rule
Mining and classification of road accidents using Adaptive Regression Trees, http://www.softcomputing.net/ijsst1.pdf.
[15] MichailGkolias, Data Mining in Truck Volume Estimation,
http:
//www.ite-metsection.org/pdf/Student%20Papers/MET_Student_Comp_Gkolia s.pd
[16] Moore, A. W., Pelleg. D, X-means: Extending k-means with efficient
estimation of the number of clusters. In P. Langley (Ed.), Proceedings of the Seventeenth International Conference on Machine Learning (pp. 727–734). Stanford, CA. San Francisco: Morgan Kaufmann (2000).
[17] Fisher, D , Knowledge acquisition via incremental conceptual
clustering. Machine Learning, 2(2), 139–172 (1987).
[18] Gennari, J. H., Langley, P., & Fisher. D, Models of incremental
concept formation. Artificial Intelligence, 40, 11–61(1990).
[19] Ian H. Witten, Frank Eibe, Mark A. Hall. Morgan Kaufmann 3rd Ed,
Data mining practical machine learning tools and techniques.
[20] T. Kohonen, "Learning Vector Quantization", The Handbook of
Brain Theory and Neural Networks, 2nd Edition, MIT Press, 2003, pp. 631-634
[21] Ultsch A (2005) Clustering with SOM: U*C. In: Proceedings of the
Workshop on Self-Organizing Maps, 75–82.
[22] http://research.ijcaonline.org/volume46/number22/pxc3879627.pdf
[23] Noam Slonim, Nir Friedman, Naftali Tishby Unsupervised Document
Classification using Sequential Information Maximization, , SIGIR’02, August 11-15, 2002, Tampere, Finland
[24] J. Lin. Divergence Measures Based on the Shannon Entropy. IEEE