The Effect of Disc brake Rotor Conditions on Brake Performance
Yousef Ali Al Mulla
1, Yousef Alhouli
2, Jasem Alazemi
2, Fahad Almaskari
3 1The Industrial Training Institute – Sabah Al Salem
Public Authority for Applied Education and Training (PAAET), Kuwait
2
Automotive and Marine Engineering Technology Dept. / Collage of Technological Studies
Public Authority for Applied Education and Training (PAAET), Kuwait
3
Mechanical Engineering Department. Khalifa University of Science and Technology,
Petroleum Institute, Abu Dhabi, United Arab Emirates
Abstract
Brake system in automobile vehicle is very crucial to control reacceleration and to bring it to complete stop. Faults in the break system can cause accidents and in worse scenario fatality. Therefore it is important to study the factors that trigger failure mechanisms in brake system and how it can be prevented. In this paper a study of effect of disc break rotor condition to the integrity of brake system is presented. Three brake tests are made on GMC Acadia 2008 model, one in a good condition disc brake rotor, two tests in a modified disc brake rotor, to simulate disc brake failure. The first modification of the disc brake was done on right hand side front and rear axle to reface the disc brake rotor 2.5 mm less than the left hand side. The second modification of the disc brake was done also on right hand side front and rear axle by making a groove in the disc brake to simulate bad maintenance or bad condition disc brake. All results was recorded from special device Bosch brake test lanes. Results showed that good condition of the disc brake rotors have a force difference less than 10 % between the right and left brakes. While in the first modification of disk brake, a significant force difference of 27% between the brakes was recorded. This brake difference is above the acceptable critical value of 25%. Moreover, in the second modification of disk brake, the difference force between the brakes has reached 30%. This different in brake force can cause the vehicle to spin out of control and may cause an accident.
Keywords: Disc brake, Disc brake rotor, Automotive brake.
1. Introduction
Automotive brake system are designed to slow down or stop the motion of a vehicle by dissipating kinetic energy via friction to heat. It has mechanical, electronic and hydraulically activated components which use friction to stop a moving vehicle.
When a driver presses on the brake pedal, a piston in a connected master pump will be depressed to release hydraulic pressured fluid to reach each wheel’s brake,
creating a clamping force that presses the brake pad against the brake disc (rotor). Friction is generated as a result of this clamping force between the two parts. This friction slow down and stop the vehicle by convert the kinetic energy to heat. The harder the driver push on the pedal, the more pressure and higher clamping force is applied to the brakes.
There are two different types of braking systems used in most cars: drum brakes and disc brakes. For the purpose of this research only the disc brake rotor will be considered as it is the most popular brake system. The development of disc brakes represents a major advancement in brake design. Unlike the drum brakes, the disc brake utilize external surface for friction, which allow it to cool much more rapidly and provide higher serviceability advantages.
Disc brake system consists of disc rotor, a caliper and pads. When the driver presses on the brake pedal, the brake caliper squeeze/clamp the pads against the disc rotor from each side and rubs it to make it slow down or stop. The harder the driver push on the pedal, the more pressure is applied to the brakes causing higher friction, and therefore the more energy will be dissipate into heat at the contacted area in the disc brake. As a result of friction and heat, the brake disc will degrade and need to be repaired or replaced.
www.ijiset.com
2. Literature Review
This paper presents an experimental investigation on disc brake rotor thickness and how it effects on the overall brake performance. Different studies on disc brake rotor are available in the literature with different perspectives. For example, Belhocine, Bouchetara, and Mustafa presented the thermo-mechanical Behavior of disc brake rotor. Via Finite Element Analysis (FEA), they studied thermo-mechanical Behavior of Dry Contacts in Disc Brake Rotor with a Grey Cast Iron composition [1] and the thermo-mechanical behavior of the dry contact between the brake disc and pads during the braking phase [2]. Via FEA, Choi and Lee [3] studied a transient analysis for thermo-elastic contact problem of disk brakes with frictional heat generation.
Adamowicz et al. [4] studied and compared the temperature distributions caused by mutual sliding of two members of the disc brake system basing on two- and three-dimensional FEA modelling techniques and complexity of the phenomenon. Also they evaluated an impact of convective mode of heat transfer on the thermal behaviour of a disc brake system during repetitive braking process with the constant velocity using fully three-dimensional finite element model [5].
Alnaqi et al. [6] used scaling methodology to evaluate the thermal performance of a disc brake at a reduced scale. They validated their method by comparing the results for the full and small scale discs using a conventional brake dynamometer in addition to the numerical simulation.
More and Sivakumar [7] have utilized Computational Fluid Dynamic (CFD) in their analysis of automotive ventilated disc brake rotor. Cunefare and Graf [8] presented an experimental investigation into the application of “dither” control for the active control and suppression of automobile brake disc squeal. Ripley et al. [9] reported on their paper neutron-diffraction measurements of the levels and distribution of residual strains in a used cast iron brake disc rotor. Söderberg et al. [10] discussed how wear of the pad-to-rotor interface can be predicted using general purpose FEA software. They developed three-dimensional FE model of the brake pad and the rotor to calculate the pressure distribution in the pad-to-rotor contact.
Antti et al. [11] presented the characteristics and difficulties encountered in tackling brake squeal and provided a review of the analytical, experimental and numerical methods which were used for the investigation of brake squeal.
Despite the numerous studies of the disc brake rotor in the literature, explicit study on the effect of disc brake rotor thickness has not be stated. This paper aim to fill this gab
and identify the effect of such problem and recommend what precautions must be taken in such problem.
3. Tests Description and Specifications
GMC Acadia model 2008 car is used in this research as shown in Figure 1 with the car specifications listed in Table 1 to examine the disc brake rotor to see the condition of the brake performance. Three brake tests were carried out in this work. Test (1) shows new discs brake used to examine the brake at normal condition as shown in Figure 2. Test (2) is done to simulate a fault in the disc brake rotor and determine its effects on brake performance. The fault is done with modification on the discs to reface and reduce the thickness of the right front and right rear brake discs by 2.5 mm while the other brake discs thickness in the left hand-side is standard 29 mm.
Test (3) was carried out to simulate another fault by modification on the disc brake by making a grooves on the right hand side front and rear axle of the discs to simulate one side bad maintenance or bad disc brake condition. All tests on the brake force is then taken for the car on a special device (Bosch brake test lanes Figure 3 with test specification listed in Table 2) to examine the strength and performance of the brake system
.
Figure 1: GMC Acadia 2008 which is used for test brake
Figure 2: Brake discs for the right hand-side wheels
Table 1: Specifications for the vehicle used in the test:
Maker GMC
Model ACADIA
Model year 2008
Mileage 63000 KM
Engine size 3.6L V6
Table 2: Specifications for the brake test lanes
Machine name Bosch brake test lanes
Model number SDL 4330 S40
Maximum test load 2.5 t
Maximum transit load 4.0 t
Dimensions (W x L x D) 2360 x 660 x 250 mm
Roller diameter 205 mm
Roller width 70 mm
Roller elevation 25 mm
Type of display Analog
Nominal measuring range 0-8Kn
Figure 3: Bosch brake test lanes
4. Test Procedure and Results
4.1 Test 1 Brake disc rotor in good working
condition:
Once the new disc brake fitted on the test vehicle, test was carried out for 5 minutes to examine the friction force on all the four brake discs.
Bosch brake test lanes device is used to record the test results and show the strength and performance of the brake system. The devise showed three type of results for both the front and rear axles: suspension test, service brake, and park brake tests as shown in Figure 4.
Figure 4: Brake test for good condition brake disc rotor
The results for good working condition brake disc rotors are presented in Table 3 to 5.
Table 3: Suspension Test:
Front axle Rear axle
Left Diff Right Left Diff Right
Resonant frequency
16 Hz
1 Hz
15 Hz
15 Hz
0
Hz 15 Hz
Road Grip 71% 3% 69% 44% 6% 47%
Wheel weight
636 kg
604 kg
538 kg
501 kg Axle
weight 1240 kg 1039 kg
Table 4: Service Brake Test:
Front axle Rear axle
Left Diff Right Left Diff Right
Rolling resistance
134 N
143 N
134
N 163N
Brake force
5000
N 8 %
4601 N
3352
N 6 %
3138 N Pedal
force weight
1240 kg 1039 kg
Table 5: Parking Brake Test:
Left Diff Right Total weight
measured Brake
force 2548 N 12 %
2899
www.ijiset.com
Figure 5: Charts results for good condition brake disc rotor
Through the above tables, it is clear that the Brake Test Lane device can test more than one type of brake test, such suspension test, brake and parking brake. However, the main focus of this research is the brake test. From Table 4 a good condition brake disc generate less than 10% difference in force between left and right brakes. Within this test condition, the car was balanced and successful braking was achieved.
4.2 Test 2 Brake disc rotor modified for different thickness:
Then modification of the brake disc rotor of the right hand side wheels is done to induce a fault via reducing the thickness of brake disc rotor to 26.5 mm, which is below the manufacture minimum rotor thickness of 27.5 mm. In a similar manner to Test 1, Test 2 was carried out to examine the friction force on all brake discs. The test carried out for 8 minutes to examine the friction force for the four wheels again under the new condition.
Figure 6: Brake lathe machine to reface the rotor
Figure 7: Micrometer to check the rotor thicknesses
Figure 8: Brake test for modified brake disc rotor thickness
Table 6: Suspension Test:
Front axle Rear axle
Left Diff Right Left Diff Right
Resonant frequency
13 Hz
1 Hz
12 Hz
14 Hz
1 Hz
15 Hz Road
Grip 75% 28% 54% 82% 4% 85%
Wheel weight
600 kg
599 kg
582 kg
458 kg Axle
weight 1199 kg 1040 kg
Table 7: Service brake Test:
Front axle Rear axle
Left Diff Right Left Diff Right
Rolling resistance
172 N
163 N
172 N
182 N Brake
force
458 8 N
25 %
3444 N
4291 N
27 %
3128 N Pedal force
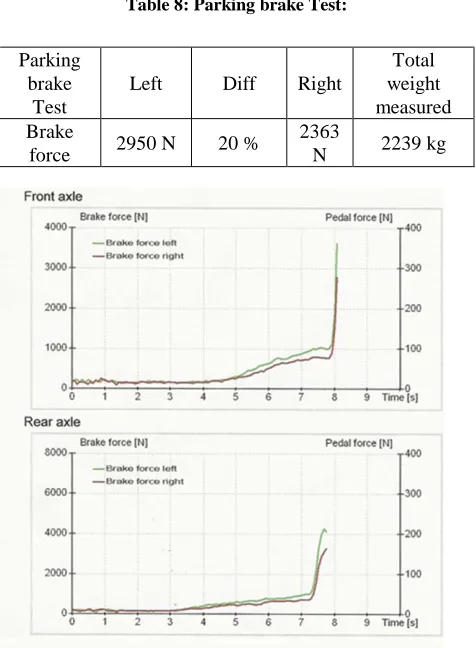
Table 8: Parking brake Test:
Parking brake
Test
Left Diff Right
Total weight measured Brake
force 2950 N 20 %
2363
N 2239 kg
Figure 9: Charts results for modified brake disc rotor thickness
Following the modification that was made to simulate fault in disc brake rotor thickness, the results showed that the brake force difference-service brake (∆) test for the front axle and the rear axle is between 25 to 27%, which exceed the allowed limits of 25 %. Also the force difference between the right and lift wheels for the front axle which is (1144 N), and the force difference between the right and lift wheels for the rear axle is (1163 N). From Figure 7, Front axle chart showed peak brake forces that bring the vehicle to complete stop were nearly 3600 N on the left brake side and 2700 N on the right brake side. Whereas the Rear axle chart showed peak brake forces that bring the vehicle to complete stop were nearly 4200 N on the left brake side and 3200 N on the right brake. All of these results indicate big difference that could lead to unbalanced force system.
4.3 Test 3: Grooved modified disc brake
In this test, modification of the brake disc rotor of the right hand side wheels front and rear is done to simulate the groove on the brake disc rotor. This grooves can be a result of worn out brake pads. Grooves of 1.2 mm is made on the brake disc rotor by using lathe machine and the measurements of such grooves was made by using Clay paste as shown on Figure 9.
Figure 9: Grooved modified disc brake
www.ijiset.com Table 9: Suspension Test:
Front axle Rear axle
Left Diff Right Left Diff Right
Resonant frequency
13 Hz
0 Hz
13
Hz 15 Hz
1 Hz
14 Hz
Road Grip 58% 1% 49% 87% 1% 86%
Wheel weight
688 kg
625
kg 417 kg
416 kg Axle
weight 1313 kg 833 kg
Table 10: Service brake Test
Front axle Rear axle
Left Diff Right Left Diff Right
Rolling resistance
172 N
134
N 172 N 172N
Brake force
4770 N
30 %
3348
N 4119N
28 %
2966 N Pedal
force weight
1313 kg 833 kg
Table 11: Parking brake Test
Parking
brake Test Left Diff Right
Brake
force 4128 N 17%
3444 N
Figure 10: Charts results for grooved modified disc brake
Following the modification that was made to simulate fault in disc brake rotor grooves, the results showed that the brake force difference-service brake (∆) test for the front axle and the rear axle is between 28 to 30%, which exceed the allowed limits of 25 %. Also the force difference between the right and lift wheels for the front axle which is (1422 N), and the force difference between the right and lift wheels for the rear axle is (1153 N). From Figure 10, Front axle chart showed peak brake forces that bring the vehicle to complete stop were nearly 3400 N on the left brake side and 2300 N on the right brake side. Whereas the Rear axle chart showed peak brake forces that bring the vehicle to complete stop were nearly 4300 N on the left brake side and 3000 N on the right brake. All of these results indicate big difference that could lead to unbalanced force system.
5. Conclusions
The disc brake rotor condition has a great impact on performance of the brake system. When the disc brake rotor has some kind of damage wear such as thicknesses reduction and deep grooves compare to the other disc brake rotors on the other side of the vehicle, an unequal brake force between the right side and the left hand-side axle will be produced. In this case, the brakes will grab harder on one side. Unbalanced force can cause the brake to pull to one side and the car will spin out of control or skid and shifted from the road when the driver depress the brake pedal to stop the car. This brake failure may lead to accidents, property damage, physical injuries or even death of an individual.
Attempts to repair the disk brake beyond the manufacturing recommendation can rise risks and therefore should be prevented by regulations to ensure safety for motorists and public. Therefore it is recommended to follow manufacturer recommendations and specifications when disc brake rotor need prefacing by lathe machine. Also when too deep groves exceeds manufacturer specifications it is recommended to replace the disc brake rotor. Balancing of disc rotor thickness is a must to ensure safe overall performance of brake system prevent brake failure.
References
[2] Belhocine, Ali ; Bouchetara, Mostefa. 2014. Structural and Thermal Analysis of Automotive Disc Brake Rotor. : Archive of Mechanical Engineering. Vol.61 (1), pp.89-113.
[3] Choi, Ji-Hoon ; Lee, In. 2004. Finite element analysis of transient thermoelastic behaviors in disk brakes. Wear. Vol.257(1), pp.47-58.
[4] Adamowicz, Adam ; Grzes, Piotr. 2011. Analysis of disc brake temperature distribution during single braking under non-axisymmetric load. Applied Thermal Engineering, Vol.31 (6), pp.1003-1012.
[5] Adamowicz, Adam ; Grzes, Piotr, 2011. Influence of convective cooling on a disc brake temperature distribution during repetitive braking. Applied Thermal Engineering, Vol.31 (14-15), pp.2177-2185.
[6] Alnaqi, Abdulwahab A.; Barton, David C.; Brooks, Peter C., 2015. Reduced scale thermal characterization of automotive disc brake, Applied Thermal Engineering, Vol.75, pp.658-668.
[7] Amol V. More ; Prof.Sivakumar R., 2014. CFD Analysis of Automotive Ventilated Disc Brake Rotor, International Journal of Engineering Research and Applications, Vol.4 (4), pp.01-05.
[8] Cunefare, K.A. ; Graf, A.J. 2002.’ Experimental Active Control of Automotive Brake Rotor Squeal using Dither.
Journal of Sound and Vibration, Vol.250 (4), pp.579-590. [9] Ripley, Maurice I. ; Kirstein, Oliver, 2006. Residual
stresses in a cast iron automotive brake disc rotor. Physica B: Physics of Condensed Matter, Vol.385, pp.604-606. [10] Söderberg, Anders ; Andersson, Sören, 2009. Simulation of wear and contact pressure distribution at the pad-to-rotor interface in a disc brake using general purpose finite element analysis software, Wear, 2009, Vol.267(12), pp.2243-2251.