ISSN 2286-4822 www.euacademic.org
Impact Factor: 3.1 (UIF) DRJI Value: 5.9 (B+)
Occupational Structure of Kashmir: A Case Study of
Block Kupwara
Dr. BILAL AHMAD KHAN (Kupwara) School of Economics University of Indore India
Abstract:
A very high proportion of working population is engaged in agriculture. In Jammu and Kashmir about seventy five percent of the population derives its livelihood directly and indirectly from the agricultural sector. It is evident that the proportion of population engaging agriculture in developed economies is much less than the proportion of population engaged in agriculture in under developed economies like Jammu and Kashmir economy. In J&K State where present occupational structure clearly reflects the backwardness in Jammu and Kashmir economy. We also examined that occupational distribution of employment has changed last from five decades and employment structure in the state demonstrates skewed distribution
biased towards tertiary sectors. The main objective of this study is to identify the employment pattern
of different sectors and to examine the growth rate of working population of state.
Key words: Kashmir, occupational structure, Block Kupwara
Introduction
Review of Related Literature
In this chapter, an attempt has been made to review the related and earlier literature on Occupational pattern in Kashmir. The chapter has been divided into three sections: Section 1 deals with the review of the studies conducted at international level. In section 2, the studies undertaken in India at national level has been reviewed & section 3 takes care of studies and literature at state level means Jammu and Kashmir.
Section 1: International Review
The following work conducted at international level related with topic is given
below:-1. Tella, R. D and MacCuuloch, R. (2002) conducted a study and presented a simple model where workers desire for insure against unemployment risk. Authors then conducted first empirical analyses of the determinants of parameters of the benefit system while using data for developed countries for 1971-89 year. The study found that the level of benefits falls when the unemployment rate is high which is consistent with Wright’s tax effect. 2. Fermandes, R. and Felicio, F. (2005), used panel data
3. Rozadq, M.G. and Menendez, A. (2006) analyzed the trends in income inequality and poverty among Argentina households during the nineties. By using a micro simulation approach, the authors assessed the effect of changes in labor force participation, unemployment, educational levels and returns to individual characteristics on income inequality and poverty. The study found that changes in labor force participation are associated with a reduction in the poverty rate.
4. Eliason, M. and Storrie, D. (2006) observed that recently improved Swedish register data have made it possible to remedy many weakness of previous research on displaced workers. Using linked data, the authors identify all displaced workers in 1987, due to an establishment closure. Study found displaced workers suffer both earnings losses and worsened labor-market position not only during a transitory period of adjustments but also in long run.
5. Greversen, B. K. and Ours, J. (2008) investigated how a mandatory activation program me in Denmark affects the job finding rate of workers. The analysis showed that job finding rate in the treatment group is 30% higher than the control group which is mainly driven by the intensive contacts between the unemployed and the public employment service.
Section 2: National Level
In this section, an attempt has been made to review various employment patterns.
and concluded that 28% of labor force in Punjab agriculture is surplus.
2. Bhalla (1970) has also occasionally argued that only a small proportion of tertiary employment in the less developed countries is a function of income elasticity of demand for services and a large majority of it is believed to be a manifestation of excess supply of labor relative to demand.
3. Fallon (1983), investigated why job seekers tend to experience longer search. The empirical analysis based on a survey of Delhi job seekers indicates that while the duration of search is mainly determined by educational level.
4. Singh L.B. (1994) has undertaken a study with sole objective of finding out the extent of the problem of adjustment confronted by the educated unemployed young men as against the educated employed young men in different spheres of life.
5. Bhattacharya (1997) has conducted the empirical study on changing composition of employment in tertiary sector.
6. Ghose, A. K. (1999) has observed that growth performance of the Indian economy has failed to improve employment conditions in the country. The study revealed that if this practice continues, the country will soon be confronted with a number of socio-economic problems.
8. Sundaram (2001) examined the changes in the size and structure of workforce, labor productivity, and wage earnings per worker and per head of population in rural and urban areas. The finding of the study shows a slow growth of work force relative to that of population and reduction in the share and size of the workforce in agriculture.
Section 3: State Level
Thus enough work has been done on employment pattern at international or national level. However, no study work was done on this topic but small attempt has been made in the form of articles which are published and unpublished regarding employment pattern and generation in Jammu and Kashmir.
Hypothesis
In order to investigate the proposed problem, following hypothesis has been tested in the course of investigation:
1. Ho: There will be positive and significant relationship between population growth and work force growth 2. Ho: The employment structure in the state
demonstrates skewed distribution biased towards
tertiary sectors.
Objectives
The problem is proposed to be investigated with following objectives:
To identify the employment pattern of different sectors.
To examine the growth rate of labor force related with growth rate of population.
Methodology
Source of data
The study work is based on both primary and secondary data. Small portion of the present study is based on data collected from primary survey. For collecting primary data in the area, sample was selected for information regarded to study work. However more study will be based on secondary data.
Statistical Tools and Techniques
Appropriate statistical techniques will be applied as follows
1. Percentage: Percentage is obtained by the working population of area by the total number of population of area i.e.
No. of working population of area × 100 Total population of area
2. Growth Rate: In order to find out the change of working force from one period to another in the state, we find out the growth rate by this formula
PR = VPRESENT – VPAST
Where, PR= Percent Rate
V Present= Present Value, V Past= Past Value
3. Pearson’s Coefficient of Correlation: To analyze the degree or extent between two variables i. e; workforce and population of study area. Pearson’s correlation coefficient is used by adopting the following formula:
R = ∑
- nxy
/
2 - n
y
2 -n
2Discussion and Findings
countries and absorbs only a small section of labor force. Trade transport, communication and banking and insurance etc. are included in the tertiary sector. Kuznet and Colin Clark prefer to call them service industries. Generally productivity in tertiary sector is very high. Hence transfer of population primary industries to secondary and eventually to tertiary activities is considered a reliable index of economic progress.
Colin Clark in his book ‘’Conditions of Economic Progress’’ argues that there is a close relationship between developments of an economy on the one hand and occupational Structure on the other and economic progress is generally associated with certain distinct necessary and predicable changes in occupational structure. Fisher also reached the same conclusion, we may prefer in every progressive economy there has been a study shift of employment and investment from primary activities of all kinds and to a still greater extent into tertiary production. In our country namely India, occupational distribution of population steadily changes in favor of the industrial sector and services. This happens as the result of decline in importance of agriculture sector and transfer to other sectors.
Working Population of Jammu and Kashmir
The number of working persons constitutes the working population of the country. It depends upon many factors such as age composition, sex composition, life expectancy, definition of worker’s attitude towards work, availability of work etc; hence these factors are different in different regions of a same country and over time. The proportion of population engaged in economic activity is called work participate rate.
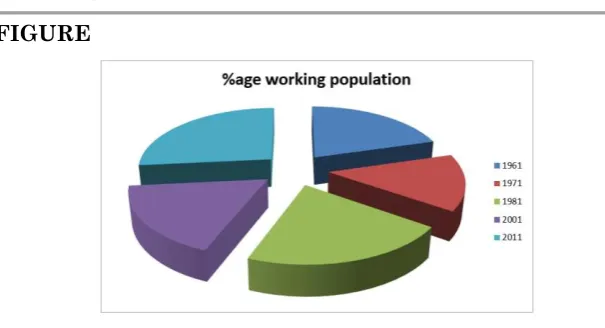
Table: Working Growth Rates of J & K
Year Total population Total workers %age working population
1961 3560975 1523621 42.7
1971 4616632 1373901 29.75
1981 5987389 2650044 44.3
2001 10069917 3688875 36.6
2011 12548926 6961637 55.47
Source: Compiled Form Census of India.
FIGURE
Decadal Sectoral Occupational Structure
The present occupational structure clearly reflects the backwardness in J&K economy. We shall now examine whether occupational distribution of labor force has changed since 1961. We notice that since 1961 until now agriculture remains the main occupation of the people. The sect oral occupation of different sectors is given below in table.
Table: Sect oral Occupational Structure (percentage)
Occupation 1961 1971 1981 2001 2011
Primary 78.6 71.55 64.04 50.1 45.1%
Secondary 9.03 8.94 14.07 6.2 8.4%
Tertiary 12.35 18.10 21.45 43.7 49.2%
Source: Compiled Census of India.
Figure
Primary Survey of District Kupwara in view of Employment Pattern
Keeping the above facts in view, an attempt is made to examine the magnitude of employment pattern in block Kupwara of district Kupwara. Initially a part of Baramulla district in July 1979 it was carved out as a separate district. The geographical area of district is 2379 sq. kms. The district is flanked in the east and south by Baramulla district and in the west and north by Actual Line of Control (ALC) separating it from Muzafarabad district presently under the illegal occupation of Pakistan. It is located about 90 Kms from Srinagar in the north-west corner of Kashmir Valley. Kishanganga is the main river, originating from Himalayan range that flows through the outer north-west areas of district from east to west. It passes through Keran-Teetwal and finally joins Jhelum River at Domel in Muzafarabad district of Pakistan.
Community Development Blocks namely Kupwara, Sogam, Trehgam and Karalpora among which Kupwara block which also happens to be one of its blocks. Kupwara block is lying towards the west of district. Mainly the people are engaged in cultivation and tertiary activities. Cultivation of rice and maize and business activities occupies highest place. As per the data collected from District Statistics and Evaluation Office Kupwara, Kupwara Zone (hence block) consists of 34 villages with population of 395159 (207306 males and 187853 females). Since the present study has been under taken to assess the configuration of employment pattern among population of block Kupwara, therefore a two stage survey was conducted. In the first stage, approximately 6% sample i.e; two villages namely Halmat Pora and Soolkoot having good number of workers i.e; working being engaged in economic activity were selected through purposive sampling. The total number of households in village Halmat Pora happened to be 636 with total population of 5226 (2495 males and 2731 females) and in village Soolkoot there was 400 households with a total population of 4600 (2823 males and 1777 females) respectively. After selection of sample, a door to door survey i.e. census of these two villages was conducted to collected and complete information about occupation of people. During this survey, all relevant information was gathered from 1036 households. The main objective of this survey is to find out employment pattern of the area.
34 villages namely Manigah, Lashdat, Teker, Buhi Pora, and Gulgam were selected for second stage survey. The total number of households village-wise in above 05 villages on 10% sampling are 873 (87) (Manigah), 45 (4) (Lashdat), 203 (20) (Teker), 259 (25) (Buhipora) and 1292 (129) (Gulgam) being 2672 households in total with population of 18869 (265) (9691 males and 9178 females). After selection of sample villages, again 15% households in each village were selected through random sampling method. Besides this, a questionnaire was prepared for these 15% households in each village so as to get a complete data of pattern. Data collected from both primary as well as secondary sources is analyzed, classified and tabulated for making further analysis in consonance with the objectives and hypothesis of the study.
Table: Survey and Census of two villages of block Kupwara namely Halmat Pora and Soolkoot during 2012.
Place Halmat Pora Soolkoot
Household 636 400
Total Population 5226 4600
Male 2495 2823
Female 2731 1777
Agriculture and Forestry 783 547
Manufacturing 22 78
Electricity, gas and water supply
64 98
Construction 87 68
Wholesale and retail trade; repair of motor vehicles, motorcycles and personal and household goods
83 95
Hotels and restaurants 13 58
Education Service 68 67
Transport , storage and communications
76 88
Financial intermediation 18 38
Health Service 27 61
Real estate, renting and business activities
165 206
Public administration and defence; compulsory social security
679 405
Other services 46 94
Total working Population 2131 1793
Source: Field Study
Working population of Villages:
Total working population × 100 Total population
Halmat pora : 213100/5226= 40.77, Sulkoot: 179300/4600= 38.97
Table: Sect oral Distribution of Employment in Different Sectors
Place HH Total popu
M F Primary
Table: Results obtained from Sampling Method (10% Sampling) of five villages out of 34 villages of block Kupwara.
Place HH Total Pop
M F Primary Sectors
Secondary Sectors
Tertiary Sectors
Others Manigah 87 624 343 343 67.32% 3.64% 28.32% ---- Lashdat 4 23 12 11 64.15% 5.07% 31.85% ---- Gulgam 129 875 433 442 46.44% 12.54% 42.76% --- Teker 20 173 81 92 17.65% 7.43% 74.32% --- Buhipora 25 189 98 91 30.04% 11.40% 59.82% --- Total 265 1884 967 917 45.58% 8.01% 47.14%
Source: Field Study
The village Manigah is the leading one in case of primary sector and constituted 67.32% and Teker is top i.e. 74.32% employed in tertiary sector followed by Bohipora due to their market expansion. After this, 15% households in each village have been selected randomly through a questionnaire. The information collected from these household selected through census and sampling methods has been put to various tests. The results are almost same which justifies the findings of sampling method indicating that sample chosen is representing whole universe, and what is true of this sample is true of whole population of the block and district as well.
From the above chapter by analyses we observe that there are some diversifying trends in the occupational pattern of Jammu and Kashmir. Occupational pattern of the state has shifted from agricultural sector to non-agricultural sector that shows us the good path of development on the one hand and agricultural backwardness on the other. For the sustainable development of the state it is necessary that agricultural sector of the economy should be developed which can give support to both manufacturing as well as service sector of an economy.
Conclusion
By way of conclusion we can say that one of the basic characteristics of under developed economies is that it is a primary producing economy. A very high proportion of working population is engaged in agriculture which contributes a very large share in the national income. In Jammu and Kashmir economy about 75 percent of the population derives its livelihood directly and indirectly from the agricultural sector. It is evident that the proportion of population engaging agriculture in developed economies is much more less than the proportion of population engaged in agriculture in under developed economies like ours Jammu and Kashmir economy.
BIBLIOGRAPHY
Bhattacharya, B. B (1997), “Changing Composition of Employment in Tertiary Sector”, Economic and Political Weekly March 15.
Government of India, Planning Commission, Ninth Five Year Plan (1997-2002).
Government of Jammu and Kashmir (2006), Household Hold Survey-Department of Education, Jammu and Kashmir. Gupta, S.P (1990), “Employment and Unemployment”,
Population Growth and the Problem of Unemployment, Pp. 293. Anmol Publication Pvt. Limited, New Dehli-110012
Gupta, S.P (1999), “Employment and Unemployment”. Anmol Publication Pvt. Limited, New Dehli-110012.
Mehra, S. (1996), “Surplus Labor in Indian Agriculture”, India Economic Review vol.1, April, p 144.
Mishra, S.K and Puri, V.K (2004), “Trends and structure of employment-unemployment”, P-182, Indian Economy, 22th Edition, Himalayan Publishing House, Ansari Road, Darya Ganj, New Dehli-110002.
National Sample Survey Organization (2004-2005): “Employment and Unemployment Situation in India”. 61TH Round. Report No. 515, Government of India.
Nisar Ali (2007), “How Chronic is Chronic Unemployment in Jammu and Kashmir”, Daily Local Newspaper, Greater Kashmir, 24/9/2007. Www. Greaterkashmir.com
NSSO 64TH Round (July 2007-June 2008), “Instruction to Field Staff-Designs, Concepts, Definitions and Procedures”- Socio-Economic Survey. Minister of Statistics and program Implementation, Government of India, Vol.-I, June 2007.
Planning Commission, (1992), “Employment, Past Trends and Future Prospects”, New Delhi.
Singh C.S.K (2003), “Skill education and Employment”, Economic and Political Weekly Aug. pp 32-75.
Sofi, B. and Yasmeen, E. (2011), “Magnitude of Educated Unemployment among Rural Youth of Jammu and Kashmir”, International Journal of Educational Research and Technology. Vol.2, Issue 2, December 2011: 126 – 132.