ISSN 2286-4822 www.euacademic.org
Impact Factor: 3.1 (UIF) DRJI Value: 5.9 (B+)
Climate Change and Agriculture Production in
India
SURENDRA SINGH SANATAN NAYAK
Research Scholar Department of Economics Babasaheb Bhimrao Ambedkar University Lucknow India
Abstract:
By using the secondary data, this paper tries to link climatic factors such as temperature & rainfall with production and productivity of major crops in India during 1951-2010. There has been increasing fluctuations in rainfall data over the study period. Regional instability in rainfall trends reflects close relationship between agriculture production and rainfall distribution. Declining trends in mean rainfall and in agriculture productivity observed throughout the study period. Imbalance use of fertilizers and pesticides, further have responsible factors for decline soil fertility. Subsidy in agriculture has further prompt these trends. Furthermore, increasing trends in day and night temperatures are also affecting the rainfall patterns which further prompt the frequent drought and floods in the country. Moreover, declining land holding size has becoming vulnerable to farmers in changing climatic conditions. Year to year variations in rainfall, temperature and agriculture production & productivity have been also observed during 1995-96 to 2010-2011*. Farmers have been changing their cropping pattern as rationale producer from pulses to food grains which have most responsible reason for food inflation.
1.0 Introduction
Although agriculture now accounts for only 14 per cent of Gross Domestic Product (GDP) which is continuously showing declining trends but it is still the main source of livelihood for the majority of the rural population in India (12th Plan document Vol. II, Pp. 10). As such rapid growth of agriculture is critical for inclusiveness; important structural changes are taking place within the sector. Rural labourers are shifting to non-agricultural work, tightening the labour market in agriculture and putting pressure on farm wages. However, dependence on agriculture remains unchanged among the rural self-employed, whose average farm size continues to decline with the population growth (Agriculture Census, 2005-06). This is also an ageing, more feminized population, whose educated young members are less likely to want to stay in farming (NSSO, 2012). Although, due to green revolution, agriculture sector has been represents tremendous growth but last two decades its growth is not significant. In some crops cases, it has been reported negative trends. However, these trends were not for all crops & cropping seasons but season to season it is showing. In general, agriculture production is reporting nominal growth rate with up and down trends (Ministry of Agriculture, 2013, P.1).
20th century and the warming has been particularly marked
since the 1970s. Each of the last three decades have been significantly warmer than all preceding decades since 1850s (IPCC, 2012). Basically, due to, uses of non-renewable resources to full fill energy demand, increase volume of Green House Gases, which are increases levels of temperatures (IMD, 2012, p 1; IPCC, 2012). Second, changes in land use pattern. Due to, economic development & increasing population are requiring resources for their survival. However, resources have in limited in stock. Urbanization at massive level, deforestation for infrastructure development and farming is changing hydrological cycle of mother Earth and becoming warmer. Last, industrial aerosols, recently it is find out that industrial aerosol also playing a key role in climate change (IPCC, 2012). Basically they are responsible for acid rain action. When industrial aerosols have releases in an environment bring with some hazardous gases (GHGs) which are makes reaction each other and results shown in form of acid rain (IPCC, 2012).
In addition, fluctuations in climatic factors viz. rainfall and temperature, elevated level of carbon dioxide, further have increasing frequencies of climatic disasters like floods, droughts and cyclonic activities in all over Indian sub-continent and adversely affecting agriculture production. However, improved irrigation facilities, highly genetically modified seeds and increases amount of fertilizers and pesticides have restricted negative trends but imbalance use of fertilizers and pesticides have further major responsible reason for declining soil fertility.
1.1 Objective & Methodology
productivity. Descriptive tools & regression analysis have used. In last, study has covered 1951 to 2010 period in keep in mind of green revolution effect. Moreover, study is keeping in mind of twelfth five year plan document recommendations regarding assessment of data.
1.2 Results and discussion
This is general assumption that agriculture growth trends have reveals increasing trends after adopting green revolution policy. Basically this assumption is restricted within one or two crops and there are shifting trends have been observed from pulses to food grains (Twelfth Five Year Plan Document, Vol. II, Pp. 10).
1.2.1 Growth in Agriculture
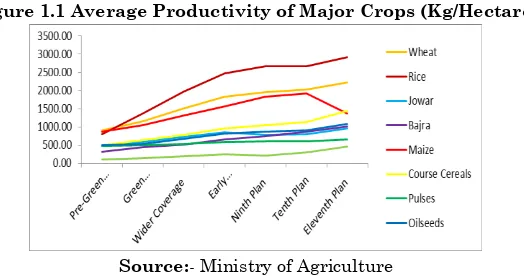
Since first policy plan, policy makers have given their attention on primary sector (Agriculture) because more than half population was lived in rural areas and whereas agriculture was main source of employment and livelihoods (Plan Document, 1951-56, P. 1). Therefore, agriculture has been reported tremendous growth trends which are continue more rapidly after green revolution (Figure 1.1). Mostly food grains and within food grains category wheat and rice crops were received more and pulses and other categories were received less attention.
Figure 1.1 Average Productivity of Major Crops (Kg/Hectare)
However, Hanumantha rao et al., (1988) argue that there was no significant change in growth rate with the green revolution because change in growth rate of wheat was enhanced by new technology, that of the several other food crops decreased.
Table- 1.1 Period averages of annual growth rates of Major Crops
Crops Pre-Green
Revolution (1951-52 to 1967-68)
Green Revolution (1968-69 to 1980-81)
Wider Coverage (1981-82 to 1990-91) Early Liberalization (1991-92-97 Ninth Plan (1997-98 to 2001-2002)
Tenth Plan (2002-03 to 2006-07)
Eleventh Plan (2007-08 to 2011-12)
Wheat 3.7 3.3 3.6 2.8 0.7 -0.3 3
Rice 3.2 2.7 3 1.4 2.1 1.2 2.2
Jowar 3.4 2.9 3.2 1.3 0.2 2.1 3.1
Bajra 2.6 6.3 8.8 6.2 4.9 7.3 8.4
Maize 4.8 1.7 4.1 2.6 3.1 -0.2 6.5
Course
Cereals 2.6 1.5 3.1 4.3 1.3 1.7 7.3
Pulses 2.3 -0.2 2.3 1.9 -0.3 0.6 2.7
Oilseeds 1.3 0.8 4.8 3.3 0.4 3.5 5.4
Cotton 3 2.6 5.3 3.1 -6.2 19.4 3.9
Sugarcane 1.6 3.1 1.3 0.4 0.3 0.7 0.5
Source:- Twelfth Plan Document, Vol. II, Pp. 10
1.3 Land Use Pattern
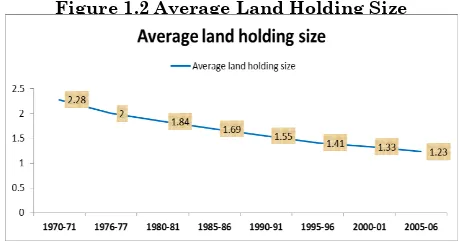
Land use pattern has important factor in agriculture production. Recent data has reveals that there is a decline trend in average land holding size (figure 1.2).
Figure 1.2 Average Land Holding Size
Source:- Statistic at Glance 2011-12, Ministry of Agriculture
During 1970-71 average land holding size was 2.28 which is now 1.23 with 1.05 decline trends. This was major decline trends putting pressure on farmers that on limited land increased their production to feed every mouth of growing population. Furthermore, study is tries to link agriculture production to environmental factors viz. rainfall and temperature. Therefore, same period rainfall and temperature trends also consider.
1.3.1Comparative Performance of Growth of GDP and Agri-GDP
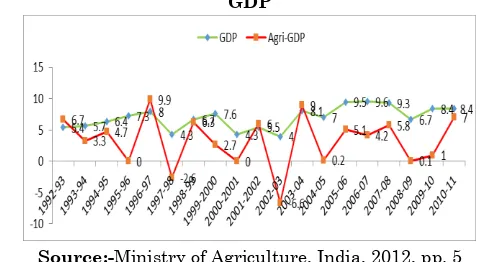
direction, during 1995-96, agriculture growth rate has been reported decreasing trends as compared to GDP with 0 & 7.3 percent.
Figure 1.3 Comparative Performance of Growth of GDP and Agri-GDP
Source:-Ministry of Agriculture, India, 2012, pp. 5
Basically that year monsoon rainfall was also reported deficit trends and it is generally accepted phenomenon that Indian agriculture as well GDP growth have strongly depends on South-West Monsoon water. Moreover, during 2002-03 agriculture gross domestic product has been reported -6.6 growth rate which was highest declined trends. Basically, reason behind was -23 percent deficit in all India rainfall distribution. However, national gross domestic product growth rate has been shows positive trends with 4 percent growth rate because of better performance of industrial and service sectors. In figure-1.3 among the growth trends wide fluctuation were reported. In sum, declined trends in size of land holding, erratic nature of South-West Monsoon, increasing minimum & maximum trends in temperature and less investment have some responsible factors.
1.4 Environmental Factors
temperature and rainfall affects on production. However, others are majorly affecting worldwide (IPCC, 2012).
1.4.1 Rainfall distribution in India
Rainfall has main input for agriculture production in India where now 60 percent farming is under rain-fed area. All India annual rainfall trends shows that rainfall has restricted within four month June-September (figure 1.4). However, regional level trends not follow all India scenarios (IMD Macro Data Set 1906-2006).
Figure 1.4 All India Rainfall Distribution
Source:- Indian Meteorological Department
Studies on rainfall distribution have been (NATCOM-I, 2006; NAPCC, 2008; Venakteswarlu, 2010; Gadgil & Gadgil, 2006 and Ramanathan et al., 2005) reveals that intensity of rainfall increasing and rainy days are decreasing all over India. Therefore, it is required more water in terms of irrigation and due to that water level has declining, further increasing cost of cultivation.
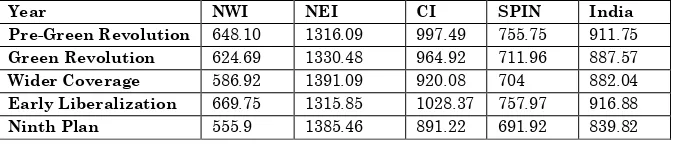
Table 1.2 Region Wise Mean Summer Monsoon Rainfall Distribution (cm)
Year NWI NEI CI SPIN India
Pre-Green Revolution 648.10 1316.09 997.49 755.75 911.75
Green Revolution 624.69 1330.48 964.92 711.96 887.57
Wider Coverage 586.92 1391.09 920.08 704 882.04
Early Liberalization 669.75 1315.85 1028.37 757.97 916.88
Tenth Plan 558.24 1243.68 1063.28 731.8 880.06
Eleventh Plan 563.94 1217.41 944.96 740.81 834.76
Source:- India Meteorological Department of India
In India, summer monsoon rainfall has an important role in India agriculture & allied Sectors. Therefore, any change has reveals wide impact on not only economic growth (agriculture production) but also on livelihood patterns. Mean rainfall distribution has reveals declining trends among the regions (table 1.2). In North West region rainfall has reported 648.10 CM during pre-green revolution period and in eleventh plan period; it has reported only 563.94 which was 84.15 CM less. In north east region it was around 99 CM and all India level 76.99 CM less. Moreover, monsoon has changed in two significant ways during the past half century. It has weakened (less total rainfall during June- September) and distribution of rainfall within the monsoon season has become more extreme. During same time period (1951–2000), the frequency of heavy and very heavy rain events in central India increased by nearly 50 percent and more than 100 percent, respectively. While the frequency of moderate events decreased by about 10 percent (Goswami et al., 2006).
1.4.2 Temperature
Temperate also has important factor in agriculture production and it has proofed during 2004 heat waves incident. Due to heat waves incident wheat crop not only affected in low yield areas but also affected high yield areas (IARI, 2004). Day and night temperatures trends at all India level have been reveals increasing trends and confirmed IPCC predictions about south Asian countries (table 1.3).
Table 1.3 Minimum and Maximum Temperature trends
Period Minimum Maximum
Pre-Green Revolution 23.23 31.07
Green Revolution 22.99 31.28
Early Liberalization 23.44 31.51
Ninth Plan 23.38 31.64
Tenth Plan 23.45 31.63
Eleventh Plan 23.54 31.65
Source:- India Meteorological Department of India
Table 1.3 reveals minimum and maximum temperature, during pre-green revolution period it was 23.23 & 31.07 but during eleventh plan it was slightly increased to 23.54 & 31.65 degree centigrade. In numbers, it is just a matter of 0.31 & 0.58 but in terms of agri-production has an importance because as studies predicted that wheat crop (Samuel C., 2007) in Northern Indian states such as Utter Pradesh, Punjab, Haryana, Uttrakhand and Himachal Pradesh affected by increasing trends of temperatures. Wheat output could plunge by 6 million tones with every 1OC rise in temperature (Samuel C., 2007). An
increase 0.05OC in winter temperature would reduced wheat
duration by seven days and reduced yield by 0.45t/ha (Sinha and Swaminathan, 1991). Further, (Singh and Sonatakke, 2002), While the mean air temperatures recorded over the wheat growing regions in northern India were high by 1.7OC
over the period of 15 days (January 16 to February 1); the actual temperature rise was of the order of 2.4 to 4OC in the
major producing region of Punjab and Haryana during (1991-2000).
1.5 Fertilizers & Pesticides Consumption and Environment
consumption of various fertilizers than the recommended quantity or ratio leads to polluting the soil, which ultimately causes the decline of productivity of various crops and further also contaminated ground water (Dev, 1987). Imbalanced used of fertilizers has responsible for green house gas emission. Excess use of nitrogenous fertilizer like Urea which is available at subsidized rate in India is responsible for Ammonia Volatilization. Volatilization of NH3 is not only a major loss of N but also a cause of environmental pollution. Moreover, Rao (1994) found that the major source of environmental degradation in rural areas is misapplication of yield increasing inputs like water, chemical fertilizers and pesticides causing water logging, salinity and pollution of drinking water loss of fish etc. however, chemicalisation of agriculture may pose a greater threat to the rural economy at much higher levels of application of chemical fertilizers and pesticides.
Figure 1.5 Fertilizers Consumption in India
(A) (B) Source:- The Fertilizers Association of India
during pre-green revolution period consumption was 2.13 Kg/Hectare and it was reached 80.75 Kg/Hectare during eleventh plan, it was 40 folds. The basic reason behind this Consumption pattern was government subsidy on nitro based fertilizer and same trends have been observed in case of Potassium and Phosphate. Furthermore, Due to introduction of concession scheme on decontrolled Phosphatic and Potassic fertilizers in 1992-93, fertilizer consumption started picking up and reached a level of 59.45, 22.72 and 8.08 Kg/hectare during ninth plan period. Moreover, In order to fix the balanced use of nitrogen (N), Phosphorous (P), and Potassium (K), the standard suitable mix of NPK has been estimated at all India level by keeping the soil, climatic conditions, cropping pattern and other variable into consideration. Accordingly, the suitable mix of NPK in the country is 4:2:1 (GoI, 2000-01). However, it is also depends regions to region in India where large diversification is exist. On the basis of this suitable mix (figure 1.5b) reveal that there is showing high consumption of nitrogen based fertilizers and other categorise also showing nominal increasing trends.
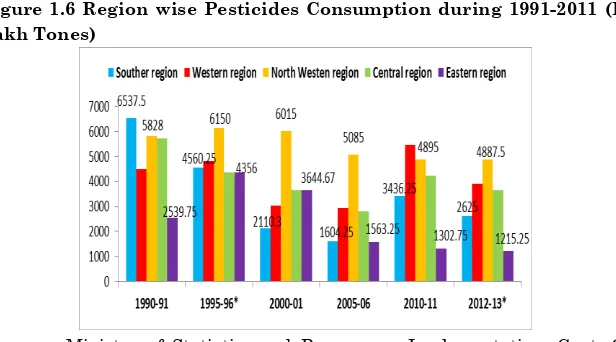
Figure 1.6 Region wise Pesticides Consumption during 1991-2011 (In Lakh Tones)
Source:- Ministry of Statistics and Programme Implementation, Govt. Of India, 2013
al., 2007). Pest-crop interaction is much sensitive. Chemical pesticides use is also associated with health hazards if not handled properly. Improper handling and unsafe spraying of the agrochemicals cause high risk of health hazards (Gupta, 2004). Increase in the use of chemicals as pesticides can result in various health and environmental problems like pesticides poisoning of farmers and farm works, cardiopulmonary, neurological and skin disorders, fetal deformities, miscarriages, lowering the sperm count of applicators, etc. (Bag, 2000). It all began with green revolution, which saw indiscriminate use of chemical fertilizers and pesticides. It left behind enormous toxic loads of contaminants in the environment, which eventually found their way into humans through the food chain (Rangrajan, 2001). Moreover, the promotion of high yielding varieties that marked the green revolution has led to large scale use of chemicals as pesticides.
In addition, Figure 1.6 reveals region wise pesticides consumption after economic reforms period. As figure shows that during 1990-91 southern region was high consuming region further, these trends moves toward southern region to north western region. In 1995-96 north western region became high consuming region and this trend has been continuing throughout study period. However, after 1995-96 western and eastern regions also reveal increasing trends which are closely associated with cost of cultivation.
1.6 Year to year Variations in Rainfall and Agriculture Production
Figure 1.7 Rice crop production, productivity and percentage change in Summer Monsoon Rainfall
Source:-Agriculture Statistics at a Glance, 2012, Directorate of Economics, Ministry of Agriculture, Govt. of India, Note:-Base year is taken (1993-94=100)
In the year 2000-01 rainfall reported with -7 percent deficit affected to both production and productivity. Furthermore, 2002-03 monsoon came with -19.2 percent concretely affected rice production to -23.1 percent. It was highest deficit in study period. Moreover, negative trends further continue in 2004-05. In addition, deficit trends do not restricted one or two crops, it was observed throughout the cropping periods. Figure (1.7) reveals that how to rainfall affected production of principles crops production.
Figure 1.8 Year to year variation in Principle Crops and Summer Monsoon Rainfall distribution
Source:-Agriculture Statistics at a Glance, 2012, Directorate of Economics, Ministry of
Figure 1.8 has covered total cereals, pulses and food grains production. Although rainfall was affected agri-production throughout study period but it has restricted within cereals and food grains. In case of pulses, which are generally grown in rain0fed areas does not concretely affected to rainfall because of they are required less attention. However, increasing trends of temperatures further responsible for declining trends in pulses. Therefore farmers are moving towards pulses to food grains. In addition, 2000-01, deficit monsoon largely affected to total pulses than food grains and cereals. Further, 2002-03 total cereals and food grains reported deficit trends in correspondence to rainfall. Again trends have repeated in 2005-06 and 2009-10 in correspondence to rainfall. However, other input factors call biotic and a biotic (fertilizers, pesticides, temperature, soil quality, labourers, droughts and floods) we cannot ignored in relation of agriculture production.
1.8 Conclusion
low public investment and food security needs; it increased centers spending on these particularly in disadvantaged regions. Fourth, noting farmer’s distress, it tried to focus not just on production but also on farm incomes. In last, Stressing service delivery and suggesting encouragement of group activity with land and tenancy reforms put back on the agenda. Compared to the origin green revolution that built on the best, this strategy sought to deliver faster growth, that is, more inclusive more stable and less centralized.
REFERENCES
Bag D. (2000) “Pesticides and Health Risks”, EPW, Vol. 35 No. 38, Pp. 20-21.
Dev M (1987) “Growth and Instability in Food grains Production: A Inter-State Analysis, EPW, Vol. 22, No.39. Gadgil S. and Siddhartha G. (2006) “The Indian Monsoon, GDP
and Agriculture”, EPW, Pp. 4887-4895.
Goswami B.N., V. Venugopal, D. Sengumpta, M.S. Madhusoodanan, Prince K. Xavier (2006) “Increasing Trend of Extreme Rain Events Over India in a Warming Environment”, Science, Vol. 314 No. 5804, Pp. 1442-1445.
GoI (2012) “Twelfth Five Year Plan Document”, Government of India, Vol. 2, Pp. 10-12.
GoI (1951) “First Five Year Plan Document”, Government of India, Vol. 2. Pp. 10-12.
GoI (2000-01) “Economic Survey 2001-2002”, Ministry of Finance, Economic Division, New Delhi.
Gupta P. (2004) “Pesticides Exposure- Indian Scene”, Journal of Technology, Vol. 198, No. (83), Pp. 118-119.
Hanumantha Rao, S.K. Ray and K. Subbarao (1998) “Unstable Agriculture and Droughts: Implications for Policy”, Vikas Publishing House, New Delhi.
IPCC (2012) “Summary of Policy Makers”, Intergovernmental Panel on Climate changes
IMD (2012) “Annual Report Indian” Meteorological Department of India, P.1
IMD (2006) empirical Data Base, http://www.imd.gov.in/, assess on 28/08/2014.
MoA (2013) “Agriculture at Glance”, Ministry of Agriculture MoA (2006) Agriculture Census data base 2005-06,
http://agcensus.dacnet.nic.in/ assess on 28/08/2014. NAPCC (2008) “National Action Plan on Climate change”,
Government of India.
NATCOM 1 (2006) “United Nations Framework on Climate change”, report for India.
NSSO (2012) “Employment & Unemployment and Household Consumer Expenditure”, 68th Round, National Sample
Survey Organization, Ministry of Statistics and Programme Implement.
Rao (1994) “Agricultural Growth, Rural Poverty and Environmental Degradation”, Oxford University Press, New Delhi.
Rangarajan R. (2001) “Tasting Toxic”, New Indian Express, 25 February
Samuel C. (2007) “Extreme climate risk”, The Hindustan Times”, accessed 17 December 2007.
Sinha A.K. and Swaminathan M.S. (1991) “Long-term Climate Variability and changes”, Journal of Indian Geographical Union”, Vol.7, No. (3), Pp.125-134.
V. Ramanathan, C.Chung, D.Kim, T. Bettge, L.Buja, J.T. Kiehl, W.M. Washington, Q.Fu, D.R. Sikka, and M.Wild (2005), “Atmospheric Brown Clouds: Impacts on South Asian Climate and Hydrological Cycle”, PNAS, April, 12.
Venakteswarlu B. and C.A. Ramarao (2010) “Rain-fed Agriculture: Challenges of Climate change”, Today Year Book, Pp. 43-45.