Automatic System for Differential Blood
Counting
Manisha Shirvoikar1, Dr.H.G.Virani2
PG Student [ECI], Dept. of ETC, Goa College of Engineering, Ponda, Goa, India1
Professor & Head of Department, Dept. of ETC, Goa College of Engineering, Ponda, Goa, India2
ABSTRACT: For detecting various diseases, Doctor first suggests the patient to undergo blood test which is used as a health indicator. Differential Blood Count (DBC) provides haematologist with valuable information about health of the patient. DBC determines the percentage of types of WBC this is important because it give exact count of five types of WBC such as neutrophil, lymphocyte, monocyte, eosinophil and basophile. Increase or decrease of DBC than the ideal count indicated that our body is not healthy. Precise counting of type of WBC is very important. Manual counting of White blood cells is time consuming and can lead to human error with increase in number of samples. Automatic cell counter sometimes misclassifies the cells having different morphology. Even they are very expensive and unaffordable by remote area health centres and hospitals. These problems are overcome by developing a system which is image based, cost effective, fast and accurate which has the capability to identify, classify the different type of white blood cell and perform DBC. Implementation is done using MATLABR2014b.
KEYWORDS: MATLAB, peripheral blood smear, RBC, Thresholding, WBC, DBC.
I.INTRODUCTION
Total volume of blood in human is 5-6 litres i.e 8% of body weight or 80 mL/kg body weight. It consists of three types of blood cells: Red blood cell (RBC), White blood cell (WBC) and platelets. Production of these cells is inside the bone marrow in hematopoietic stem cells. Once these cells are matured they are released into the body and perform their own function.WBCs are again classified into five different cell classes called Neutrophils, Lymphocyte, Monocyte, Basophil and Eosinophil.
Neutrophil, Basophil and Eosinophil lies in Granulocyte category while Lymphocyte and Monocyte belongs to Agranulocyte category. WBC having granules in their cytoplasm are categorized into Granulocyte while those lack granules in their cytoplasm is categorized into Agranulocyte.
Different types of WBC are distinguished from other cells based on their color, size and shape. Monocyte is the largest WBC, while the lymphocyte is the smallest among five type of WBC.
Differential blood count provides information about the percentage of each type of blood cells. When suspicious abnormality found in blood smear manual microscopic evaluation is essential. From peripheral blood smear while performing differential blood count the lab technician has to count one hundred cells. As the number of samples increases manual microscopic evaluation of blood sample is very tedious and time consuming and can lead to error so there is need for requirement of expert lab technicians. Automatic analysers performing DBC are available which are based on blood sample and counts cells with the help of sensors that are installed in the machine tubing, these machines are costly and not affordable by remote area hospitals and sometimes it misclassify the cell and cannot detect irregularities in shapes and sizes of cell.
II. LITERATURE REVIEW
Goal of DBC is to count type of WBC from peripheral blood smear which requires proper segmentation of blood cells from the complicated background.
ArivuSelvan et.al.[1] proposed an algorithm for segmentation of RBC and WBC. They also proposed an algorithm for counting of RBC and WBC.
PoojaPatil et.al.[2] proposed an overview of different segmentation method such as Thresholding ,edge based method and region based method and the features of the nucleus were extracted.
P.S.Hiremath et al. [3] developed a method based on the histogram equalization, edge detection and Thresholding which was used for automatic segmentation, identification and classification of white blood cells. They worked on only three cells neutrophil, lymphocyte and monocyte. To identify and classify white blood cells geometrical features were used. Different combination of geometric features where tested for classification.
Gaganjit et.al [4]developed a system for detection of leukemia, they also calculated blood cell ratio. Total numbers of cells in a given image are counted by using convex hull technique.
Ongun et al. [5] proposed a method which segmented the white blood cell using active contour model (snakes and balloons). For classification purpose Shape based and texture based features were used.
Chhaya et.al. [6] developed a method for segmentation and classifications of RBCs and WBCs, The algorithm used k-nearest neighbor algorithm for classification .It has a drawback that high sensitivity makes the classifier susceptible to noise in training data.
Cao et al. [7] proposed an algorithm that detected red blood cells in urine image. Hough transform which was used for localization of Red blood cells in urine image. Principal Component analysis (PCA) is used for feature Extraction than Linear Discriminant Analysis (LDA) classified the cells.
Thejashwini M et al. [8] presented an approach which is based on circular Hough transform and Thresholding for WBC and RBC counting. Results where obtain from 3 blood samples which resulted an accuracy of 93.1%.
FarnooshSadeghian et al. [9] proposed a method for segmentation of WBC. Using morphological operations nucleus was segmented and cytoplasm was segmented from using pixel intensity thresholding. The proposed method gives result accuracy of 92% and 78% for nucleus and cytoplasm segmentation respectively. Limitation of proposed method, implementation was done on sub images.
III.PROPOSED ALGORITHM
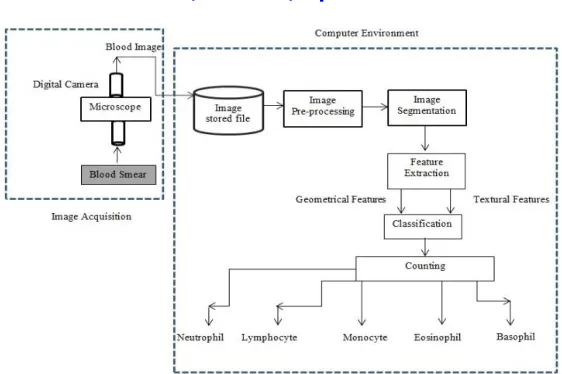
Fig. 1 Block Diagram representing Overall Process
Image Acquisition
Blood samples from the patients are collected from pathology Department at Goa Medical College and Hospital. Images are captured from peripheral blood smear images with varying intensities, background. Different sizes and stained images conditions are also considered.
A) Segmentation Algorithm:
For proper segmentation following algorithm steps should be followed:
1) Input the captured image followed by resizing.
2) Convert resized color image to gray scaled image.
3) Apply linear contrast stretching on gray scaled image to enhance the contrast of an image, resulting (C).
4) Apply histogram Equalization on the gray scaled image, which results (H).
5) Create an image A1 that brightens all components in an image except the nucleus, this is done by adding
results obtained in step 3 and 4.
6) Next Image A2 is created to highlight all objects in an image this is obtained by subtracting resultant image A1 from H.
7) In order to obtain only the nucleus area and remove all the other components ,add resultant image A1 and
A2 obtained in step (5)and (6) respectively ,this operation will results in image denoted as A3.
8) Small unwanted area still remains in image A3 which are removed using 3 x 3 minimum filter.
9) Next to convert to binary image use Global Thresholding.
10) Morphological operations such as opening are performed on binary image, followed by finding connected
objects.
11) Area less than 1200 pixels are eliminated obtaining only WBC nucleus.
Below are the results obtained from segmentationprocess.
Proposed segmented result:
(b) Lymphocyte
(c)Monocyte
(d) Eosinophil
(e) Basophil
Fig. 2Segmented images
Feature Extractions:
Features of segmented nucleus image are used to identify and classify the WBC obtained in step 11. Features such as geometrical and textural features are computed. Geometrical feature are based on binary image while textural features are based on gray scale image. Geometrical Features such as Area, perimeter, roundness, and Error, Number of nucleus lobes are found. Textural feature such as Entropy is calculated using GLCM. Total of 6 features: 5 geometrical and 1 textural features are calculated.
Convex hull property: ’Error’
Convex hull image of the segmented nucleus is found. Than the segmented image and convex hull image is cropped,bysubtracting this two image if it contains no object than the segmented object is said to be circular and the feature such as ‘Error’ is calculated.
Area:it calculates the actual number of pixels in the region.
Roundness:this feature indicates the shape of WBCs. Monocyte have higher value range of this feature compare to lymphocyte in agranulocyte category. While eosinophil have higher value range in Granulocyte category.
Number of lobes:number of lobes in nucleus is found .Number of lobes greater or equal to two are considered as feature for neutrophil. Lobes in basophil and eosinophil are not considered due to invisibility of lobes because of presence of dense granules.
Entropy:measures the non-uniformity in the image. This feature is measured on gray scaled image.
B) Algorithm for classification of blood cell(leukocytes)
I. Training phase:
Step 1)the segmented binary image obtained from step 11 is labelled. The geometrical features (such as Area, perimeter, Roundness, error, number of lobes) and textural features such as (entropy) are computed and stored them. Step 2)Let f representing nth parameter,where n corresponds to the features extracted i.e. n=1,2,3,4,5,6corresponding to roundness, perimeter, area, Error , entropy and number of nucleus lobes respectively while k represents type of WBC, forkth class where k=1,2,3,4,5 which is Monocyte,Basophil, Eosinophil , Neutrophil and Lymphocyte, respectively. Repeat this step for all training images.
Step 3)Calculate the minimum and maximum values of features for each type of WBC given by f and f , for
all n and k and store them.
II. Testing phase:
Step 4)than for classification following step is performed if f lies in the range of [f , f ],for n=1,2,3,4,5,6then
the cell belongs to kth class where k=1,2,3,4,5 which corresponds to Monocyte, Basophil,Eosinophil,Neutrophil, and Lymphocyte, respectively.
Step 5)Repeat the steps from step 1 to 4 in classification algorithm for all the labeled segmented cells to identify and classify the cells for performing differential blood cell counting.
C) Differential blood counting:
Loop instruction in MATLABR2014 is efficient. So making best use of this ‘for loop’ for counting of types of WBC is used. A Folder containing 100 cell images of individual patient is read one after the other continuously. At the Beginning the individual cell counters for each cells type such as lymphocyte, monocyte, basophil, neutrophil and eosinophil are set to zero. If the type of WBC is identified then the corresponding cell counter is incremented by 1. The counter stops once all the 100 cell images in the folder are read and outputs DBC result in the form of percentage of each type of blood cells.
IV. RESULT& GRAPHS
This paper shows segmentation of types of WBC. Classifications of different type of WBCs are done without using classifiers which accurately classifies cells for performing Differential Blood Count (DBC). Total number of images tested is 600.Manual counting report is considered as the reference for proposed and machine count.
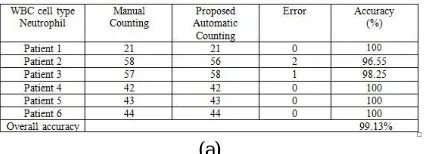
Table 1: Comparison between (a) Manual and proposed Automatic Counting (b)Manual and machine counting of Differential blood cell for Neutrophil cell.
(b)
From table 1 (a) & (b)it can be seen that proposed Automatic count for Neutrophil shows counting result accuracy greater than that of machine count when manual counting result is considered as the reference.
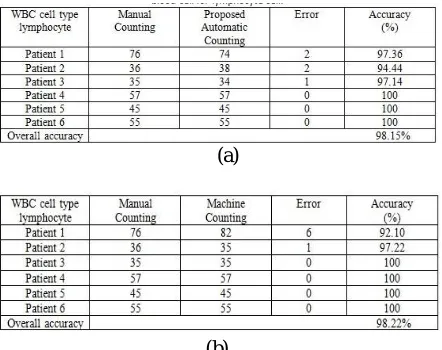
Table 2: Comparison between (a) Manual and proposed Automatic Counting.(b)Manual and machine Counting of Differential blood cell for lymphocyte cell.
(a)
(b)
From table 2 (a) & (b) machine countis almost close to manual count for lymphocyte cell and shows accuracy slight greater than proposed Algorithm.
Table 3:Comparison between (a) Manual and proposed Automatic Counting (b)Manual and machine counting of Differential blood cell for Monocyte cell.
(a)
(b)
Table 4: Comparison between(a) Manual and proposed Automaticcounting (b)Manual and machine counting of Differential blood cell for Eosinophil cell.
(a)
(b)
From table 4 (a) & (b) for Eosinophil cell proposed count shows overall accuracy greater than that of Machine Count.
Table 5: Comparison between(a) Manual, proposed automatic countingand machine counting of Differential blood cell for Basophil cell.
(a)
From table 5 (a) & (b) proposed and machine count shows accurate counting result without any error with reference to manual count.
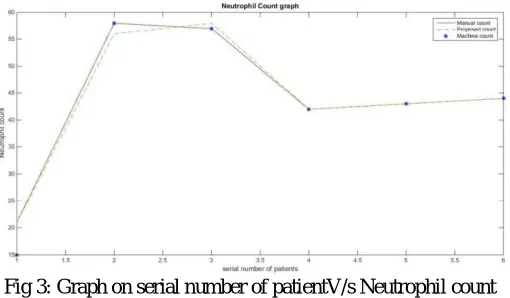
Fig 3: Graph on serial number of patientV/s Neutrophil count
Fig 4: Graph on serial number of patientV/s Lymphocyte count
In the fig 4, it shows the graph of Lymphocyte count V/s serial number of the patients. Comparison of manual, automatic and machine counts corresponding to different patients are show in graph. Automatic and machine counting result shows close result to manual result.
Fig 5:Graph on serial number of patientV/s Monocyte count
In the fig 5, it shows the graph of serial number of the patientsV/sMonocyte count. Comparison of manual, automatic and machine counts corresponding to different patients are shown in graph. Automatic and machine count slightly deviates from manual reference count.
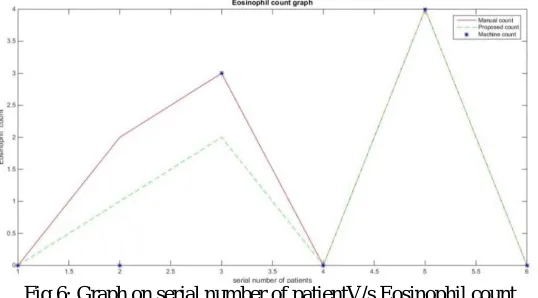
In the fig 6, it shows the graph ofserial number of the patientsV/sEosinophil count. Comparison of manual, automatic and machine counts corresponding to different patients are show in graph.
Fig7: Graph on serial number of patientV/s Basophil count
In the fig 7, it shows the graph ofserial number of the patientsV/sBasophil count. Comparison of manual, automatic and machine counts corresponding to different patients are shown. Automatic and machine count result accurately follows the manual count.
V.CONCLUSION
A fast, accurate and efficient differential blood counting system was implemented which was able to count the percentage of each type of blood cells from peripheral blood smear.The algorithm was tested on database of 600blood cell images. The proposed algorithm shows DBC count which is close to manual counting report.Proposed methods have minimum error for counting compare to Machine count. For the proposed idea the average accuracy for neutrophil, lymphocyte, monocyte, Eosinophil and basophil count is 99.13%, 98.15%, 88.19%, 83.33% and 100%respectively which is higher than machine count. This method for identification and classification can be extended to leukemic cells.
REFERENCES
[1] ArivuSelvan K and SathiyaMorthy,"Analysis blood cell images to differentiate WBC and counting of linear & nonlinear overlapping RBC based on morphological features", Elixir International Journal Computer Science and Engineering, Vol.48 , pp.9410-9413, 2012.
[2] PoojaPatil and Ganesh Sable, “An Overview: Optimization of WBC and RBC from blood sample Based on Microscopic Images”, International Journal of Advance Research in Computer and Communication Engineering, Vol. 2, Issue 19, pp.4071-4076, 2013.
[3] P.S.Hiremath, P.Bannigidad, and SaiGeeta, “Automated Identification and classification of White blood cell in digital microscopic Images, Recent Trends in Image Processing and Pattern Recognition, Vol.2,pp.59-63,2010.
[4] Gaganjit Singh,Swarnalatha .P,Tripathy B.K. and SwethaKakani, “Convex Hull Based WBC Computation For Leukemiadetection”, International Journal of Advance Reaserch in Electrical ,Electronics and Instrumentation Engineering, Vol 2,Issue 5, pp.2320-3765,2013. [5] G. Ongun, U. Halici, K. Leblebicioglu and V. Atalay,"An Automated Differential Blood Count System," at 23rd Annual International
Conference of the IEEE Engineering in Medicine and Biology Society,pp.2538-2586, 2001.
[6] ChhayaS.Hinge,AartiG.Ambedkar and SamidhaS.Kulkarni, “Classification of RBC and WBC in peripheral Blood Smear Using KNN”,Vol 2, Issue1,pp.56-58,2013.
[7] G. Cao, C. Zhong, L. Li and J. Dong, "Detection of Red Blood Cell in Urine Micrograph," in 3rd International Conference on Bioinformatics and Biomedical Engineering, Vol.3,pp.1-4, 2009.
[8] Thejashwini M and M C Padma,’’ Counting of RBC’s and WBC’s Using Image processing Technique’’, International Journal on Recent and innovation trends in computing and communication, Vol 3, Issue 5,pp.2948-2953,2014.