Relationship between Body Mass Index, Blood Pressure and
Peak Expiratory Flow Rate in Muslim Females of Varanasi.
1Shaista Parveen, 2Archana Chakravarty and 3 N K Agrawal
1 Research Scholar, Department of Home science (Food and Nutrition), MMV, BHU, Varanasi.
Email- parveen87shaista@gmail.com
2 Professor, Department of Home science (Food and Nutrition), MMV, BHU, Varanasi.
Email- archana.nutrition@gmail.com
3 Professor, Department of Endocrinology and Metabolism, IMS, BHU, Varanasi.
Email- drnkavns@gmail.com
Abstract
The prevalence of obesity along with cardiovascular diseases and pulmonary dysfunction is increasing nowadays. Many studies have demonstrated the interplay between these three factors. Thus, the study was carried out to assess the relationship between body mass index (BMI), blood pressure (BP) and pulmonary expiration flow rate (PEFR) among 220 Muslim females of Varanasi. Body weight, height, BMI, PEFR, systolic blood pressure (SBP) and diastolic blood pressure (DBP) were assessed through standard methods.
Respondents aged 35-45 years had
significantly higher (P<0.001) BMI as compared with the groups 15-24 years and 25-34 years. Body mass index had a significant positive correlation with SBP (P<0.001) and DBP (P<0.001) while correlated positively but not significantly with PEFR (P>0.05).
Keywords: Females; BMI; SBP; DBP and PEFR.
1. Introduction
Body mass index (BMI) is one of the most important metric used for defining anthropometric characteristics (height and
weight) in adults. It is defined as weight (kg) divided by the square of height (m²) of an individual (Stamler, 1991) and correlates positively with body weight. The risk of developing obesity is more with the increase in body weight. Obesity in turn leads to the occurrence of many diseases like; type 2 diabetes mellitus (Colditz et al.,1990 ;Chan et al.,1994), cardiovascular disease (Lowder & Brown, 1975) and respiratory disorders (Zerah et al.,1993; Strolls & Rogers, 1996; Anil et al., 2014).Thus, it is widely used as a risk factor for the development or the prevalence of several health issues.
Weight gain is an important risk factor for the development of hypertension in the adult life (Goldstein, 1992; Pi-Sunyer, 1993; Bosello et al., 1997). Various studies have revealed that an increase in body weight, increased the tendency of development of cardiovascular disease (Friedman et al.,1988; Yong et al., 1993; Huang et al.,1998) and the relationship between body mass index and blood pressure has been well documented.
Pulmonary function is a complex
testing which is evolved as a clinical tool for diagnosis, management and follow up of respiratory diseases (Bandhopadhyay et al.,
2007; Bandyopadhyay, 2011;
Bandhopadhyay et al., 2013). PEFR that is defined as the largest expiratory flow rate achieved by maximally forced effort from a position of maximal expiration and it is expressed in litres/min, considered as the simplest tool of the pulmonary function indices for ventilator capacity assessment. It is useful in managing respiratory diseases, especially to differentiate between obstructive and restrictive respiratory diseases (Anil et al., 2014).
The thoracic cavity may be compressed by the truncal fat and restrict the diaphragmatic movement that results in reduced vertical diameter of the thoracic cavity (Onadeko et al., 1984). These may reduce the compliance of the lungs and the thoracic cavity that increase the load on the respiratory muscles. This may lead to reduction in lung volumes and flow rates, especially PEFR (Saraswathi et al., 2014; Joshi & Shah, 2016).
2. Materials and Methods
2.1 Subject Selection
This research was carried out on 220 Muslim females of age 15-45 years and was randomly selected from different wards of Varanasi.
2.2 Measurement of Body Weight and Height
Weight was recorded without shoes and with light clothes on a weighing machine. Standing height of each subject was taken with the subject standing erect against a height measurement metre rule placed
against the wall. The subject’s occiput, shoulders, buttocks and back of the heel were made to touch the wall with the subject looking forward.
2.3 Measurement of Blood Pressure
Blood pressure was measured using a
mercury sphygmomanometer (Novaphon
300, Bhasin Sons Pvt Ltd. Industrial Area, Delhi-110095). The reading was obtained thrice, and the average of the 3 measurements was used as the subject’s blood pressure. Readings were taken after the subjects had sat down and rested for 15-20 minutes.
2.4 Body Mass Index (BMI)
The BMI of each subject was obtained mathematically using the formula: BMI =
Body Weight (Kg) /Height²
(m²).Categorization of respondent is done on the basis of BMI for Asian countries in the present study (WHO Lancet, 2004).
BMI Classification
Underweight (<18.5 kg/m2)
Normal (18.5-22.9 kg/m2)
Overweight/Pre Obese ( 23-27.5 kg/m2)
2.5 Measurement of Peak Expiratory Flow Rate
Using peak flow meter PEFR was evaluated. The subjects were instructed to take maximum inspiration and blow into the mouthpiece as rapidly, forcefully and completely as possible. They were allowed to blow into the instrument maintaining a tight sealing between the lips and mouthpiece of the peak flow meter. Peak flow meter has three zones i.e., red, yellow and green that ranges as < 170, 170-680 and >680 L/min respectively.
2.6 Statistical Analysis
Results are presented as percentage, mean ± SD. Data analysis was done using SPSS version 16.0. One way analysis of variance (ANOVA), chi-square test and correlation coefficient were employed in this study.
3. Results and Discussion
The above table reveals that with the increase in age there is increment in body mass index as individual gain weight with age may be due to marriage, pregnancy, hormonal changes, sedentary lifestyle and other reasons. This increase in BMI with age is found significant (P< 0.001).
In Table 2(a) & (b) classification of respondent’s systolic and diastolic blood pressure has been done on the basis of Association of physicians of India, 2013 and it was found that respondent having optimal systolic and diastolic blood pressure i.e. <120 and <80 mmHg respectively were either underweight and normal whereas most of the respondent having greater systolic and diastolic blood pressure i.e.
>139 and >89 mmHg respectively were overweight and obese.
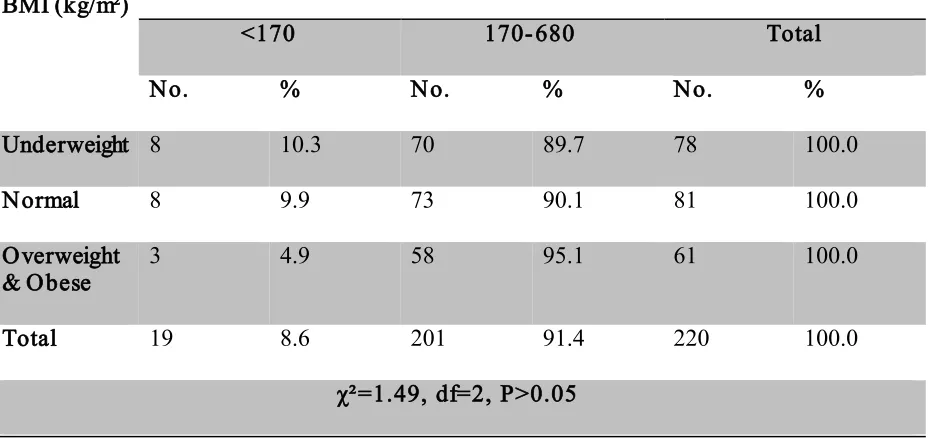
Table 3. shown that there was no significant relation was found between BMI and PEFR in this study but N.K. Mungreiphy et al. found PEFR was maximum among subjects with normal BMI, followed by overweight and obese and Jones et al. also found that the reduction in PEFR is proportional to the increase in BMI. Majority of respondent in this study whether underweight, normal and overweight & obese having PEFR 170-680 L/min i.e. in yellow zone thus the respondent were at risk may be due to lack of exercise, sedentary lifestyle, poor ventilation, etc. About 10.3 % of underweight respondent were having PEFR <170 L/min as in the case of undernourishment contraction of diaphragm and muscle mass reduces the lung functions.
Correlation of the different variables has been represented in Table 4., significant positive correlation exist between BMI and SBP & BMI and DBP at 0.1% level of significance. Positive correlation exists between BMI and PEFR but it was not significant.
4. Conclusion
From the current study it was found that
BMI increased with age and also
5. References
1. Anil, E. J., Nku, C. O., Nna, V. U. and Nwangwa, J. N. (2014). Relationship between Body Mass
Index, Blood Pressure and
Respiratory Indices among Male Students of University of Calabar, Cross River State, Nigeria. IJSR, 3(12), 2028-2031.
2. Bandyopadhyay, A., Tripathy, S., Kamal, R.B. and Basak, A.K. (2007). Peak expiratory flow rate in college students of Uttar Pradesh, India. Indian Biologist, 39(1), 71-75.
3. Bandyopadhyay, A. (2011).
Pulmonary function studies in young healthy Malayasians of Kelantan, Malayasia. Indian Journal of Medical Research,134, 653-657.
4. Bandyopadhyay, A., Bhattacharjee, I., Dalui, R. and Pal, S. (2013). Pulmonary function studies of
healthy Non-smoking male
University students of Kolkata, India- Revisited. Malaysian Journal of Medical Sciences,20(2), 17-24. 5. Bosello, O., Armellini, F., Zamboni,
M. and Fitchet, M. (1997). The benefits of modest weight loss in type II diabetes. International Journal of Obesity, 21 (Suppl 1), S10–SS3. 6. Chan, J.M., Rimm, E.B., Colditz,
G.A., Stampfer, M.J. and Willett,
W.C. (1994). Obesity, fat
distribution, and weight gain as risk factors for clinical diabetes in men. Diabetes Care, 17(9), 961-969. 7. Colditz, G. A., Willett, W.C.,
Stampfer, M. J., Manson, J. E., Hennekens, C. H., Arky, R. A., Speizer, F.E.(1990). Weight as a risk factor for clinical diabetes in women. Am J Epidemiol, 132(3), 501-513.
8. Frank, Q. N.(2015). Body Mass Index Obesity- BMI, and Health: A Critical Review. Nutrition Today, 50(3).
9. Friedman, G. D., Selby, J. V., Quesenberry, C. P., Armstrong, M. A. and Klatsky, A.L. (1988). Precursors of essential hypertension: body weight, alcohol and salt use, and parental history of hypertension. Prev Med, 17, 387–402.
10.Goldstein, D. J. (1992). Beneficial health effects of modest weight loss. International Journal of Obesity, 16, 397– 415.
11.Huang, Z., Willett, W. C. and Manson, J. E. (1998). Body weight, weight change, and risk for
hypertension in women. Ann
International Medicine, 128, 81–88. 12.Jones, R. L. and Nzekwu, M. M.
(2006). The effects of body mass index on lung volumes. Chest, 130(3), 827–833.
13.Joshi, V. and Shah, S. (2016). Effect of Body Mass Index (BMI) on Peak Expiratory Flow Rate in young adults. IAIM, 3(5), 85-88.
14.Lowder, S. C. and Brown, R. D.(1975). Essential cardiovascular regulation. American Journal of Medical Sciences, 58, 272-275. 15.Micheal, I. L., Hongyan, Li. and
Zhi-Shem, H. (2003). Influence of varying degrees of malnutrition on IGFI expression in rat diaphragm. J Appl. Physiol, 95(2), 555-562.
17.Onadeko, B.O., Iyun, A.O., Sofowora, E.O. and Adamu, S.O. (1984). Peak expiratory flow rate in normal Nigerian children. Afr J Med medSci, 13(1-2), 25-32.
18.Pi-Sunyer, F. X. (1993). Short-term medical benefits and adverse effects of weight loss. Ann International Medicine, 119, 722–726.
19.Saraswathi, I., Christy, A., Saravanan, A. and Prema, S. (2014). Correlation of Obesity Indices with Peak Expiratory Flow Rate in Males and Females. IOSR Journal of Pharmacy, 4(2), 21-27.
20.Stamler, J. (1991). Epidemiologic findings on body mass and blood pressure in adults. .Annual Epidemiology, (1), 347–362.
21.Strolls, P. J. and Rogers, R. M.(1996).Obstructive sleep apnea.
New England Journal of Medicine, 334, 99-104.
22.WHO Expert Consultation. (2004). Appropriate body mass index for
Asian populations and its
implications for policy and intervention strategies, The Lancet, 363, 157-63.
23.Yong, L. C., Kuller, L. H., Rutan, G. and Bunker, C. (1993). Longitudinal study of blood pressure: changes and determinants from adolescence to middle age. The Dormont High School follow-up study 1957–1963 to 1989–1990. American Journal of Epidemiology, 138, 973–983.
24.Zerah, F., Harf, A., Perlememuter, L., Larino, H., Lorino, A. and Atlan, G. (1993). Effects of obesity on respiratory resistance. Chest,103, 1470-1476.
Table Legend-
Table 1. Showing age wise distribution of respondent on the basis of their BMI.
Table 2.(a) Showing BMI wise distribution of respondent according to their Systolic Blood Pressure.
Table 2.(b) BMI wise distribution of respondent on the basis of their Diastolic Blood Pressure.
Table 3. Showing BMI wise distribution of respondent on the basis of their PEFR.
Table 1. Showing age wise distribution of respondent on the basis of their BMI.
A g e(years)
Bo d y M as s In d ex (BM I) kg /m²
Un d erweig h t No rmal Ov erweig h t & Ob es e
M ean ± SD
No . % No . % No . %
15-24 (n =141)
73 51.8 52 36.9 16 11.3 19.04 ± 3.37
25-34 (n =49)
2 4.1 27 55.1 20 40.8 23.21 ± 3.99
35-45 (n =30)
3 10.0 2 6.7 25 83.3 28.04 ± 5.00
To tal (n =220)
78 35.5 81 36.8 61 27.7 21.20 ± 4.94
F=79.52, P < 0.001, Sig n ifican t p airs (1 Vs 2&3) (2 Vs 3)
Table 2.(a) Showing BMI wise distribution of respondent according to their Systolic Blood Pressure.
BMI (Kg/m²)
SBP(mm Hg)
<120 120-139 >139 Total
No. % No. % No. % No. %
Underweight 55 70.5 22 28.2 1 1.3 78 100.0
Normal 56 69.1 23 28.4 2 2.5 81 100.0
Overweight & Obese
28 45.9 24 39.3 9 14.8 61 100.0
Total 139 63.2 69 31.4 12 5.5 220 100.0
Table 2.(b) BMI wise distribution of respondent on the basis of their Diastolic Blood Pressure .
BMI (kg/m²)
DBP(mm Hg)
<80 80-89 >89 Total
No. % No. % No. % No. %
Underweight 62 79.5 16 20.5 0 0.0 78 100.0
Normal 55 67.9 20 24.7 6 7.4 81 100.0
Overweight & Obese
20 32.8 30 49.2 11 18.0 61 100.0
Total 137 62.3 66 30.0 17 7.7 220 100.0
χ² =37.64, df=4, P<0.001
Table 3. Showing BMI wise distribution of respondent on the basis of their PEFR.
BMI (kg/m²)
Pulmonary Expiration Flow Rate (PEFR) L/min
<170 170-680 Total
No. % No. % No. %
Underweight 8 10.3 70 89.7 78 100.0
Normal 8 9.9 73 90.1 81 100.0
Overweight & Obese
3 4.9 58 95.1 61 100.0
Total 19 8.6 201 91.4 220 100.0
Table 4. Correlation of the different variables measured .
Parameter Correlation (r) P - value
BMI vs PEFR 0.041 P>0.05
BMI vs SBP 0.308*** P<0.001