AN INVESTIGATION OF DYNAMIC HUMAN
MUSCLE FUNCTION USING A VARIABLE
INERTIAL LOADING SYSTEM
STEPHEN JOHN PEARSON
This thesis is submitted to the University o f London in partial
fulfilment for the degree o f Doctor o f Philosophy
Department o f Physiology
Royal Free & University College Medical School
Rowland Hill Street
ProQuest Number: U644091
All rights reserved
INFORMATION TO ALL USERS
The quality of this reproduction is dependent upon the quality of the copy submitted.
In the unlikely event that the author did not send a complete manuscript and there are missing pages, these will be noted. Also, if material had to be removed,
a note will indicate the deletion.
uest.
ProQuest U644091
Published by ProQuest LLC(2016). Copyright of the Dissertation is held by the Author.
All rights reserved.
This work is protected against unauthorized copying under Title 17, United States Code. Microform Edition © ProQuest LLC.
ProQuest LLC
789 East Eisenhower Parkway P.O. Box 1346
ACKNOWLEDGEMENTS
I would firstly like to express my gratitude and thanks to Dr. Stephen
Harridge for his excellent support throughout the course o f this study,
in particular for always having time to answer my questions.
Special thanks also to the many expert people and colleagues who
have given their time and specialist knowledge to help, which include
in no particular order. Professor Roger Woledge, Professor Donald
Grieve, Professor Archie Young, Tony Christopher, Bill Potter,
Apostolos Galantis, Mathew Cobbold and the staff o f the Royal Free
Engineering Department. Many thanks to those who gave their time to
take part in the studies undertaken in this thesis, without which it
would not have been possible.
I would also like to thank my family for their continuing
encouragement and also in memory o f my grandparents who gave me
many special memories. Lastly to my partner, Gladys who has been
ABSTRACT
This thesis has developed and utilised an inertial loading system to study human skeletal muscle power output. Specifically, the apparatus has been used to study the effects of different modes of exercise, muscle myosin isoform composition and the effects of ageing on the ability of the lower limb muscles to generate explosive power.
A variable inertial loading system was designed and constructed which allowed for the sensitive detection of the rotational properties of a flywheel from which the contractile characteristics of muscle could be inferred. When housed in the
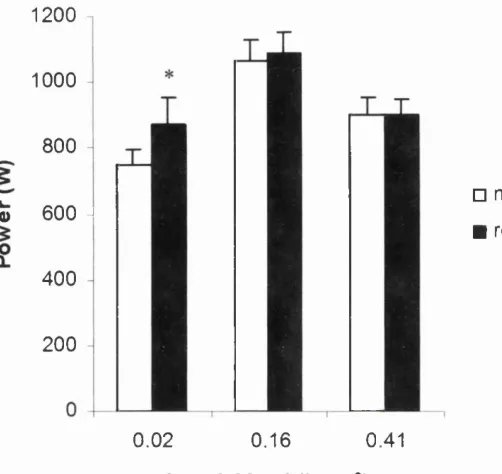
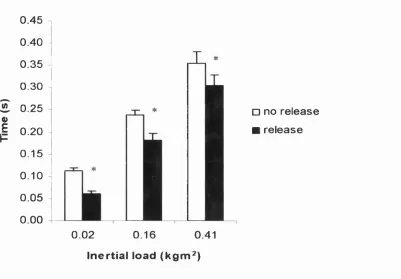
Nottingham Power Rig (NPR) the peak power generated by young non-trained male subjects from a single lower limb thrust ranged from 608 - 965 Watts and was found to occur at inertial loads ranging from 0.09 - 0.22 kgm^. To investigate the low power outputs observed at the low inertial loads, where the contraction time was short, a pre release mechanism was incorporated into the flywheel assembly. Significant increases in power output o f - 17% were achieved at the lowest inertial load (P = 0.02), if a prior build up of isometric torque was allowed prior to movement. This suggested that at the low inertial loads, without the pre release, insufficient time was allowed for the muscle to generate its maximum power output.
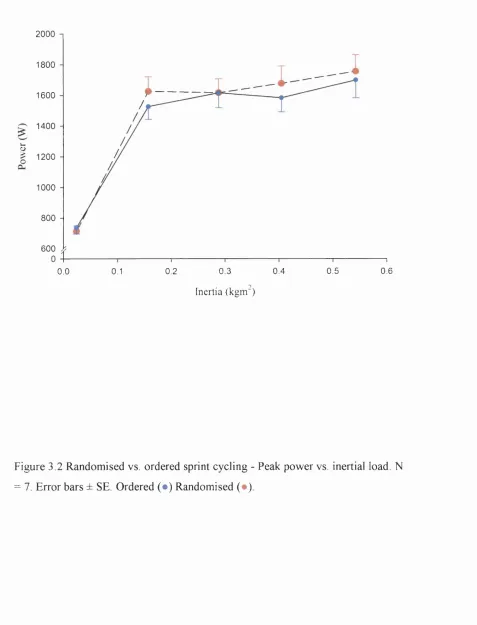
The flywheel system was incorporated into a cycle ergometer to allow power - velocity characteristics to be examined during inertial sprint cycling. Peak power obtained in young subjects (n = 9) was significantly higher in the cycle exercise when compared with the NPR (1620 vs. 937 Watts). In contrast to the NPR where a parabolic relationship between power and inertial load was observed, during sprint cycling power plateaued above a ‘critical’ load. It was concluded that the repetitive acceleration of inertial loads, above this critical threshold, will always allow the expression of peak power during cycling as ultimately a velocity will be achieved which corresponds to that required for peak power generation.
An analysis of the myosin heavy chain (MHC) isoform composition of the vastus lateralis muscle was performed in young and elderly male subjects (n = 14, mean age 29.4 and 73.8). The percentage MHC-II isoform composition was
significantly lower in the older subjects as was the velocity at which peak power occurred (Vopt)- Overall the Vopt during sprint cycling was found to be related to the percentage MHC-II composition of the vastus lateralis (R = 0.82, P<0.001).
Finally, muscle power was examined in Elite level master Olympic weightlifters (n = 54, aged 40 - 87 years) and aged matched controls. On average the
weightlifters generated - 32% more peak power than their aged matched
TABLE OF CONTENTS
PARTI
PART II
ABSTRACT
TABLE OF CONTENTS
INTRODUCTION
l.Introduction
2 Review of literature
MEASUREMENT OF MUSCLE POWER USING
AN INERTIAL LOADING SYSTEM
PAGE
1
2
10
14
CHAPTER 1 : INERTIAL TESTING SYSTEM DEVELOPMENT
1.1 Introduction 63
1.2 New method to measure accurately exertion time 69
1.3 Measurement and validation of torque 73
determination method
1.4 Design of variable inertial system 81
1.5 Summary 97
CHAPTER 2 EFFECT OF ISOMETRIC PRELOAD ON
POWER OUTPUT
2.1 Introduction 100
2.2 Methods 103
2.3 Results 108
2.4 Discussion 122
CHAPTER 3 POWER OUTPUT DURING INERTIAL SPRINT
CYCLING
3.1 Introduction 130
3.3 Results
3.4 Discussion
PART m INVESTIGATION OF MUSCLE OUTPUT
CHARACTERISTICS, TRAINING AND
RELATIONSHIP TO MUSCLE COMPOSITION
141
149
CHAPTER 4 MYOSIN HEAVY CHAIN ISOFORMS AND
MUSCLE POWER OUT IN YOUNG AND OLD
MEN
4.1 Introduction
4.2 Methods
4.3 Results
4.4 Discussion
CHAPTER 5 A CROSS SECTIONAL STUDY OF MUSCLE
POWER AND STRENGTH IN ELITE MASTER
WEIGHTLIFTERS
5.1 Introduction
5.2 Methods
5.3 Results
5.4 Discussion
CHAPTER 6 SUMMARY AND CONCLUSIONS
REFERENCES
APPENDICES
A Investigation of the velocity profile during a
typical exertion on the Nottingham Power Rig
(NPR)
B Circuit diagram of rotary encoder digital pulse
converter
C Spike 2 scripts and Mathcad analysis programme
D Circuit diagram of strain gauge amplifier
E Calculation of inertial and frictional constants
F Isometric pre loading pilot study 297
G Controller circuit diagram for isometric preload 299
device
H Mathcad programme to analyse cycling data 300
1 1999 World Masters weightlifting meeting 305
performance table
PUBLICATIONS
ABSTRACTS 309
FULL PAPERS 317
BOOK CHAPTER 330
LIST OF TABLES
1.1 Summary of strength training studies in the 57
elderly
1.2 Typical loss values 89
2.1 Maximal isometric torque, isometric pre release 109
values and dynamic maximal torque at each
inertial load.
2.2 Mean values of isometric pre release time and 114
exertion times under both voluntary - with pre
release torque and voluntary - without pre
release torque conditions
3.1 Summary of peak power output for cycling and 143
MNPR. Percentage differences between cycling
and MNPR.
4.1 Physical characteristics of subjects 164
4.2 Anthropometric measures of group mean lower 173
limb volumes
5.1 Physical characteristics of the subjects 208
5.2 Mean values for MPP and APmpp 218
5.3 Mean values for isometric knee extensor 224
5.4 Group comparisons in rates of change of power 225
and strength
LIST OF FIGURES
1.1 An example of typical force and power velocity 26
relationship of skeletal muscle consisting of slow
and fast fibres
1.2 Typical traces of dynamic contractions with 35
isotonic, isokinetic and isoviscous modes.
1.3 Force - velocity relationship showing effect of 67
muscle strength on power output
1.4 Subject positioning on modified power testing 70
apparatus
1.5 Typical trace of power output on MNPR 72
1.6 Strain gauge circuit diagram 75
1.7 Strain gauge calibration 78
1.8 Comparison of torque using strain gauge and 80
rotary encoder system
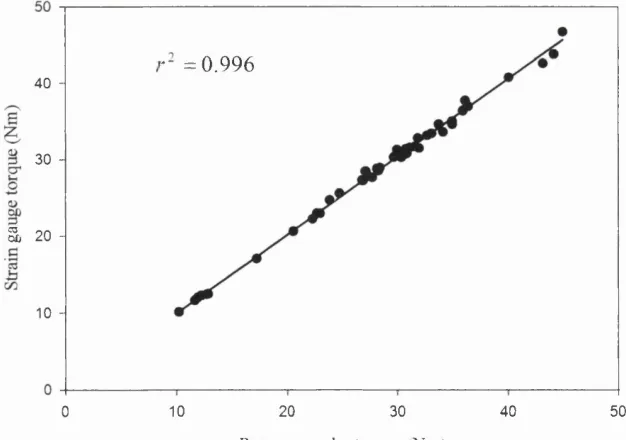
1.9 Relationship between strain gauge torque and 80
rotary encoder torque
1.10 Modified inertial test system 82
1.11 Drop test to determine inertia 84
1.12 Schematic representation of frictional vectors 87
1.13 Relationship between applied thrust and 87
braking torque
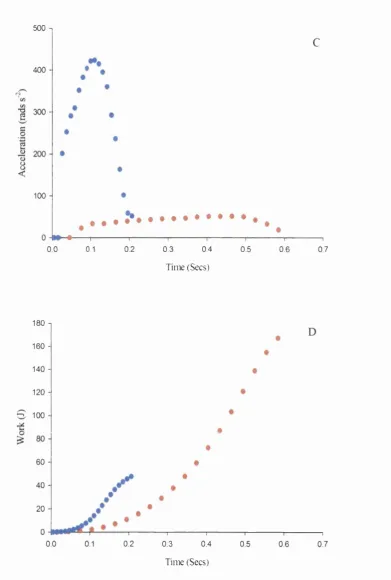
1.14 Torque, velocity, acceleration, work done and 90-92
power at high and low inertial loads
1.15 Reproducibility of peak and average torque 95-96
and power
2.1 Flywheel system incorporating pre release device 104
2.2 Torque generated at high, medium and low 110-112
release
2.3 Comparison of peak power, with and without an 115
isometric pre release
2.4 Comparison of flywheel position at peak power, 115
with and without an isometric pre release
2.5A Torque at peak power 117
2.5B Velocity at peak power 117
2.6 Comparison of peak torque, with and without an 119
isometric pre release
2.7 Comparison of flywheel position at peak torque, 119
with and without an isometric pre release
2.8 Time to reach peak torque 120
2.9 Mean power output 120
3.1 Inertial cycle apparatus 138
3.2 Randomised vs. ordered sprint cycling 142
3.3 Comparison of peak power output (MNPR vs. 143
sprint cycling)
3.4 Power output at high, medium and low inertial 145
loads
3.5 Time to peak power vs. inertial load 146
3.6 Group torque, velocity relationship at all inertial 147
loads
3.7 Group, power ,velocity relationship for all 147
inertial loads
3.8 Relationship between peak power and optimal 148
velocity
3.9 Power output during friction braked cycling 150
3.10 Hypothetical characteristics of power 156
generation for cycling and MNPR under
identical inertial loading conditions
A Comparison of subject position - NPR vs. cycle 166
4.2 Individual power output vs. crank velocity 174
during inertial sprint cycling
4.3 Individual normalised power output vs. mean 176
crank velocity during inertial sprint cycling
4.4 Individual plots of torque vs. velocity during 177
inertial sprint cycling
4.5 Elderly mean values of velocity and torque at 178
maximal power as a percentage of the young
mean values
4.6 M H C -n isoform composition of the vastus 181 lateralis as a percentage of the total
4.7 Relationship between the percentage MHC-II 182
composition of the vastus lateralis and the Vopt
during inertial sprint cycling
4.8 Relationship between percentage MHC-H 184
composition of the vastus lateralis and the
maximal power output during inertial sprint
cycling
4.9 Mean power output vs. velocity during MNPR 185
exertions over five inertial loads
4.10 Normalised mean power output vs. velocity 185
during MNPR exertions over five inertial loads
4.11 Torque vs. velocity during MNPR exertions 187
over five inertial loads
4.12 Velocity and torque at maximal power as a 188
percentage of the young group
4.13 Relationship between the % MHC-H 189
composition and the V©pt during MNPR
exertions
4.14 normalised power output for all subjects 190
plotted against the % MHC H
power output during exertions on the MNPR
5.1 Subject positioning during isometric strength 210
testing
5.2 Weightlifters performance data. 216
5.3 Absolute values for A) MPP, B) APmpp 217
5.4 Number of subjects obtaining MPP at a specific 219
inertia.
5.5A Torque (TQmpp) 220
5.5B Velocity (Vmpp) 220
5.5C Time (Tmpp) 221
5.6 Original record showing the strain gauge signal 223
during isometric knee extension along with the
associated EMG from the vastus lateralis and
biceps femoris muscle groups
5.7 Isometric knee extensor strength 224
5.8A Median density frequency (MDF) of the power 226
spectrum of the vastus lateralis
5.8B Root mean squared (RMS) of the vastus 226
lateralis during isometric knee extension
5.8C Percentage biceps femoris involvement during 227
isometric knee extension
PLATES 180
1. Gel showing myosin bands in lanes
LIST OF ABBREVIATIONS
NPR - Nottingham Power Rig
MNPR - Modified Nottingham Power Rig
n l - number of flywheel turns during fall of known
mass
n2 - number of flywheel turns after known mass
reaches floor
PPk - Peak power
Tqppk- Torque generated at peak power
Vppk- Velocity at peak power
Tqpk-Peak torque
MP - Mean power
Vopt - Optimal velocity at peak power during cycling
Topt Torque generated at peak power during cycling
LLV - Lean limb volume (muscle + bone)
MPP - maximum peak power
APmpp - Average power at the load at which peak
power occurred
TOmpp - Torque generated at maximum peak power
Vmpp - Velocity generated at maximal peak power
INTRODUCTION
Muscle power is the rate of doing work, or the product of force of
contraction and speed of movement. The ability of the muscular
system to generate power ultimately determines the ability to perform
physical tasks, whether this is for athletic performance, or in the case
of the frail elderly person in rising from a chair. Over the years a
number of different methods have been developed for measuring
muscle power in man. These have ranged from simple tests such as the
Sargent jump (1921) to the Margaria test (1966) both of which utilise
the body as a method of loading the muscles. The advent of isokinetic
devices in the late 1960’s has seen their extensive use in studies of
human muscle function. Whilst these tools, which allow joints to
rotate at constant angular velocities, are useful, they do not reflect the
way muscles behave in the environment, which is against inertial loads
and against gravity.
With a view to having a method of testing muscle power which
reflected the way that muscles behave and in a manner which was
practical and safe for elderly people, Bassey and Short (1990)
developed an inertial system, the Nottingham Power Rig (NPR). This
comprised o f a fixed inertial flywheel system which allowed the
average power during a single lower limb thrust lasting less than 1
associated with fiinctional ability in elderly people (Bassey et al. 1992,
Skelton et al. 1994). The NPR had the advantage of practicality in that
a simple pin and optoswitch system could be used to time the rotation
of the flywheel. However, as will be discussed later in this thesis, this
method does not give an accurate measure of muscle power. This
method had two possible limitations which were; 1) the fixed inertial
load, which may not represent the optimum for all subjects, and 2) the
timing of the contraction phase, which relied on assumptions of
constant acceleration during the exertion period. More accurate
measures of muscle power have been obtained by others using inertial
loading, where strain gauge systems have been placed between the
limb and the inertial load and where goniometers have been placed on
the limb in order to measure velocity of joint rotation (Aagaard et al.
1994). The work presented in this thesis focuses on the design of a
variable inertial testing system which is both practical and capable of
making valid, objective measures of muscle function in man without
the need for other force transducers or goniometers. This system was
based on the accurate timing of the contraction phase via a high
resolution rotary encoder and on allowing the inertial load to be varied
so it could be ‘optimised’ in terms of power output for different
individuals.
Single fibre studies have shown that muscle myosin composition
in vivo level this has been shown to some extent using isokinetic
apparatus (Andersen and Aagaard 1998, Harridge et al. 1995).
However the role of muscle composition in terms of the MHC isoform
composition with respect to power output under inertial loading
conditions is not known. Part of the work undertaken in this thesis
uses the inertial system to study the relationship between muscle MHC
isoform composition and power output under different exercise
conditions in young and old people.
Previous studies of muscle power output in man such as with sprint
cycling have reported values of power output up to -2000 Watts
(Davies et al. 1984, Sargeant et al. 1981), considerably greater than
that reported for the NPR (Bassey et al. 1990). The design of the
inertial system allowed muscle power during these two different tasks
to be compared.
When tested using inertial loading, muscle power in older people has
been shown to decline at a greater rate than isometric strength (Davies
et al. 1983, Skelton et al. 1994). This suggested that the older muscle,
as well as being weaker was also slower. However, in these studies a
single inertial load (either body weight or a heavy flywheel) was used,
therefore it is also possible that the inertial load was too high for
weaker people to express their maximal power. By optimising the
output with increasing age is greater than that of isometric strength is
re-examined in this thesis.
Much work has also been carried out with regard to possible
interventions, to reduce or ameliorate the effects of ageing on the
muscular system. It has been reported that resistance training in the
elderly shows similar improvements to that in younger individuals
(Evans 1995, McCartney et al. 1996, Fiatarone et al. 1994, Skelton et
al. 1995, Harridge et al. 1998). However, the effects of long term
resistance training in elite weightlifting athletes have not been studied
extensively. The study of such athletes is important as it may aid our
understanding of the limits to which older muscles can potentially
function. The apparatus developed as part of this thesis has been
PARTI
The review of literature aims to provide a background to the work in the study.
This is firstly, by outlining the structure of skeletal muscle and the basic
mechanisms involved in the contraction of muscle. This includes a brief review
of the theories of muscle contraction and the mechanical properties of muscle.
Details are given regarding the classification of muscle fibres and myosin heavy
chain isoform composition, and their relevance with respect to power output. An
overview of the different methods of testing muscle output characteristics along
with the relative merits of each is given. Finally to explain the specific use in this
thesis of subjects who might be expected to differ in their ability to generate
power, a section is included which examines both the effects of age on the ability
to generate both power and strength, and also the effects of resistance training on
these abilities.
1) MUSCLE PROPERTIES
Movement occurs as a result of the muscles developing force and pulling on the
skeletal framework via the tendons. The force is generated by the interaction of
the contractile proteins, actin and myosin more specifically the interaction of the
myosin heavy chain heads with active sites on the actin; these proteins form the
molecular motors of skeletal muscle. The following section examines the factors
involved in the generation of force and power by the muscular system.
n MUSCLE STRUCTURE
Skeletal muscle consists of many bundles of fibres, each fibre being
approximately 50pm in diameter. A muscle fibre itself is composed of many
fundamental contractile unit of skeletal muscle, which is the sarcomere. Actin, or
the thin filament, consists of a double helix arrangement. Myosin or the thick
filament consists of a large asymmetrical molecule. This consists of two heads,
which are about 165 A (1.65 x 10'^ m) long and 65 A (6.5 x 10'^ m) wide at one
end which continues into a tail which is about 1500 A (1.5 x 10'^ m) long and 20
A (2 X 10'^ m) wide. The myosin molecule consists of two heavy chains, which
weigh about 200 kDa, these form the helical tail structure and the two heads,
which form the cross bridges towards the actin filament and four light chains,
which range from 15 kDa to 25 kDa in weight. The total length of the myosin
molecule is approximately 150 nm whereas the cross bridges are approximately
13 nm in length and lie in six rows along the myosin filament. Two of the light
chains are classified as regulatory and two as alkali, one of each type is attached
to the myosin head. The myosin molecule can also be determined in terms of its
meromyosin structure, the heavy chain being split into light meromyosin (LMM)
and heavy meromyosin (HMM), with the HMM being further subdivided into a
S1 region which consists of the head region and the S2 region, which consists of a
rod like section and has no ATPase activity (for review see SchiafFino and
Reggiani 1996).
in MECHANISM OF MUSCLE CONTRACTION
For muscle contraction to take place the myosin cross bridges must make contact
with the actin filament. For this to occur the tropomyosin, which is bound to the
actin filament, must move in order to expose the active sites on the actin. On
causes a conformational change in the tropomyosin. X-ray diffraction studies
(Rayment et al. 1993) have suggested that during muscle activation tropomyosin
moves from its lateral position on the actin filament by about 15 A (1.5 x 10'^ m)
towards the centre of the actin helical groove this has the effect of uncovering the
active sites on the actin. What follows next is termed the cross bridge cycle.
The myosin head, which in its resting state has stored energy by the splitting of
ATP into ADP and P i, undergoes a conformational change, which can be termed
the repriming of the power stroke. The myosin head then attaches itself to an
exposed site on the actin filament. This actomyosin connection triggers the
sequential release of Pi and ADP from the myosin head. On releasing Pj the
myosin undergoes a conformational change which is termed the power stroke,
here the converter region is thought to act as a hinge, and the result is a movement
of the actin past the myosin by approximately 11 ± 2 .4 nm (Finer et al. 1994).
Immediately following the movement ADP is released. The release of ADP is
thought to be strain related, if the filaments are under load the release of ADP is
slower hence aiding the release of ADP once the movement is over. Once ADP is
released ATP rapidly replaces it causing the disassociation of myosin from actin,
in order to repeat the cycle. The total time for this complete cycle is of the order
of 50 ms, with the power stroke conformational change taking approximately
2 ms. The force generated by the power stroke is being approximately 3.4 ± 1.2
pN (Finer et al. 1994). However, Molloy et al. (1995) using double optical trap
(1994), have found smaller values of movement per cross bridge stroke (4 nm)
and less force per cross bridge stroke (1.7 pN).
Cross bridge theory
Based on studies using electron microscopy, H. E. Huxley (1954) proposed that
muscles shorten by a process of two sets of interdigitating filaments sliding past
each other. Later A. F. Huxley (Huxley, 1957) proposed that these filaments slide
past each other as a result of the action of independent force generators or cross
bridges - the so called ‘cross bridge theory’. He suggested that the thick filaments
had side attachments (cross bridges), which contained an elastic element and
allowed connection of the thick filament to the thin filament at specialised sites.
The ‘cross bridges’ which were continuously moving whilst unattached due to
Brownian motion, were thought to act as independent force generators and were
thought to attach spontaneously. The attachments were constrained to occur
asymmetrically in order to generate force, which tended to shorten the sarcomere.
The rates of attachment and detachment were controlled by constants f and g
respectively. These constants were linear functions of the distance from the active
site on actin to the equilibrium position (x) of the cross bridge. When the
mathematical model was compared with the experimental results of Hill (1938) a
good agreement was found in terms of the force - velocity relationship during
concentric contraction. During eccentric work the predictive model overestimated
the rate of energy liberated as heat, which is supposedly linearly related to the
speed of lengthening. This was not found to be the case experimentally (Abbot
model could be overcome by assuming that during eccentric work the cross
bridges did not require any energy to disassociate rather they were released by
mechanical means. Later in 1971 in light of the experimental evidence of fast and
slow force transients from an isometric stepwise length change, Huxley revised
the original theory (Huxley and Simmons 1971). The revised theory allowed the
cross bridge to exist in different states whilst attached, thereby allowing work to
be performed in small steps. To allow this conformational change without relative
displacement of the thick and thin filaments, an undamped elastic element is
present within each cross bridge. The elastic element was therefore responsible for
the fast, force drop transient during the length step and the cross bridge
conformational change being responsible for the fast recovery section of the force
during recovery.
The original theory of The ‘swinging cross bridge’ (Huxley 1969), has now been
modified in light of spectroscopic and structural observations to allow for the very
small movement of the cross bridge head seen, whereby the distal portion (C-
terminal), of the cross bridge was suggested to act as a lever arm (Cooke, 1986),
this has been termed the ‘swinging lever arm hypothesis’. Later Rayment, (1993)
also suggested a model determined from the combination of the molecular
structure of the actin myosin complex and that obtained by cryo-electron
un BASIC MECHANICAL PROPERTIES
The study of muscle mechanics enables a quantitative description of the
physiological aspects of muscular contraction. The use of mathematical models to
help understand and describe these physiological events has made use of the
mechanics of muscular contraction. The methods employed are involved even at
the level of the single fibre or filament interaction, but are complicated further at
the level of the whole muscle or in situ. There are many factors to consider when
concerned with the mechanics of muscular contraction, but properties of muscle
contraction that are of particular importance from a mechanical viewpoint are
those of force and velocity and how these factors are effected by the length of the
muscle. Investigation of these factors began many years ago. Since the early work
of Hill (1938) who proposed a hyperbolic force - velocity relationship for muscle
V = b(Fo-F)/(F+a) from his empirical work on the heat production and shortening
of muscle, many studies have examined the relationship using in vitro
preparations of both animal and human muscle and by making in vivo
measurements on both animal and human subjects. The relationship still remains
practical today. The interactions of muscle fibre mechanical properties and the
relationship to the structural properties of muscle have been further elucidated by
single fibre experiments.
Length - tension relationship
Ramsey and Street (1940) were among the first to demonstrate that force
force was optimal when a fibre was close to its slack length of 2 m, and that the
force declined on either side of this fibre length.
The work of Gordon, Huxley and Julian (1966), on frog muscle, determined that
the force generated by muscle filaments could be altered by the degree of overlap
of the filaments and was proportional to the number of active cross bridges. Here
when the sarcomere - force relationship is plotted there is a characteristic
ascending limb, a plateau region and a descending limb. This relationship between
force and length is known as the length tension relationship. Maximum force
development in frog muscle is achieved at a sarcomere length of 2.0 - 2.2 /y m, at
shorter and longer sarcomere lengths the force drops in a linear fashion. The
reasons for the decrease in force as the sarcomere shortens are thought to be a
combination of the mechanical interference caused by the thin filament overlap
and at shorter lengths, deformation of the thick filament. This idea has been
challenged by the observation that Ca^^ release from the sarcoplasmic reticulum
was impaired at the shorter sarcomere lengths (Rudel and Taylor 1971). When
caffeine was administered, increasing Ca^^ release, the force generated by the
fibre increased, suggesting incomplete activation may also play a key role in the
force decrement on the ascending portion of the length - tension curve. At the
longer sarcomere lengths (descending limb of the length - tension curve) a
decrease in the number of active cross bridges brings about the linear reduction in
tension. Keurs et al. (1978) showed non-linearity during this descending limb
phase. This observation was due to their method of holding the fibre at a set
of non-sarcomere linearity is probably more physiologically representative of the
whole muscle in vivo.
Force - velocitv/power relationship
In order to determine the force velocity relationship using in vitro muscle
preparations either the force (isotonic) or the velocity (isovelocity) is held at a
constant value (independent variable). In order to ascertain the maximum
shortening velocity, which relates to the maximum rate of cross bridge cycling, a
series of unloaded shortening contractions at different lengths are carried out
(quick release method or slack test - Edman et al. 1979). Here the distance moved
by the slack fibre and the time taken to initiate tension redevelopment is noted,
thus allowing the velocity of shortening to be determined. These experiments are
carried out under conditions of full activation.
Most in vitro force - velocity characterisations have been carried out on animal
preparations. Fenn and Marsh (1935) were the first to carry out experiments
relating the force - velocity properties of muscle. Later in 1938, Hill, building on
the earlier work of Fenn (1923), whilst determining the heat production of frog
muscles under shortening conditions, found that the heat produced was
proportional to the amount of muscle shortening. From this observation the classic
hyperbolic equation was formulated V = b(Fo-F)/(F+a), where V is the velocity of
shortening, Fo is the isometric force at optimal sarcomere length, F is the
instantaneous force and a and b are constants with a having units of force and b
units of velocity. The relationship of force to velocity can be related to the
(MHC) isoforms. As the speed of contraction increases the probability of cross
bridge attachment by the filaments with ‘slower’ MHC isoforms decreases, less
attached cross bridges will result in a lower force generation. Also the time of
cross bridge attachment is shorter thereby having less time to exert a positive
force. Negative forces at very high speeds of contraction are also possible, if the
detachment of cross bridges cannot keep pace with the shortening, thus allowing
‘compressive forces’ to be developed.
In studies using frog muscle, Edman (1993) suggested that the hyperbolic
relationship described by Hill (1938), deviated from the predicted curvature at
loads in excess of 80% of maximal isometric force or 1/10* of the maximal
shortening velocity (Vo). This persisted even after administration of dantrolene,
which reduces Ca^^ release from the sarcoplasmic reticulum. He concluded that
the deviation seen in the force - velocity relationship as the shortening speed went
below 1/10* of Vo was due to a change in the kinetics of cross bridge function
whereby less force than expected from the Hill equation is produced. Gordon et al.
(1986) showed differences in mechanical properties between skinned and living
frog fibres, the mechanical data from the skinned fibres better fitted the hyperbolic
curve suggested by Hill than the intact living fibres. Edman, (1988) also showed
that on whole frog muscle fibres a double hyperbolic relationship existed when
force - velocity data was fitted. In contrast other studies have shown good
agreement with the force - velocity relationship described by Hill. Close (1964)
and Close and Hoh (1967) showed that using slow and fast rat muscles and new
bom kitten muscles respectively, a good general agreement was found with that of
average 0.25 suggesting the muscles examined had similar properties to the frog
muscles used by Hill.
Studies involving human muscle fibre have generally shown an agreement with
those studies carried out on animal preparations. For obvious reasons most human
studies have involved whole muscle in vivo tests. However, single muscle fibre
preparations (Bottinelli et al. 1996) or more recently isolated single actin - myosin
interactions have been possible (Finer et al. 1994). The power - velocity
relationship follows a parabolic course with the power being zero at both
maximum velocity of shortening (Vmax) and where velocity is zero. It can be
shown mathematically that maximal power occurs at approximately 30% of the
maximum speed of shortening.
In order to gain further insight into the functional characteristics of human muscle,
studies have been carried out which aim to determine the mechanical properties of
different muscle fibre types based on their MHC classification. These studies have
identified the differences in the force - velocity, and power output of fibres
comprising of different MHC isoforms. It has been reported that the power,
maximum shortening velocity and specific force was dependant upon the MHC
composition of the fibres with the fibres composed of MHC-II possessing the
higher mechanical values (Bottinelli et al. 1999). For expansion of this point see
Chapter 4.
iv) MUSCLE FIBRE TYPES
Historically fibre type classification has been carried out using either
Herman, 1955), or alternatively, based on the mitochondrial enzyme content of
fibres (Ogata and Mori 1964). Within the context of histochemical classification,
fibres can be described as type I type IIA or type IIB. In contrast to ATPase
histochemistry which identifies fibres on the basis of the susceptibility of this
ATPase enzyme to different levels of pH, more recent methods have used sodium
dodecyl sulphate polyacrylamide gel electrophoresis (SDS-PAGE) and
immunohistochemistry, (Biral et al. 1988, Danieli-Betto et al. 1986) to identify
fibres on the basis of their MHC isoform protein composition.
In human muscle 3 different isoforms of MHC have been identified, one slow
isoform MHC-I and two fast, MHC-IIA and MHC-IIX. The latter previously
termed MHC-IIB (see Ennion et al. 1995). However, fibres may comprise more
than one MHC isoform allowing five possible classifications, MHC-I, I-IA, IIA,
IIA-IIX and MHC IIX; these isoforms differ in content between muscle fibre and
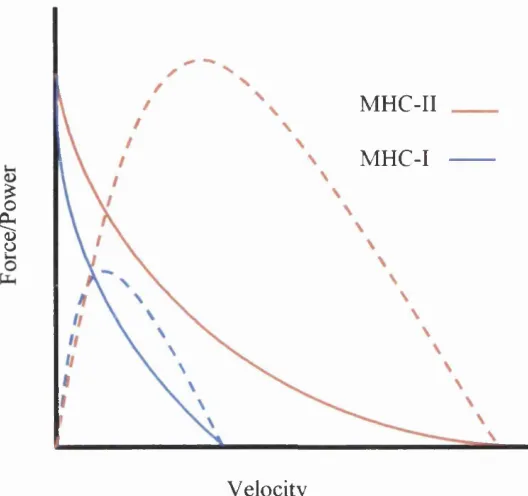
muscles dependant upon the requirements of the muscle. Figure 1 shows the force
- velocity and power velocity relationship of a fibre consisting of slow MHC
MHC-II
MHC-I
I
Velocity
Figure 1.1 An example of typical force (continuous line) and power (dotted line)
velocity relationship of skeletal muscle consisting of slow (MHC-I) and fast
(MHC-II) fibres
The myosin light chains also have different isoforms both slow regulatory
(MLC2s) and fast regulatory (MLC2f), slow alkali (MLCIsa) and fast alkali
(MLClf, MLC3f) (see Schiaffino and Reggiani 1996 for review). It has been
shown in human studies that it is possible for slow light chain isoforms to be
associated with fast heavy chain isoforms and visa versa (Larsson and Moss
1993).
Barany, (1967) and Close (1972) showed an association between muscle fibre
myofibrillar ATPase as determined by histochemistry. Later Burke et al. (1971)
and Kugelberg (1973) related the fatigability twitch times and tension
development of motor units to fibres within the motor units classified by their
mitochondrial enzyme content. This led to the classification based on the
mechanical properties of the fibres, slow, relatively low tension, fatigue resistant
fibres (SO), fibres which were faster but more readily fatigued and developed
moderate tension (FOG), and fibres which were faster still, developed higher
tension but were more readily fatigued (FF). The characteristics of twitch and
tension development can overlap between motor units of different classification,
whereas the properties of fatigability and the presence or absence of the ‘sag’
phenomenon in short unfused tetani do not overlap.
MHC composition - single fibre studies
Larsson and Moss (1993) were among the first to demonstrate a relationship
between the MHC isoform content of skeletal muscle and the mechanical
properties. It was shown that the maximum shortening velocity (Vmax) was highly
dependant on the MHC isoform composition. More recently Harridge et al. (1996)
demonstrated that muscle fibres classified by the MHC isoform content closely
related to the in vitro muscle properties. Fibres containing MHC-I isoforms had
markedly lower values for maximum speed of shortening, rate of tension
development and specific tension than fibres containing MHC-IIA isoforms,
whilst fibres containing both MHC-IIA and IIX had higher values for maximum
speed of shortening, rate of tension development and specific tension than those
classified according to their MHC isoform composition, the Vmax, Wmax, Vopt, Popt,
Vopt/Vmax ratio, Po/CSA and Vo were all significantly lower in MHC-I fibres
compared to MHC-II fibres. Hilber and Galler, (1997) reported that in human
fibres the “kinetics of force generating power strokes” was MHC isoform specific.
MHC composition - whole muscle studies
It has been shown in human studies that the twitch properties of the whole muscle
reflects the fibre composition of the whole muscle, the triceps surae for example
which has a predominantly slow fibre composition, has been recorded as having a
time to peak tension of 112 ms ± 11.1 (Sale et al. 1982), this is in good agreement
with that of Davies, (1982) who reported values of 111 ± 20 ms for time to peak
tension for the triceps surae muscle in young men (mean age 22 years). Muscles
of the eye (orbicularis oculi) which contain predominantly fast fibres, have been
recorded as having twitch times of 43 ms ± 4.3 (McComas and Thomas, 1968). In
contrast to single fibre studies, whole muscle studies are complicated by the
arrangement of fibres, joint mechanics and activation of fibres. Aagaard and
Andersen (1998) have reported that the MHC-II isoform composition of the
human quadriceps femoris muscle is correlated to the peak torque generated
during isokinetic contractions at medium (120® sec'^) and high (240® sec'^)
contraction velocities. Jurimae et al. (1997) showed that in bodybuilders,
endurance rowers, and controls, the percentage MHC - II isoform content of the
triceps brachii was associated with measures of strength using isoinertial,
isokinetic and isometric loading protocols. In elderly subjects where the level of
percentage of fast myosin of the triceps surae was significantly associated with the
normalised torque at 5 rads sec'^ (Harridge et al. 1995).
y) ACTIVATION OF MUSCLE
The basic unit of contraction is the motor unit, which consists of an innervating
neuron and associated muscle fibres (Sherrington 1929). Henneman, (1965) first
proposed the size principle whereby the motor units consisting of smaller
diameter axons and slower fibres would be activated first, the larger motor units
being activated as the requirement increased towards maximum.
The number of motor units in a given muscle will depend upon the function of the
muscle. A muscle that is required to carry out fine tasks involving small forces
will have a low innervation ratio i.e. will preferentially contain a small number of
muscle fibres per motor units, in contrast to muscle which is required to carry out
gross tasks involving large forces. In a given muscle the number (Feinstein et al.
1955) and size (Edstrom and Kugelberg, 1968), of motor units varies
considerably. The motor unit territory has been shown to be in the range of 5 -
10mm, and within these regions between 10 -25 units overlap (Stalberg and
Antoni, 1980). In long muscles such as the hamstrings where the muscle length is
divided into more than one compartment of muscle fibres, the motor unit may
consist of fibres in more than one compartment (Manzano and McComas, 1988).
Gradation of force
The voluntary force generated by a muscle can be graded by a combination of
fibres, or by increasing the rate of firing of the neural impulse. Early experiments
by Adrian and Bronk (1929) showed that subjects were able to increase the force
of contraction by a combination of increased recruitment of motor units and
increased rate of firing. Experiments conducted using the spike triggered
averaging technique (Milner-Brown et al. 1973), Milner-Brown et al. (1973),
show that increases in motor unit recruitment in order to increase levels of force
occur at the lower force levels. However, the increases in firing rate to enable
increases in force levels, become more important at the higher forces. This
finding by Milner Brown and co-workers has been suggested by others to depend
upon the muscle under investigation. Kukulka and Clamann (1981) reported that
individual muscles utilised different strategies in order to develop force. The
firing rates of motor units depend upon their type and function, but an individual
motor unit has the ability to increase its rate of firing approximately four fold,
although it has been shown that very high rates of motor neuron discharge can be
observed if force is developed quickly (Tanji and Kato, 1972). It has also been
reported that the lower threshold motor units modulate their firing frequency over
a relatively larger range of forces than the higher threshold units (Monster and
Chan 1977). The threshold for the motor unit recruitment levels for all the motor
units has been shown to decrease as the velocity of contraction increases
(Desmedt andGodaux, 1977, Desmedt and Godaux 1977). This apparent lowering
of the recruitment threshold could lead to an apparent reversal of motor unit
recruitment at the very highest velocities of contraction. Freund, (1983) suggested
transient forces and that the force level would have reached the same level as that
normally seen for the recruitment of a particular motor unit.
2)
IN VIVOMUSCLE TESTING METHODS
Historical perspective
Tests of human muscle dynamic strength and/or power have taken many different
forms over the years. Hill in the 1920’s was one of the earliest investigators to
examine in vivo human muscle output. When muscle output is measured in vivo it
is the torque around the joint which is measured, this is not necessarily reflective
of the forces generated by the muscle fibres or their velocity of shortening.
Factors which make difficult the interpretation of in vivo measurements to that of
in vitro measurements include the pennation angle of the fibres to the line of pull
(Maganaris et al. 1998), and the lever arms arrangement both of which may
change during a dynamic movement. Other factors include the length - tension
relationship which may be affected by the compliance of the muscle - tendon
complex. With these limitations in mind the in vivo properties of muscle have
been examined using different modalities including inertial devices (Wilkie 1950)
and isokinetic dynamometry (Perrine and Edgerton 1978). Wilkie in the 1950’s
used inertial loading to determine the contractile properties of the elbow flexors
under shortening conditions, he showed that the force - velocity relationship was
in agreement with that described by Hill (1938) although in order to arrive at a
hyperbolic fit he had to convert all rotational values to linear values. In the 1960’s
body dynamic actions to determine characteristics such as power output e.g.
Margaria - Kalamen power test (Margaria et al. 1966), this represents an inertial
loading protocol with the addition of gravity, the power output being measured by
the time it takes for the subject to move their body weight a set distance vertically.
Earlier, Sargent (1921) developed the Sargent jump test which related the jump
height achieved to the power generated. Power output has also been determined
using force platforms (Zamparo et al. 1997) here the force reactions to a
movement are measured by the force plate and along with simultaneous
measurements of velocity, are used to calculate power output. Other methods
employed to assess the strength of human muscle include, measures of the
maximum amount of weight that is possible to be lifted for 1 repetition (IRM) or
a set number of repetitions. Static measures of muscle force or strength have
utilised strain gauge systems or calibrated spring gauges in order to determine the
force generation capacity of muscle. Some modem devices such as the isokinetic
dynamometer can test power and strength under a variety of contraction
conditions.
With the advent of computers and improvements in electronic technology in the
1970’s came the development of isovelocity testing apparatus. Among the first to
utilise these devices were Perrine and Edgerton (1978). These tools were quite
unique in that they allowed the velocity of movement to be controlled at a preset
level. This also allowed for a relatively easy method for the determination of in
vivo force-velocity properties of muscle. There has been some discrepancy over
dynamometry under voluntary contraction conditions. Wickiewicz et al. (1984)
reported a lower than expected value of torque at the lower velocities of
contraction, this was suggested to be caused by a neural inhibitory mechanism.
However, James et al. (1994) using femoral nerve stimulation with a release
component examined the force - velocity characteristics of the human quadriceps
and found a good agreement with the hyperbolic curve of Hill (1938).
vil TEST CHARACTERISTICS
Dynamic testing systems can be differentiated on their mechanical characteristics.
The intrinsic mechanical design or physical properties of the different systems
identify the testing devices by the extrinsic loading or control of velocity. Some of
the devices used to dynamically test muscle can incorporate a manipulation of
both loading and velocity parameters.
Mechanical loading can be either constant (isotonic), of a viscous nature, or
inertial. Most devices will have a combination of the above factors, but will have
a predominance of one. The time history of the loading characteristics of the
device can also be manipulated; it is possible to control the loading to enable
preloading or afterloading. A device that allows the muscle to generate a pre set
level of force prior to movement identifies preloading, whereas an after loading
device is one which allows for manipulation of the loading during the movement
period. Both these conditions can be provided by modern isokinetic apparatus.
Speed of movement can either be constant (isokinetic devices), or if acceleration
applied force. Each particular method of testing has its own advantage and
disadvantage. With regard to the fimctional testing of muscle, the specificity of
the test will reflect its fimctional significance. Inertial loading for instance has the
advantage of closely reflecting the muscle loading seen in everyday use.
Functional test results obtained using one particular method cannot usually be
compared easily with those using an alternative method due to the individual way
in which each device loads a muscle.
Muscle functional testing
Each method of either isokinetic, isoinertial or isoviscous tests of dynamic muscle
function, present a unique mechanical challenge to the muscle under test. The
time history of both torque and velocity are different dependant upon which test
modality is used. Figure 1.2 shows typical force and angular velocity time traces
I
î
I
B
10
5
0
0 0.2 0.4 0.6 0.8 1.0 0 0.2 0.4 0.6 0.8 1.0
Force Velocity
Time (s)
200
M
100 S
0 0.2 0.4 0.6 0.8 1.0
Figure 1.2. Typical traces of dynamic muscle contractions against isotonic (A),
isokinetic (B) and isoviscous (C) test modalities. From Itoh et al. (1997)
Each method has its advantages and disadvantages in terms of its utility for
functional testing. The method that has been most broadly employed is isometric
testing; this is generally thought of as the gold standard for muscle strength
testing, as generally static measures of strength are more controllable than
dynamic measures. However the external validity in terms of functional relevance
is questionable for measures of static strength.
Isometric testing
Muscle strength can be defined as the ability to produce maximum force. Strength
can be defined in both dynamic and static terms. Both force and torque, which
strength of a muscle. The force producing capability of a muscle is a product of
the muscle cross sectional area and also the fibre type and architecture.
Isometric strength has been defined by Sale (1991) as, “The peak force or torque
developed during a maximal voluntary contraction under a given set of
conditions”. The use of isometric dynamometry has been shown to be reliable in
use when recording maximal voluntary contractions of elderly population groups
(Davies and White 1983, McDonagh et al. 1984, Hunter et al. 1998, Winegard et
al. 1996).
In terms of the validity of the measure to assess the physiology/morphology of the
muscle under test, the general consensus is that tests of isometric strength give
reasonable estimates of the muscle morphology in terms of its cross sectional area.
Hakkinen and Keskinen (1989) report a correlation of R = 0.7 between the
isometric strength and muscle cross sectional area for the quadriceps muscle.
Fiatarone et al. (1990) reported that the IRM of the quadriceps was significantly
associated with the mid thigh muscle area (R = 0.7) in elderly subjects (mean age
90 ± 1 year). In agreement, Harridge et al. (1999) showed that the lean cross
sectional area of the mid thigh was significantly associated with the maximum
isometric force in elderly men and women.
With regard to the association of isometric strength and muscle fibre type, some
ambiguity is seen in the literature. Tesch and Carlsson (1978) looked at the
relationship between muscle fibre type and isometric strength in physical
that fibre type distribution was an important factor in isometric strength output.
Young (1984) reported a ‘weak’ correlation (R = 0.55) between the ratio of the
quadriceps strength to the cross sectional area and percentage of type II fibres
contained in a biopsy sample. Maughan and Nimmo (1984) reported that a
relationship existed between the isometric strength and cross sectional area of the
quadriceps in young males (R = 0.7), however they reported no relationship
between the relative fibre composition and isometric strength. Similarly,
Thorstensson et al. (1976) reported no significant relationship between muscle
fibre composition and isometric strength.
Several researchers, again with a varying degree of association, have investigated
the relationship between isometric strength and functional tasks. Hakkinen (1991)
examined the isometric strength of the leg extensors, and its relationship to jump
height in male and female basketball players, a correlation of 0.8 was reported. In
contrast Considine and Sullivan (1973) examined the relationship between a
number of isometric strength tests and tests of jump and sprint performance. They
concluded that there was no relationship between isometric strength and dynamic
performance from the correlation coefficients o f-0.19 - 0.36. It could be said that
one reason for the poor correlations may be that the experiments did not take in to
account the angle at which peak dynamic strength is expressed as per the
suggestion of Wilson and Murphy, (1995). However Strass (1991) utilised
measures of isometric strength at the angles of significance for the dynamic
and Sullivan (1973), they were still only average between the two measures (r =
0.49-0.51).
Isokinetic testing
Isokinetic methods of determining muscle fimction have been in general use for a
number of years. A modem isokinetic dynamometer consists of a head unit, to
which the lever arm and load cell are attached. A servomotor is contained in the
head unit in order to control the movement velocity.
The basis of isokinetic dynamometry is that the velocity of movement is
controlled at a preset level. The modem isokinetic dynamometers can be operated
in a number of different modes and are generally described as accommodating
resistance devices. In concentric mode an isokinetic dynamometer is a passive
afterloading device, it can also be used in active modes to measure eccentric
torques, or the lever arm fixed in order to measure isometric torque.
Most isokinetic dynamometers operate over a range of preset velocities up to
approximately 5.1 rads s '\ although it has been shown that valid measures are
difficult above 2 rads s'\ Some researchers have questioned whether in fact there
is a need to test at such high levels of velocity, questioning the physiological
validity. However this will depend upon the population group selected for testing,
athletes for instance may require a larger range of test velocities than untrained
individuals. Ghena andKurth, (1991) tested subjects at velocities up to >8 rads s'\
James et al. (1994) reported that it was not routinely possible to record forces
mechanical artefacts are present due to the deceleration of the lever arm and limb
inertia. This inertial spike is one source of potential error which is present when
using isokinetic testing devices, the other being errors due to gravity.
On the early isokinetic devices corrections for the effects of gravity were not
made. This has been shown to affect the validity of results obtained where the
movements were made in the vertical plane. Winter et al. (1981) reported that
errors in the range of 26-43% and 55-510% were apparent in flexion and
extension work measurements respectively. Erroneous results were also found in
the angles at which peak torque occurred, with angle error of up to 15 degrees.
The order of the error incurred is said to be larger as the loading decreases and
hence the velocity increases. Modem isokinetic devices correct for the effects of
gravity by utilising the method described by Nelson and Duncan (1983). Here the
passive moment of the combined lever arm and limb under test is determined
within the range of movement, for example during knee extensions the values at
each joint angle are added to the moment determined under concentric actions at
the same angle and subtracted from those eccentric actions.
Sapega et al. (1982) noted that during isokinetic movements an ‘inertial spike’
occurred in the torque record, which could be followed by oscillations of
decreasing amplitude. This event took place at the beginning of the movement and
was termed the ‘torque overshoot’. During the initial movement phase, before the
preset level of velocity has been reached, the limb and lever arm are free to
accelerate. This overshoot phenomenon appeared due to the torque required by the
et al. (1982) showed that during the free acceleration period during a hip
abduction test the velocity reached 200% of the preset level prior to the control
system compensating for the overshoot. As the torque of a moving rotational
system is proportional to the acceleration and moment of inertia of the system,
therefore the greater the mass and/or the further from the centre of rotation, the
greater the torque potential and hence the torque overshoot.
Various methods have been employed in order to reduce the torque overshoot.
Damping of the lever arm is one method that has been used in order to alleviate
the torque overshoot. The damping effect however results in changes to the torque
output record. Sinacore et al. (1983) reported that by damping the lever arm, the
torque record throughout the movement was reduced and shifted in time.
Therefore various researchers have suggested that damping is not a suitable
method of reducing the torque overshoot (Murray and Harrison, 1986).
Controlling the initial acceleration period was another method used in order to
reduce the initial overshoot. Gransberg and Knutsson (1983) using a control
mechanism to apply a resistive force during the initial acceleration phase found
that the torque overshoot and subsequent oscillations were reduced, allowing a
smooth transition from rest to the predetermined level of velocity. However the
time required to reach the preset velocity was increased, thereby introducing a
phase shift. It seems that the approach used by Perrine and Edgerton (1978),
which involves using only the section of the torque record that occurs during a
constant velocity phase of the movement, represents an empirical compromise,
Other approaches using isokinetic loading include cycling (Sargeant et al. 1977,
Sargeant et al. 1981, Davies et al. 1984). The use of isokinetic loading in this
protocol allows the peak power output to be determined and the associated
velocity at which peak power occurs (Vopt). The Vopt and maximal power output
obtained during isokinetic cycling has been suggested to be representative of the
general fibre population of the active muscles (Sargeant 1994). For expansion on
this point see Chapter 4.
Viscous testing
The property of these devices can be thought of as having qualities of resistance to
flow in a fluid or semi fluid, the coefficient of viscosity being the ratio of the
tangential frictional force per unit area to the velocity gradient perpendicular to
the direction of flow of a liquid. A viscous system can take different forms; it can
be presented as an electromagnetic braked device (e.g. electrically braked cycle
ergometer), air filled or a fluid filled resistive device. Grieve and Linden (1986)
used a fluid filled device to examine the characteristics of horizontal pulling. The
resistance to movement was described as being proportional to the square of the
velocity of movement. Here it can be said that the resistance to movement is
proportional to the applied force, the system acting as an accommodating
resistance device. However unlike isokinetic devices, hydrodynamic devices
allow for constantly changing force and velocity. Therefore viscous systems can
be thought of as having some of the characteristics of both inertial and isokinetic
Inertial testing
An inertia can be defined as, “that which resists change”, and is a function of an
objects mass. The properties of inertia are described by Newton’s first law which
states that, “Every object persists in a state of rest or uniform motion in a straight
line unless compelled by an external force to change that state”. The
characteristics of accelerating inertias are explained using Newton’s second law
which states that whenever an object accelerates, the acceleration is:
-a) directly proportional to the NET force acting on the object;
b) pointing in the same direction as the net force; and
c) inversely proportional to the mass of the object.
Testing muscle function using inertial loading has certain advantages, these being
that an inertial load best represents the type of challenge that muscles face in the
physical environment, and also an inertial loading device is relatively cheap.
However, a disadvantage from an experimental point of view is that it is not
possible to control either force or velocity when the muscle contracts under
inertial loading conditions. Inertial devices have been in use for many years. Best
and Partridge (1928) were one of the first to use a system to examine in vivo
human muscle using a combination of inertia and friction. Most free weight
systems can be thought of as pseudo inertial systems in that they usually consist of
an inertial and gravity component. The system which closest mimics a pure inertia
Wilkie (1950) used a pseudo inertial loading system to determine the force
velocity properties of the elbow flexors. He concluded that after corrections to
allow the rotational components to be expressed as horizontal components that the
in vivo force velocity characteristics of the elbow flexors agreed with Hill’s
hyperbolic relationship. Murphy et al. (1994), used a combination of isoinertial
and isometric testing apparatus on a group of weight trained individuals. The
scores were compared to their ability to carry out a series of dynamic tests; it was
found that in all cases, the isoinertial testing modality gave the highest
correlations when compared with the dynamic task.
Bassey and Short (1990) devised an apparatus comprising of a fixed inertial
flywheel to determine the average power output of the lower limbs during a single
lower limb thrust. This was designed to provide a safe convenient and valid
method of testing ‘explosive’ power in frail elderly people where performing
other tasks would be either impossible to perform or have a high risk of injury.
However the method used to determine the exertion time which is used in the
calculation of average power, was an estimate rather than a direct measure. This
estimation method in order to be valid relied on certain assumptions with respect
to the acceleration profile during the exertion. See Chapter 1 for further discussion
of this point.
Inertial cycling
More recently investigators have used cycling, as this incorporates a spinning
wheel which allows for the repeated acceleration of the load in contrast to a single
output. Lakomy (1986) criticised the standard friction braked cycle tests for not
taking account of the inertial component. He suggested that during cycling, the
work done in transferring energy to an inertial flywheel whilst accelerating would
be of significance. He found that by including an inertial component, if the
frictional load was added after the wheel was up to speed the measured power was
approximately 6% less than without the inertial component. Whereas if the subject
started from rest with the load applied, the corrected values were 32% higher than
those not taking the inertial component into account. This can be explained by the
fact that a large energy component is required to accelerate the inertial load, and
as torque is proportional to acceleration, the larger the acceleration the greater the
torque component.
Lakomy (1986) had suggested that in contrast to friction braked cycling
ergometry; inertial loaded cycling power output was independent of the inertial
load (See Chapter 3 for expansion of this point). Martin et al. (1997) used a purely
inertial flywheel to examine the power output characteristics during short term
maximal cycling. In order to monitor the motion of the flywheel an optical sensor
and slotted disk system was used, this allowed for a resolution of 3^ of flywheel
movement. The timing accuracy was quoted as 1 micro second; however, due to
the gearing system used this resolution was reported to introduce random errors
due to the changes in delta time between consecutive slots being less than the
timing resolution. Using a single, relatively high, flywheel inertia (0.396 kgm^),
they concluded that a fixed inertial load is able to provide a valid measure of