STABILITY OF MAIZE HYBRIDS ACROSS ENVIRONMENTS USING GGE
BIPLOT AND AMMI ANALYSIS
Saleem Abid a ,
Saleem Zahid b
a Statistics and Computing Program, Social Sciences
Research Institute, PARC National Agricultural Research Centre, Islamabad, Pakistan.
b Institute of Business and Management Sciences, The University of Agriculture, Peshawar, Pakistan.
[email protected] (Corresponding author) Corresponding Author
ARTICLE HISTORY:
Received: 23-Oct-2018
Accepted: 01-Jan-2019
Online Available: 23-Jan-2019
Keywords:
AMMI analysis, Maize hybrid, GGE biplot, Environments, Stability
ABSTRACT
Twenty six yellow maize hybrids on the basis of stability analysis were evaluated in National Uniform Maize Hybrid Yield Trials conducted across eight diversified environments of Pakistan. Combined analysis of variance based AMMI analysis shown highly significant differences for environments, genotypes and their interactions. The environments explained about 78 percent of the total yield variation followed by genotype by environment interaction. Environment was the main aspect that influences the performance of maize yield in study area. The first two interaction principal component axes (IPCA1 and IPCA2) explained about 63 percent of the grain yield variation due to genotype and genotype by environment interaction (GGE). The GGE biplot analysis shown that entry-2 (Mex-YLHY2) was the most stable hybrid and can be considered as adaptable to all the environments.
Contribution/ Originality
The main objective of this study was to identify the promising maize hybrid for their adaptability and stability using GGE biplot and AMMI Analysis under different agro-climatic conditions in Pakistan.
DOI: 10.18488/journal.1005/2018.8.2/1005.2.188.194 ISSN (P): 2304-1455/ISSN (E):2224-4433
How to cite: Saleem Abid and Saleem Zahid (2018). Stability of maize hybrids across environments using GGE biplot and AMMI analysis. Asian Journal of Agriculture and Rural Development, 8(2), 188-194.
© 2018 Asian Economic and Social Society. All rights reserved.
Volume 8, Issue 2 (2018): 188-194
1. INTRODUCTION
In Pakistan, maize is cultivated in an area of 1334 thousand hectares resulting with total production of 6130 thousand tonnes with an increase of 16.3% over previous year production of 5271 thousand tonnes (Government of Pakistan, 2017). Moreover, there is a big gap between actual and potential yield of maize within Pakistan. The demand for maize has significantly increased due to the extension in the poultry and livestock industries (Kabir, 2009). Maize has a diverse genetic crop and can be planted in different agro-ecological zones. Improved maize varieties give high and stable yields in the environment where adopted. The improved hybrids should have the charcteristics of adoptibility across a wide range of different environments (CIMMYT, 1991). Stability of a hybrid over different locations is needed feature and depends upon the size of hybrid and enviroment interactions (Ahmad et al., 1996). The genotypes are considered stable if their variations among environments are small, which is called statistical stability. A stable genotype does not change or at least change the performance, regardless of changes in the environmental conditions (Baker and Leon, 1988). There are two types of stability measures: non-parametric and parametric (multivariate and univariate) stability measures. The main problem in nonparametric and univariate stability statistics is that it cannot provide a real picture of the complete response pattern, as the genotype‘s response is of multivariate nature in different environments (Lin et al.,
1986; Akpan and Udoh, 2017). Hence, using multivariate analysis i.e. additive main effects and
multiplicative interactions (AMMI) model is more useful for description of genotype by environment interaction (GEI) than univariate stability methods (Crossa et al., 1990). AMMI model improve the accuracy of yield estimates when the main effects and interaction effects are important. The AMMI method pools principal component analysis (PCA) and Analysis of Variance (ANOVA) into an integrated approach. In this approach, the adjustment is done by using the information from other environments to refine the estimates within a given environment
(Sadeghi et al., 2011). A number of researchers have accomplished substantial work on stability
analysis using AMMI analysis and GGE biplot analysis for different crops such as Munawar et al.
(2013); Banik et al. (2010); and Francis and Kannenberg (1978) for maize crop, Wieslaw et al.
(2011); Crossa et al. (1990); Kaya et al. (2002) for wheat crop, Kilic (2014) for barley crop,
Mahalingam et al. (2006) for rice crop; and Sadeghi et al. (2011) for tobacco crop. The main
objective of this study was to identify the promising maize hybrid for their adaptability and stability using GGE biplot and AMMI Analysis under different agro-climatic conditions in Pakistan.
2. MATERIALS AND METHODS
This study was conducted with a view to identify the most stable hybrid of maize crop across different environments. For this purpose twenty six maize hybrids were tested in eight diversified environments of Pakistan; Islamabad, Yousaf Wala, Vehari, Sahiwal, Lahore, Dadu, Faisalabad and Nowshera. These maize hybrids were FB-1142, Mex-YLHY2, 6619, 6655, ST-6253, ST-6293, Kolosseus, BP-3, KXB-2572, HSM-34, Tara-G-866, Tara-LP-1243, 20-R-52, Mex-YLHY1, Mex-YLHY3, Mex-YLHY4, Mex-YLHY5, MSM-1, Y.W- Hybrid, Y.W- 1898, 1515, 1516, 1616, 1046, FH-1036, and Monsanto. The experiment was designed in a randomized complete block design with three replications, in all locations. The combined analysis of variance was performed for the eight environments and then genotype by environment interaction was divided according to additive main effects and multiplicative interactions (AMMI) model Gauch and Zobel (1997). Additive main effects and multiplicative interactions analysis pools principal component analysis (PCA) of the G x E interaction with the analysis of variance for the genotype and environment main effects
1 n
ij i j k ik jk ij k
Y
G
E
e
where Yij is the maize yield of ith genotype in jth environment; Gi and Ej are the genotype and environment deviations from the grand mean, respectively; μ is the grand mean;
kis the eigenvalue of the principal component analysis axis k;ik
andjk
are the genotype and environment principal component scores for axis k; n is the number of principal components retained in the model and
e
ijis the error term. The GGE biplot and AMMI analysis were carried out using GEA-R software (CIMMYT, 2015).3. RESULTS AND DISCUSSION
The performance of hybrid can change when grown in diversified environments, demonstrated by fluctuations in the relative ranking of hybrid over environments. The hybrids commonly retained in a breeding program are those having a high mean performance, as hybrids are seldom selected on the basis of their performance in specific environments. The mean performance of grain yields for twenty six maize hybrids and their combined means across eight environments were presented at Table-1. The mean of grain yield of maize hybrids across the environments showed significant variations in ranks among the hybrids, which demonstrate high hybrid and location interactions
(Baker, 1988). Statistically significant differences were observed for mean grain yield among the
hybrids in all the eight environments of the study. The mean grain yield over environments ranged from 6.905 tons ha-1 (Y.W- Hybrid) to 11.026 tons ha-1 (ST-6293) with a grand mean of 9.086 tons ha-1. Out of twenty six 13 of the hybrids (50%) had above the mean average yields (Table 1). The ST-6293 was found to be the highest yielding maize hybrid giving the mean yield of 11.026 tons ha-1 followed by FH-1036 (10.507 tons ha-1), ST-6253 (10.062 tons ha-1) and so on, whereas Y.W- Hybrid (6.905 tons ha-1) produces the lowest yield combined over the environments.
Table 1: Mean performance of grain yields for twenty six maize hybrid (tons ha-1) and their combined means across eight Environments of Pakistan
S# Maize Hybrid
Environments
Hybrid Means
1 2 3 4 5 6 7 8
Islamabad Yousaf
17. Mex-YLHY5 11.04 12.72 12.27 11.31 10.05 4.26 7.71 3.23 9.073 18. MSM-1 11.73 11.42 11.12 14.82 7.83 3.62 8.11 4.61 9.156 19. Y.W- Hybrid 4.72 10.78 10.07 8.77 5.10 4.03 7.49 4.29 6.905 20. Y.W- 1898 8.17 11.33 11.82 6.79 5.09 4.87 8.66 5.35 7.761 21. 1515 12.65 10.97 12.24 12.67 11.41 4.96 8.40 4.17 9.682 22. 1516 10.28 10.87 10.89 13.92 10.31 4.58 9.35 4.74 9.369 23. 1616 12.49 11.44 12.30 11.92 7.85 5.41 10.11 4.97 9.561 24. FH-1046 11.12 8.84 10.41 9.05 6.32 5.04 11.75 4.41 8.366 25. FH-1036 15.62 11.09 11.95 15.54 10.24 3.47 12.11 4.05 10.507 26. Monsanto 12.18 12.40 11.50 14.94 8.80 4.03 8.37 4.19 9.552 Locations Means 11.43 11.44 11.26 12.16 8.95 4.44 8.44 4.57 9.086
Underlined values are highest yields at each test environments. LSD0.01 (Locations) = 0.2796; LSD0.01
(Hybrids) =0.5041
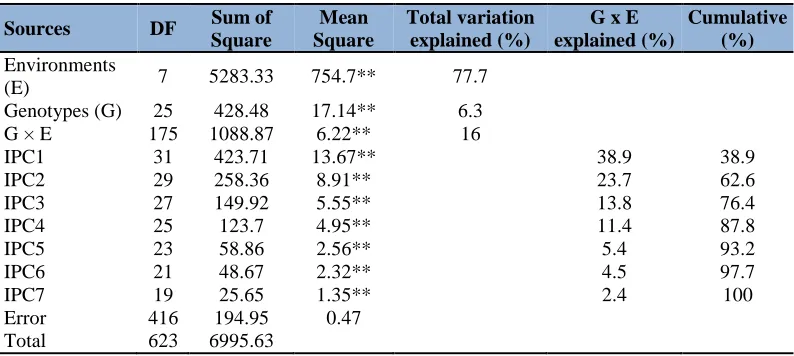
Combined analysis of variance for grain yield based on AMMI model is presented in Table 2. The results of analysis of variance showed statistically highly significant differences (P<0.01) for genotypes, environments and their interaction. The interaction principal component axis (IPCA) are ordered according to decreasing contribution to variation. The F-test was statistically highly significant (P<0.01) for all the IPCA axes. The environments explained 77.7% of the total yield variation followed by the G × E interaction (16%). Genotypes contributed only 6.3% which indicates that in the multi environment trials (METs) genotypes contribute the least to the total variation. The environment is a major factor that affecting maize productivity in most parts of the study area. The first seven IPCA axes are highly significant and explained 100% of the G x E interaction. The first two interaction principal component axes (IPCA1 and IPCA2) explained 62.6 percent of the grain yield variation due to genotype and genotype by environment interaction (GGE).
Table 2: AMMI analysis of variance of grain yield of maize trails over eight environments
Sources DF Sum of
Square
Mean Square
Total variation explained (%)
G x E explained (%)
Cumulative (%) Environments
(E) 7 5283.33 754.7** 77.7
Genotypes (G) 25 428.48 17.14** 6.3
G × E 175 1088.87 6.22** 16
IPC1 31 423.71 13.67** 38.9 38.9
IPC2 29 258.36 8.91** 23.7 62.6
IPC3 27 149.92 5.55** 13.8 76.4
IPC4 25 123.7 4.95** 11.4 87.8
IPC5 23 58.86 2.56** 5.4 93.2
IPC6 21 48.67 2.32** 4.5 97.7
IPC7 19 25.65 1.35** 2.4 100
Error 416 194.95 0.47
Total 623 6995.63
**P < 0.01; Grand Mean = 9.09; CV = 7.43%; IPC = Interaction principal component axis
stable as it is the closest to the IPCA1 axis and can be considered as adaptable to all the environments.
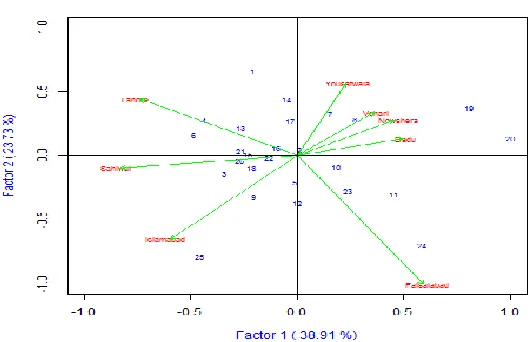
Figure 1: Biplot analysis of GEI for the PCA1 scores and grain yield of 26 maize hybrids across eight environments
The GGE biplot analysis based on AMMI model for the first two IPC scores (PC1 vs PC2) was presented in Figure-2. The GGE biplots based on the performance of 26 maize hybrids evaluated under 8 environments were constructed based on the values of the first two interactions principal component scores (PC1 and PC2) which explained 62.6% of the grain yield variation due to genotype and G x E interaction (Figure 2). Figure-2 shows the association or relationship between the different environments. Faisalabad was the most discriminating environment due to its longest distance from the origin of the biplot. Environments with small vector angles tend to have closer similarity and those with wide vector angles show minimum association. Similarly the rug plot also displays the proximity among the different environments based on the angle variation of the vectors. All the managed drought environments were displayed close to each other as their deviation from each other was small.
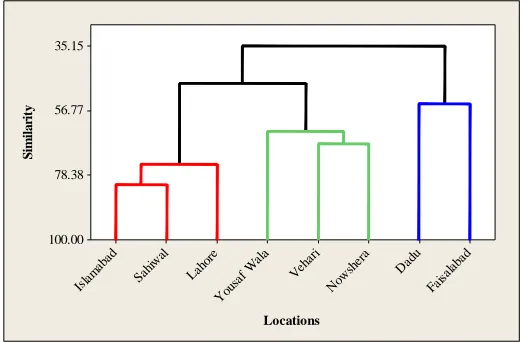
The dendrogram (Figure 3) displays the information in the form of tree diagram in our experiment, locations Islamabad, Sahiwal, Lahore make-up the first cluster; locations Yousaf wala, Vehari, Nowshera make-up the second cluster and Dadu and Faisalabad make-up the third cluster on the basis of similarity levels of environment.
Figure 3: Dendrogram showing clustering of eight locations of experiment
4. CONCLUSION
The combined analysis of variance based on AMMI analysis shown highly significant differences for environments, genotypes and their interactions. The environments explained about 78 percent of the total yield variation followed by genotype by environment interaction. Environment was the main aspect that influences the performance of maize yield in study area. The first two interaction principal component axes explained about 63 percent of the grain yield variation due to genotype and genotype by environment interaction (GGE). It was concluded from the study that GGE biplot analysis shown that entry-2 (Mex-YLHY2) was the most stable hybrid and can be considered as adaptable to all the environments.
Funding: This study received no specific financial support.
Competing Interests: The authors declared that they have no conflict of interests.
Contributors/Acknowledgement: All authors participated equally in designing and estimation of current research.
Views and opinions expressed in this study are the views and opinions of the authors, Asian Journal of Agriculture and Rural Development shall not be responsible or answerable for any loss, damage or liability etc. caused in relation to/arising out of the use of the content.
References
Ahmad, J., Choudhery, M., Din, S. S., & Ali, M. A. (1996). Stability for grain yield in wheat. Pak.
J. Bot., 28, 61-65. view at Google scholar
Akpan, E. A., & Udoh, V. S. (2017). Evaluation of Cassava (Manihot Esculenta crantz) Genotype for Yield and Yield Component, Tuber Bulking, Early Maturity in Cross River Basin Flood Plains, Itu, Akwa Ibom State, Nigeria. Canadian Journal of Agriculture and
Crops, 2(2), 68-73.
Baker, H. C., & Leon, J. (1988). Stability analysis in plant breeding. Plant Breeding, 101, 11-23.
view at Google scholar /view at publisher
Fais alab
ad Dad
u
Now sher
a Veh
ari
You saf
Wal a Laho
re Sahi
wal Isla
mab ad
35.15
56.77
78.38
100.00
Locations
S
im
il
a
ri
Baker, R. J. (1988). Tests for crossover Genotype × Environment interactions. Canadian J. of
Plant Sci., 68, 405-410. view at Google scholar
Banik, B. R., Khaldun, A. B. M., Mondal, A. A., Islam, A., & Rohman, M. M. (2010). Assessment of genotype-by-environment interaction using additive main effects and multiplicative interaction model (AMMI) in maize hybrids. Academic J. Plant Sci., 3(4), 134-139.view at
Google scholar /view at publisher
CIMMYT. (1991). High yielding varieties do not necessary yield less under unfavorable
conditions. CIMMYT. Annual Report 1990. Mexico DF.
CIMMYT. (2015). Genotype × Environment analysis with R for Windows (GEA-R) Version 2.0 statistical software.
Crossa, J. P., Fox, N., Pfeifer, W. H., Rajaram, S., & Gauch, H. G. (1990). AMMI adjustment for statistical analysis of international Wheat yield trial. Theoretical and Applied Genetics, 81, 27-37. view at Google scholar
Francis, T. R., & Kannenberg, L. W. (1978). Yield stability studies in short season maize. I. A descriptive method for grouping genotypes. Can. J. Plant Sci. 58, 1029-1034. view at
Google scholar/view at publisher
Gauch, H. G., & Zobel, R. W. (1997). Identifying mega-environments and targeting genotypes.
Crop Science, 37, 311-326. view at Google scholar/view at publisher
Government of Pakistan. (2017). Pakistan economic survey 2016-17. Economic Adviser’s Wing,
Finance Division, Islamabad.
Kabir, A. K. (2009). Effect of water stress on imbibition, germination and seedling growth of maize cultivars. Sarhad J. Agric., 25(2), 165-172. view at Google scholar
Kaya, Y., Palta, C., & Taner, S. (2002). Additive main effects and multiplicative interactions analysis of yield performances in bread wheat genotypes across environments. Turk J.
Agric. Forestry., 26, 275-279. view at Google scholar /view at publisher
Kilic, H. (2014). Additive main effects and multiplicative interactions (AMMI) analysis of grain yield in barley genotypes across environments. Journal of Agricultural Sciences, 20, 337-344. view at Google scholar /view at publisher
Lin, C. S., Binns, M. R., & Lefkovitch, L. P. (1986). Stability analysis where do we stand?. Crop
Sci., 26, 894-900. view at Google scholar /view at publisher
Mahalingam, L., Mahendran, S., Chandra, B. R., & Atlin, G. (2006). AMMI Analysis for stability of grain yield in rice. International Journal of Botany., 2(2), 104-106. view at Google
scholar/view at publisher
Munawar, M., Ghazanfar, H., & Shahbaz, M. (2013). Evaluation of maize hybrids under different environments by GGE biplot analysis. American-Eurasian J. Agric. and Environ. Sci., 13(9), 1252-1257. view at Google scholar
Sadeghi, S. M., Samizadeh, H., Amiri, E., & Ashouri, M. (2011). Additive Main Effects and multiplicative interactions (AMMI) analysis of dry leaf yield in tobacco hybrids across environments. African J. Biotechnology., 10(21), 4358-4364. view at Google scholar /view at publisher