O R I G I N A L R E S E A R C H
Chronic Pain Patients
’
Kinesiophobia and
Catastrophizing are Associated with Activity
Intensity at Different Times of the Day
This article was published in the following Dove Press journal: Journal of Pain Research
Matthew B Miller 1 Melissa J Roumanis1 Lisa Kakinami2,3 Geoffrey C Dover1,3,4
1Department of Health, Kinesiology, and Applied Physiology, Concordia University, Montreal, Canada;2Department of Mathematics & Statistics, Concordia University, Montreal, Canada;3PERFORM Centre, Concordia University, Montreal, Canada;4Centre de Recherché Interdisciplinaire en Réadaptation du Montréal Metropolitain, Montreal, Canada
Purpose: To examine the relationship between baseline kinesiophobia and baseline pain catastrophizing with the 4-day average activity intensity at different times of the day while accounting for different wake and sleep-onset times in chronic pain patients.
Methods:Twenty-one participants suffering from idiopathic chronic pain completed base-line questionnaires about kinesiophobia, catastrophizing, disability, depression, and pain. We measured the participants' activity using accelerometers and calculated activity intensity in the morning, afternoon, and evening. We performed a 2-way repeated measures ANOVA to compare activity levels at different times of the day, and multiple linear regressions.
Results: Baseline kinesiophobia was significantly associated with 4-day average evening light activity and sedentary activity at all time periods while baseline catastrophizing was
significantly associated with increased 4-day average light activity in the evening and more
moderate to vigorous activity in the morning. Our participants engaged in more light activity on average than sedentary activity, and very little moderate-vigorous activity. Participants were most active in the afternoon.
Conclusion: Baseline kinesiophobia and baseline catastrophizing were not associated with the 4-day average total daily activity; however, they were associated with 4-day average activity intensities at different times throughout the day. Segmenting daily activity into
morning, afternoon, evening may influence the relationship between daily activity, and
kinesiophobia and pain catastrophizing. Individuals with chronic pain are less sedentary than previously thought which may affect future interventions.
Keywords:accelerometer, physical activity, pain, Tampa Scale, sedentary, daily activity
Introduction
Chronic pain is a complex condition that can negatively impact many aspects of an
individual's life.1 Chronic pain has physical consequences (such as loss of
inde-pendence, reliance on pain medication, reduced physical capacity), and psycholo-gical consequences (such as emotional distress, insomnia, and impaired social and
work-related function).2–4 Sedentary behaviour resulting from chronic pain is
linked to increased depressive symptoms. For example, inactive individuals have double the chance of developing depressive symptoms compared to healthy
individuals.5,6People who experience chronic pain live a more sedentary lifestyle
compared to the general population, leading to several health conditions such as cardiovascular disease, obesity, type II diabetes, cancer, and decreased quality of
life.7–9
Correspondence: Matthew B Miller Department of Health, Kinesiology, and Applied Physiology, Concordia University, L - SP 165.28, Richard J. Renaud Science Complex, 7141 Sherbrooke W, Montreal, Canada
Tel +1 514-848-2424 ext. 3304 Fax +1 514-848-8681
Email [email protected]
Journal of Pain Research
Dove
press
open access to scientific and medical research
Open Access Full Text Article
Journal of Pain Research downloaded from https://www.dovepress.com/ by 118.70.13.36 on 24-Aug-2020
Most multidisciplinary clinics that treat chronic pain focus on improving function; therefore, accurately measur-ing function is critical. Assessments of physical activity or physical function can be self-reported questionnaires, clinical tests, or accelerometers. Questionnaire-based assessments of
physical function, such as the Pain Disability Index (PDI)10
and the 36-Item Short Form Health Survey (SF-36),11are
often used as a cost-effective strategy to assess subjective
physical function in the chronic pain population.
Questionnaire-based assessments are a qualitative method of assessment and are open to interpretation or bias from
the patient.8,12An objective, but more expensive alternative,
is the free-living assessment of physical activity and function
using wearable accelerometers.13 Increasing function
through activity participation and enhancing quality of life are treatment goals for the chronic pain population, but fear of movement or re-injury (kinesiophobia) can hinder
rehabi-litation outcomes.14
Kinesiophobia and pain catastrophizing are related to rehabilitation outcomes in chronic pain, but the relationship between kinesiophobia and pain catastrophizing, and
activ-ity is unclear.14–17 In the chronic pain population,
kinesio-phobia is more disabling than pain itself,15thus, prolonging
rehabilitation and worsening the chronic pain
experience.15,18,19 Due to the association between
kinesio-phobia and disability,20treatment has focused on increasing
activity levels, quantifying activity goals, and changing
patients’ behaviours and perceptions towards pain, rather
than solely focused on decreasing pain levels.21–23
Changing patients’ behaviour is challenging and involves,
for example, explaining to the patient that just because they are in pain, it does not mean they should limit their
activity.24The association between kinesiophobia and
phy-sical activity implies that people with chronic pain are less
likely to participate in an active lifestyle.25 However, the
relationship between kinesiophobia and pain catastrophiz-ing, and daytime movement is inconsistent in the literature. The relationship between kinesiophobia, pain catastrophiz-ing, disability, and depression and total activity is complex. Song et al (2012) and Elfving et al (2007) indicate there is a relationship between kinesiophobia, pain catastrophizing,
disability, and depression and activity levels,5,26,27 while
Carvalho et al (2017) suggest there is no association.26The
inconsistency in these results may be due to the methodol-ogy of activity measurement. Individuals in chronic pain experience sleep disturbances in the form of varying wake
times, several night-time awakenings, poor sleep efficiency,
and general insomnia.28,29Therefore, collecting activity data
during the time each participant is awake may be more accurate than standard time periods (ie, morning from 6am to 12pm). Previous authors suggest future projects should
investigate the influence of perceived disability and
kinesio-phobia on the activity levels of people with chronic pain using both questionnaires and accelerometers to assess
activ-ity intensactiv-ity and disabilactiv-ity.13,30To date, there are no studies
that associate kinesiophobia and pain catastrophizing to daily activity segmented by time of day and activity intensity using an accelerometer to assess the activity habits of indi-viduals with chronic pain.
The purpose of our study is to determine if measuring activity based on wake and sleep times and by separating activity into the morning, afternoon, and evening would
influence the relationship between baseline kinesiophobia
and baseline pain catastrophizing, with activity in chronic pain patients. The a priori hypotheses include: 1) People who suffer from chronic pain will participate in more activity in the afternoon compared to the morning and evening, and 2) Baseline kinesiophobia or baseline cata-strophizing and self-reported disability is associated with sedentary, light, and moderate-vigorous physical activity in the morning, afternoon, and evening.
Materials and Methods
Participants
We recruited 40 participants from a waiting list for a multidisciplinary chronic pain program, which has
occurred in other studies.31,32 All participants suffered
from idiopathic chronic pain, which is characterized as pain not related to any known disease or injury and pain that cannot better be explained by another chronic pain condition, experienced at least once a week during the last
3 months.33Participants were included in this study if they
were on the waiting list for a chronic pain treatment pro-gram which includes being diagnosed with idiopathic chronic pain. The chronic pain treatment program requires
patients to participate forfive days a week for at least 6 hrs
a day, so participants were typically unemployed or on disability leave. Exclusion criteria included the consump-tion of recreaconsump-tional drugs, being clinically diagnosed with a sleep disorder or seasonal affective disorder, and a current prescription of a sleep aid regimen. Our study was part of a larger study evaluating the relationship between sleep and chronic pain. This study was approved by the Centre de Recherché Interdisciplinaire en Réadaptation du Montréal metropolitain (CRIR-759-0812).
Journal of Pain Research downloaded from https://www.dovepress.com/ by 118.70.13.36 on 24-Aug-2020
Outcome Measures
Tampa Scale of Kinesiophobia (TSK)
The TSK is a 17-item questionnaire designed to assess
a patient’s fear of movement or (re)injury. The total
score ranges from 17 to 68, participants with higher scores are rated as having greater fear of movement. Score
cate-gories for the TSK include: 13–22, subclinical; 23–32,
mild; 33–42, moderate; 43–52, severe.34
Pain Catastrophizing Scale (PCS)
The PCS is a 14-item questionnaire. Participants are asked to rate the thoughts and feelings they experience when in pain using a 5-point Likert scale. The PCS total score ranges from
0–52 and is calculated by summing all items. Pain
catastro-phizing scores can be categorized into rumination, magnifi
-cation, and helplessness, but for the purposes of this study total scores were used in all analyses. The TSK and PCS
have been used in chronic pain populations,35,36 and have
been correlated to poor rehabilitation outcomes, missed
work, and decreased activity in chronic pain patients.14
Beck Depression Inventory (BECK)
The BECK is a 21-item questionnaire designed to measure
the severity of a person’s depression. Scores range from
0–63, with a score of 10–18 indicating mild depression,
a score of 19–29 indicating moderate depression, and
a score greater than 30 indicating severe depression. The BECK has demonstrated good validity and internal
con-sistency in the chronic pain population.37
Pain Disability Index (PDI)
The PDI is a 7-item questionnaire designed to measure perceived disability. Participants rate how pain interferes with their functioning in family/home, responsibilities, recreation, social activities, occupation, sexual behaviors, self-care, and life-support activities. Scores range from 0 to 70, a higher score suggests a higher level of disability
due to pain.38
McGill Pain Questionnaire (MPQ)
The MPQ consists of 78 words that describe qualities of the pain experience. Participants describe the quality and intensity of their pain by selecting the words that best
describe their pain experience. Scores range from 0–78,
with higher scores indicating higher levels of pain.14
Activity
We assessed activity using the Actiwatch Score
(Respironics, Oregon, USA), a wrist-worn activity monitor with a built-in accelerometer. The Actiwatch Score
continually detects and logs movement as activity counts.
The Actiwatch was configured to collect activity counts
each minute with a one-minute epoch length. The wake threshold (at what intensity the accelerometer will record
movement) was set at 20 activity counts per minute.39We
placed the Actiwatch on the wrist to measure activity in our
participants similar to previous studies.40 Some authors
suggest that measuring activity in an older or more physi-cally limited population the wrist is the preferred location compared to the waist. As indicated above, our study is part of a larger study that examined sleep habits in the chronic pain population. Participants accelerometer data were included if they completed four non-consecutive days of 24 hrs wear time (3 weekdays and 1 weekend day).
Procedures
All participants provided written informed consent, and that this study was conducted in accordance with the Declaration of Helsinki. The participants completed the
questionnaires described above, once, on the first day of
the study. Age and sex were self-reported, and height and weight were measured by study staff to calculate body mass index (BMI). After completing the questionnaires, the participants received the accelerometer watch and were instructed to wear the watch on their non-dominant wrist for 24 hrs a day for seven consecutive days, and to only remove the watch for bathing purposes. Participants were instructed to follow their regular daily routines even if it included exercise for the entire seven-day period. Caffeine and tobacco consumption were permitted; however, alco-hol and illicit drugs were not permitted.
Participants were asked to keep a sleep diary recording the approximate time they woke up and fell asleep each day. The participants were informed that the accel-erometer would evaluate their sleep at night but were not told that the accelerometer would always be on and mea-sure movement data during the day. Therefore, the parti-cipants were partially blinded to the activity data collection during the day, which we hoped would contri-bute to a true measure of activity for the participants. See
Figure 1for a research timeline.
Data Analysis
All data from the Actiwatch were downloaded and raw activity data were exported from the Actiware software
(Respironics, Bend, Oregon) to a Microsoft Office Excel
spreadsheet and arranged by day. Daily activity was divided into three segments. The morning segment started
Journal of Pain Research downloaded from https://www.dovepress.com/ by 118.70.13.36 on 24-Aug-2020
from each individual's wake-onset to 12:00pm, the
after-noon segment was 12:00pm–6:00pm, and the evening was
6:00pm–onset of each participant. Wake and
sleep-onset times were calculated based on the sleep diaries and cross-referenced with the readings from the accelerometer. Activity data were segmented into the three categories
based on the number of activity counts.41 In accordance
with previous studies, four non-consecutive days of data were included (three weekdays and one weekend day)
therefore activity was averaged over 4 days.13 Sedentary
time was defined as≤100 activity counts per minute, light
activity was defined as between 101 and 1535 activity
counts per minute, and moderate-vigorous activity was
defined as any activity counts above 1535 counts
per minute.41 We included naps in the daily activity
because napping behaviour is prominent in the chronic
pain population and we wanted to gather data on a full day’s
activity. Questionnaire data for the TSK, PCS, MPQ, and PDI were transferred from the questionnaire recording
sheet to a Microsoft Office Excel spreadsheet for analysis.
Statistical Analysis
In this study, we conducted one 2-way repeated measures ANOVA to evaluate the differences between morning,
afternoon, and evening activity, and sedentary, light, and moderate-vigorous activity intensity. Normality was tested
with Mauchly’s test of sphericity; if normality was violated,
the Greenhouse-Geisser correction was used. When signifi
-cance was identified, Tukey’s post hoc test was used to
identify any significant differences among the nine means.
Multiple linear regressions were used to predict the daily average (1) sedentary, (2) light, (3) moderate-vigorous activity, and (4) total overall activity in separate models. All models controlled for age, sex, BMI, and Beck depression scores. Models additionally included TSK and
PDI, or PCS and PDI. For all models, the variance infl
a-tion factor (VIF) was checked to confirm that
multicolli-nearity was not present.
Results
A total of 19 participants were excluded due to incomplete questionnaires or missing accelerometer data. One person requested to be withdrawn from the study. Therefore, a total of 21 participants completed our research study (males = 6,
females = 15, age = 45.6±11.7 years, BMI = 26.9±7.7 kg/m2).
There were no statistically significant differences between
male and female groups in age, sex, height, weight, or BMI,
nor were there statistically significant sex differences between
Day 1 Complete questionnaires
Pick up accelerometer watch Day 2 Measure daily activity
Record sleep diary Day 3 Measure daily activity
Record sleep diary Day 4 Measure daily activity
Record sleep diary Day 5 Measure daily activity
Record sleep diary Day 6 Measure daily activity
Record sleep diary Day 7 Return accelerometer
watch
Data Collection Timeline Variables
Baseline Sex, Age, BMI TSK, PCS, MPQ, BECK,
PDI
4 day average daily activity (three weekdays
and one weekend day)
Morning Activity Wake onset – 11:59am
Afternoon Sedentary Activity
Light Activity Mod-Vig Activity Afternoon Activity
12:00pm – 5:59pm Evening Activity 6:00pm – Sleep onset
Evening Sedentary Activity
Light Activity Mod-Vig Activity
Analysis
Total Daily Activity Wake onset – Sleep onset Segmented by time of day
2-way repeated measures ANOVA
(Time of day X Activity intensity) Regression Analysis
Control variables: Sex, Age, BMI, TSK,
PCS, BECK, PDI
Morning Sedentary Activity
Light Activity Mod-Vig Activity
Activity Segmented by intensity
Dependent Variables
Figure 1A research timeline indicating the variables taken at baseline include sex, age, BMI, TSK, PCS, MPQ, BECK, and PDI. Daily activity from three weekdays and one weekend day was averaged and segmented by time of day. Day time included the entire time from wake-onset to sleep-onset. Day time was segmented into morning, afternoon and evening, activity was segmented by sedentary, light, and moderate to vigorous activity.
Abbreviations:BMI, body mass index; TSK, Tampa Scale for Kinesiophobia; PCS, Pain Catastrophizing Scale; PDI, Pain Disability Index; MPQ, McGill Pain Questionnaire; Mod-Vig, moderate-vigorous.
Journal of Pain Research downloaded from https://www.dovepress.com/ by 118.70.13.36 on 24-Aug-2020
TSK, PCS, BECK, PDI, or MPQ scores. Due to the different group sizes and the similarities between male and female groups, we have selected to pool both males and females in
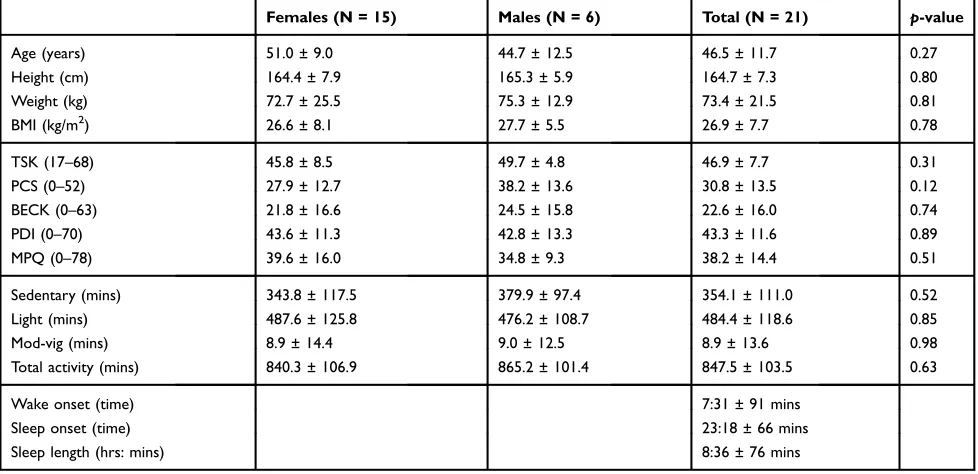
all subsequent analyses. See Table 1 for full demographic
information.
The results of the 2-way repeated measures ANOVA using time of day and activity data violated the assumption of normality; thus, results incorporating the Greenhouse-Geisser correction are exclusively presented here. The 2-way repeated measures ANOVA indicated there was
a statistically significant interaction between time of day
and activity intensity [F(2.54,50.96) = 10.26, p <0.001],
and a statistically significant main effect of time of day
[F (1.12,22.49) = 5.79, p =0.02] and activity intensity
[F (1.22,24.55) = 110.20, p <0.001]. Overall, individuals
with chronic pain participated in more average light activ-ity than sedentary activactiv-ity over a 4-day period, and very little moderate-vigorous activity. Of note, chronic pain patients were most active in the afternoon, in which they participated in more minutes of light activity than other
activity intensities at all times of the day. SeeTable 2for
all comparisons between 4-day average activity intensity at different times of the day.
Further exploration of activity intensities and time of day in multiple linear regression models indicated that the
associations between baseline TSK or PCS with activity inten-sity also varied by time of day. All analyses adjusted for sex, age, BMI, PDI and Beck depression scores as previously
mentioned. Greater baseline TSK was associated with signifi
-cantly less 4-day average sedentary activities in the morning,
afternoon, and evening (B =−4.59, B =−3.35, and B =−4.19,
respectively, allp<0.05). In contrast, greater baseline TSK
was associated with greater 4-day average light activity in the
evening only (B = 6.18, p = 0.02) and greater
moderate-vigorous activity in the morning and evening (B = 0.19 and
B = 0.16, respectively, bothp<0.05) (Table 3).
Greater baseline PCS was associated with significantly
less 4-day average sedentary activity in the morning (B =
−4.30,p= 0.03), and greater light activity in the evening
(B = 4.2,p= 0.02), and greater moderate-vigorous activity
in the morning (B = 0.14,p= 0.03) (Table 4). Neither the
TSK model nor PCS model were significant predictors of
total daily activity (Table 5)
Discussion
The results of our regression analysis indicated that base-line kinesiophobia was associated with 4-day average evening light activity, but not morning or afternoon light activity and baseline pain catastrophizing was associated with 4-day average sedentary and moderate-to-vigorous
Table 1Demographics, Questionnaire Results (TSK, PSC, BECK, PDI, MPQ), Minutes of Activity, and Sleep Variables in a Group of Chronic Pain Patients Awaiting Treatment in a Multidisciplinary Clinic
Females (N = 15) Males (N = 6) Total (N = 21) p-value
Age (years) 51.0 ± 9.0 44.7 ± 12.5 46.5 ± 11.7 0.27
Height (cm) 164.4 ± 7.9 165.3 ± 5.9 164.7 ± 7.3 0.80
Weight (kg) 72.7 ± 25.5 75.3 ± 12.9 73.4 ± 21.5 0.81
BMI (kg/m2) 26.6 ± 8.1 27.7 ± 5.5 26.9 ± 7.7 0.78
TSK (17–68) 45.8 ± 8.5 49.7 ± 4.8 46.9 ± 7.7 0.31
PCS (0–52) 27.9 ± 12.7 38.2 ± 13.6 30.8 ± 13.5 0.12
BECK (0–63) 21.8 ± 16.6 24.5 ± 15.8 22.6 ± 16.0 0.74
PDI (0–70) 43.6 ± 11.3 42.8 ± 13.3 43.3 ± 11.6 0.89
MPQ (0–78) 39.6 ± 16.0 34.8 ± 9.3 38.2 ± 14.4 0.51
Sedentary (mins) 343.8 ± 117.5 379.9 ± 97.4 354.1 ± 111.0 0.52
Light (mins) 487.6 ± 125.8 476.2 ± 108.7 484.4 ± 118.6 0.85
Mod-vig (mins) 8.9 ± 14.4 9.0 ± 12.5 8.9 ± 13.6 0.98
Total activity (mins) 840.3 ± 106.9 865.2 ± 101.4 847.5 ± 103.5 0.63
Wake onset (time) 7:31 ± 91 mins
Sleep onset (time) 23:18 ± 66 mins
Sleep length (hrs: mins) 8:36 ± 76 mins
Notes:Values reported in means ± standard deviation. There is no statistically significant difference between male and female groups in any variable.
Abbreviations:N, sample size; cm, centimetres; kg, kilograms; m, metres; BMI, body mass index; TSK, Tampa Scale for Kinesiophobia; PCS, Pain Catastrophizing Scale; PDI, Pain Disability Index; MPQ, McGill Pain Questionnaire; Mod-Vig, moderate-vigorous; hrs, hours; mins, minutes.
Journal of Pain Research downloaded from https://www.dovepress.com/ by 118.70.13.36 on 24-Aug-2020
activity in the morning, and light evening activity. In addition, baseline kinesiophobia was associated with 4-day average sedentary activity in the morning, after-noon, and evening, and neither baseline kinesiophobia nor baseline pain catastrophizing were associated with
4-day average total daily activity. Our findings indicate
that chronic pain patients’ baseline kinesiophobia and
baseline pain catastrophizing measured once at beginning of the study are associated with the 4-day average of different activity intensities at different times of the day.
Future research should investigate the significant
relation-ship between baseline kinesiophobia and the 4-day
aver-age of light activity in the afternoon and the influence this
relationship has on rehab interventions. Of interest is the
finding that the most activity our chronic pain patients
participated in was light activity in the afternoon, but the regression results suggest that baseline levels of kinesio-phobia and baseline pain catastrophizing are not asso-ciated with the 4-day average of light activity in the afternoon. This may be explained by the amount of activ-ity in the afternoon our participants engaged in, it is possible that our participants were more active in the afternoon, leading to an exacerbation of their pain and more sedentary activity in the evening. Chronic pain has
been linked to changes in the brain (specifically in the
anterior cingulate cortex) suggesting that pain may cause
avoidance behaviours.42It is possible that the chronic pain
population may become mentally and physically tired during the evening time leading to increased avoidance behaviours as a result of increased pain in the evening, especially if these patients engage in more activity in the afternoon.
The regression results are similar to other studies that found no association between baseline kinesiophobia and baseline pain catastrophizing, and 4-day average total
daily activity,26 but our results indicate a significant
negative relationship between baseline kinesiophobia and 4-day average sedentary activity at all times of the day.
This importantfinding suggests that chronic pain patients’
activity habits are affected by their baseline level of kine-siophobia and baseline pain catastrophizing. Baseline kinesiophobia was positively associated with more min-utes of light activity suggesting that individuals who par-ticipate in higher intensity activities may be more aware of their chronic pain and experience increased fear of move-ment while engaging in higher intensity activities. Individuals who choose higher intensity activities may understand the importance of physical activity in the treat-ment of their pain and engage in these activities despite their kinesiophobia. In contrast, individuals who choose sedentary activity are not engaging in any activity and as a result have less fear of movement because they are sedentary. Our results suggest that it is important to inves-tigate activity intensity at different times of the day since the relationship between baseline kinesiophobia, baseline pain catastrophizing and 4-day average activity changes depending on the time of day.
Our chronic pain population engaged in more 4-day average light activity than sedentary activity, contradict-ing previous work indicatcontradict-ing that individuals with
chronic pain live a primarily sedentary lifestyle.8 In
addition, our chronic pain population engaged in more 4-day average afternoon light activity compared to the morning and evening activity, agreeing with previous work suggesting people with chronic pain have higher
movement intensity in the afternoon.13 Another study
which assessed acceleration (via accelerometers) as their dependent variable found that chronic pain patients participate in higher average acceleration in the morning
than the afternoon and evening.43 Comparing activity of
chronic pain participants across studies is difficult due
to methodological differences in the measurement of
Table 2A 2-Way Repeated Measures ANOVA Between 4-Day Average Activity Intensity (Sedentary, Light, and Moderate-Vigorous) and Time of Day (Morning, Afternoon, and Evening)
Movement Type Morning Afternoon Evening Total
Sedentary 109.9 ± 47.2* 93.6 ± 46.1*,§ 150.6 ± 55.1§,|| 354.1 ± 111‡,†
Light 132.4 ± 50.6*,† 190.4 ± 58.5*,† 161.6 ± 61.0|| 484.4 ± 118.6‡
Mod-vig 1.5 ± 2.1* 5.0 ± 7.5* 2.4 ± 5.9*,|| 8.9 ± 13.6†
Total 243.9 ± 70.7 289.0 ± 61.3 314.6 ± 64.2 847.5 ± 103.5
Notes:Values represent the 4-day average activity of a chronic pain population with associated standard deviations. *Indicates a significant difference between afternoon light activity and all morning activity, afternoon sedentary and moderate-vigorous activity, and evening moderate- vigorous activity;†Indicates a significant difference between afternoon light activity and morning light activity;‡Indicates a significant difference between total light and total sedentary activity; §Indicates a significant difference between sedentary activity in the afternoon and evening; ||Indicates a significant difference between sedentary, light, and moderate-vigorous activity in the evening. All data reported in means ± standard deviation and significant differences were significant at p < 0.05.
Journal of Pain Research downloaded from https://www.dovepress.com/ by 118.70.13.36 on 24-Aug-2020
T able 3 Linear Regr ession Results for Activity Intensity at Differ ent Times of the Da y as the Depending V ariable and TSK as the Independent V ariable and PDI, Age , Sex, BMI, and BECK as Contr ol V ariables Activity Intensity V ariable Morning Afternoon Ev ening R 2 BS E B β P value R 2 BS E B β P value R 2 BS E B β P value Sedentar y Activity 0.483 0.10 0.436 0.17 0.436 0.17 TSK − 4.59 1.52 − 0.747 0.009* − 3.35 1.54 − 0.559 0.048* − 4.19 1.60 − 0.585 0.02* PDI − 1.17 0.955 − 0.287 0.24 0.432 0.972 0.108 0.66 1.91 1.00 0.402 0.08 Age 0.297 0.853 0.074 0.73 0.312 0.868 0.79 0.73 0.486 0.080 0.103 0.60 Sex − 34.88 20.8 − 0.341 0.12 − 7.10 21.25 − 0.071 0.74 − 25.58 21.98 − 0.215 0.26 BMI 0.740 1.3 0.155 0.58 − 0.708 1.33 − 0.113 0.61 − 2.34 1.38 − 0.313 0.11 BECK 1.00 0.832 0.342 0.25 2.04 0.847 0.712 0.03* 1.49 0.876 0.435 0.11 Light Activity 0.145 0.87 0.331 0.38 0.609 0.02 TSK 0.671 2.09 0.102 0.75 1.08 2.14 0.143 0.62 6.182 1.70 0.779 0.003* PDI 0.234 1.13 0.053 0.86 − 0.732 1.34 − 0.145 0.59 − 1.72 1.07 − 0.326 0.13 Age 0.751 1.17 0.174 0.53 1.15 1.20 0.231 0.35 − 1.02 0.957 − 0.197 0.30 Sex 10.39 28.7 0.095 0.72 16.1 29.36 0.127 0.59 16.80 23.41 0.128 0.49 BMI 1.86 1.8 0.272 0.32 1.33 1.84 0.167 0.48 1.28 1.47 0.155 0.40 BECK − 0.845 1.14 − 0.268 0.47 − 1.5 1.17 − 0.420 0.21 − 1.66 0.933 − 0.438 0.10 Moderate to Vigor ous 0.437 0.17 0.195 0.75 0.511 0.08 Activity TSK 0.191 0.071 0.696 0.017* 0.396 0.302 1.31 0.21 0.610 0.185 0.791 0.005* PDI − 0.030 0.044 − 0.163 0.52 − 0.038 0.190 − 0.200 0.84 − 0.058 0.116 − 0.114 0.62 Age − 0.014 0.040 − 0.079 0.73 − 0.103 0.169 − 0.607 0.55 − 0.012 0.104 − 0.041 0.84 Sex 1.00 0.970 0.221 0.32 − 1.17 4.14 − 0.284 0.78 3.50 2.54 0.274 0.19 BMI 0.030 0.061 0.105 0.63 0.241 0.261 0.925 0.37 0.039 0.160 0.048 0.81 BECK − 0.014 0.039 − 0.108 0.72 − 0.199 0.165 − 1.20 0.25 − 0.070 0.101 − 0.190 0.50 Notes: TSK is a signi fi cant pr edictor of morning, afternoon, and e vening sedentary activity , and light and moderate-vigor ous activity . Bolded and * indicate a statistica lly signi fi cant differ ence ( p < 0.05). Abbre viations: TSK, T ampa Scale for Kinesiophobia; PDI, Pain Disability Index; BMI, Body Mass Index; R, effect size; B, Unstandar dized Beta; SE, Standar d Err or ; β , Standardized Beta.
Journal of Pain Research downloaded from https://www.dovepress.com/ by 118.70.13.36 on 24-Aug-2020
T able 4 Linear Regr ession Results for Activity Intensity at Differ ent Times of the Da y as the Depending V ariable and PCS as the Independent V ariable and PDI, Age, Sex, BMI, and BECK as Contr ol V ariables Activity Intensity V ariable Morning Afternoon Ev ening R 2 BS E B β P value R 2 BS E B β P value R 2 BS E B β P value Sedentar y Activity 0.522 0.048* 0.299 0.47 0.469 0.14 PCS − 4.30 1.20 − 1.22 0.004* − 1.48 1.47 − 0.434 0.33 − 2.66 1.50 − 0.650 0.10 PDI − 0.527 0.850 − 0.129 0.55 0.986 1.03 0.247 0.36 2.56 1.06 0.539 0.03* Age − 0.694 0.825 − 0.172 0.41 − 0.098 1.00 − 0.025 0.92 − 0.179 1.02 − 0.038 0.87 Sex − 64.85 22.5 − 0.635 0.01* − 12.52 27.45 − 0.126 0.66 − 40.377 28.10 − 0.339 0.17 BMI 0.760 1.21 0.118 0.54 − 0.394 1.48 − 0.063 0.80 − 2.09 1.52 − 0.280 0.19 BECK 2.22 0.985 0.757 0.04* 1.88 1.20 0.658 0.14 1.81 1.23 0.528 0.16 Light Activity 0.269 0.418 0.19 0.624 0.01* PCS 2.61 1.64 0.695 0.136 2.63 1.70 0.605 0.14 4.26 1.67 0.940 0.02* PDI 0.241 1.16 0.055 0.839 − 0.802 1.19 − 0.159 0.51 − 2.66 1.17 − 0.505 0.04* Age 1.27 1.12 0.295 0.278 1.69 1.16 0.340 0.17 0.018 1.14 0.003 0.99 Sex 34.5 30.7 0.316 0.280 39.26 31.72 0.311 0.24 41.94 31.20 0.318 0.20 BMI 2.22 1.66 0.324 0.202 1.61 1.71 0.204 0.26 0.981 1.68 0.118 0.57 BECK − 2.28 1.34 − 0.725 0.112 − 2.84 1.38 − 0.780 0.06 − 2.34 1.36 − 0.617 0.11 Moderate to Vigor ous 0.390 0.136 0.89 0.077 0.97 Activity PCS 0.149 0.063 0.951 0.033* − 0.212 0.267 − 0.380 0.44 0.201 0.203 0.457 0.34 PDI − 0.058 0.044 − 0.318 0.211 − 0.123 0.188 − 0.189 0.52 − 0.163 0.143 − 0.318 0.27 Age 0.021 0.043 0.118 0.627 − 0.128 0.182 − 0.200 0.49 0.040 0.139 0.080 0.78 Sex 1.95 1.16 0.430 0.117 − 4.40 4.97 − 0.271 0.39 3.79 3.79 0.297 0.33 BMI 0.024 0.063 0.083 0.712 0.134 0.269 0.131 0.63 − 0.031 0.205 − 0.038 0.88 BECK − 0.046 0.051 − 0.351 0.383 0.065 0.218 0.139 0.77 0.002 0.166 0.005 0.99 Notes: PCS is a signi fi cant pr edictor of morning sedentar y and moderate-vigor ous activity , and e vening light activity . Bolded and * indicate a statistically signi fi cant differen ce ( p < 0.05). Abbre viations: TSK, T ampa Scale for Kinesiophobia; PDI, Pain Disability Index; BMI, Body Mass Index; R, effect size; B, Unstandar dized Beta; SE, Standar d Err or ; β , Standardized Beta.
Journal of Pain Research downloaded from https://www.dovepress.com/ by 118.70.13.36 on 24-Aug-2020
activity, but most authors agree that the activity level of a person suffering from chronic pain varies in intensity
throughout the day.8,13,43
Our chronic pain population participated in 354.1±111 mins of sedentary activity averaged over a 4-day period, in contrast, sedentary activity from a robust sample of
Canadians was reported to be 570–588 mins, highlighting
our implication that individuals with chronic pain live
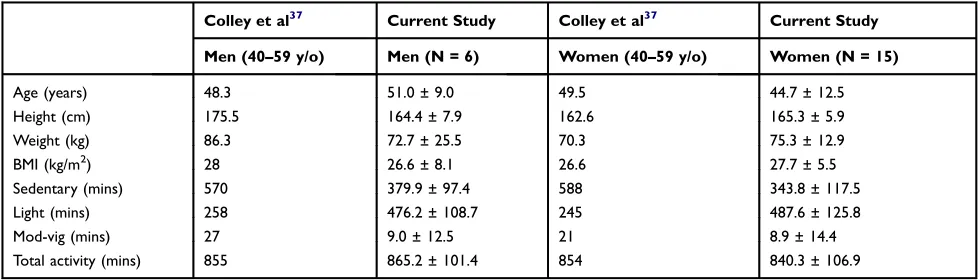
a less sedentary lifestyle than previously reported.41 See
Table 6for study comparisons. This result was surprising
given the severe health status of our participants, who had higher scores for kinesiophobia, catastrophizing, and
depression compared to other studies.44–47 Our chronic
pain population engaged in, on average, 484.4±118.6 mins of light activity over a 4-day period, whereas the
large Canadian sample reported light activity as 245–258
mins, suggesting that our chronic pain population parti-cipated in more light activity than the Canadian
population.41 Another study suggested that individuals
with chronic pain participate in similar levels of
seden-tary and light activity compared to the general
population.48 However, individuals with chronic pain
are presumed to avoid movement so they do not
aggra-vate their pain. Our finding that individuals in chronic
pain are less sedentary compared to a healthy population is surprising, but this may be more of a statement about physical activity levels in the general population. One explanation may be that a healthy population is typically
employed in a sedentary job,49,50 whereas our study
par-ticipants were generally unemployed, and thus may have participated in more frequent light activity (ie, house-work, errands, etc.). There is evidence to supporting little
or no relationship between physical function and pain.51
Therefore, future interventions encouraging physical
activity in chronic pain patients may be influenced by
the quantity, intensity, and the time of the day this popu-lation participates in physical activity. Perhaps interven-tions aimed at increasing activity in the afternoon are better tolerated by the chronic pain population than ori-ginally thought.
Measuring activity based on individual wake and sleep-onset times, and across three separate time periods
Table 5Linear Regression Results for Total Daily Activity as the Dependent Variable with Results from Both a Model with TSK and PCS as Independent Variables While Controlling for PDI, Age, Sex, BMI, and BECK
Variable R2 Total Daily Activity
B SE B β Pvalue
0.410 0.82
TSK −3.01 4.22 −0.224 0.49
PDI −1.16 2.64 −0.131 0.67
Age 1.83 2.36 0.208 0.45
Sex −20.93 57.93 −0.094 0.72
BMI 2.47 3.64 0.176 0.51
BECK 0.221 2.30 0.034 0.93
0.318 0.87
PCS 1.18 3.64 0.155 0.75
PDI −0.542 2.56 −0.061 0.84
Age 1.94 2.49 0.221 0.45
Sex −0.644 68.05 −0.003 0.99
BMI 3.21 3.68 0.229 0.40
BECK −1.51 2.97 −0.236 0.62
Note:Neither the TSK model nor the PCS model was a significant predictor for
total daily activity.
Abbreviations:TSK, Tampa Scale for Kinesiophobia; PCS, Pain Catastrophizing Scale; PDI, Pain Disability Index; BMI, Body Mass Index; R, effect size; B, Unstandardized Beta; SE, Standard Error;β, Standardized Beta.
Table 6Study Comparison Between Age, Height, Weight, BMI, and Daily Activity between the Current Study and a Study by Colley et al (Health Reports, 2011)37in the General Canadian Population
Colley et al37 Current Study Colley et al37 Current Study
Men (40–59 y/o) Men (N = 6) Women (40–59 y/o) Women (N = 15)
Age (years) 48.3 51.0 ± 9.0 49.5 44.7 ± 12.5
Height (cm) 175.5 164.4 ± 7.9 162.6 165.3 ± 5.9
Weight (kg) 86.3 72.7 ± 25.5 70.3 75.3 ± 12.9
BMI (kg/m2) 28 26.6 ± 8.1 26.6 27.7 ± 5.5
Sedentary (mins) 570 379.9 ± 97.4 588 343.8 ± 117.5
Light (mins) 258 476.2 ± 108.7 245 487.6 ± 125.8
Mod-vig (mins) 27 9.0 ± 12.5 21 8.9 ± 14.4
Total activity (mins) 855 865.2 ± 101.4 854 840.3 ± 106.9
Notes:Values reported in means ± standard deviation (where available). Comparison data from Colley et al.37
Abbreviations:y/o, years of age; N, sample size; cm, centimetres; kg, kilograms; m, metres; BMI, body mass index; Mod-Vig, moderate-vigorous; mins, minutes.
Journal of Pain Research downloaded from https://www.dovepress.com/ by 118.70.13.36 on 24-Aug-2020
during the day is a strength of our research. Some previous authors measured morning activity, for example, from 6am to 12pm, without accounting for variability in wake-onset
time.13,52 Our chronic pain population experienced wake
and sleep-onset times with high variability, which is con-sistent with previous research indicating the chronic pain population often experiences disrupted sleep and
inconsis-tent sleep patterns.4In our study, average wake time was
7:31am, so segmenting morning data using a 6am–12pm
window would inflate the amount of sedentary activity in
the morning because 90 mins of activity would have been recorded when the participants were asleep. Napping is different than sleeping because naps may be planned or unplanned, and sleeping is intentional behaviour to go to sleep. Further, the standard deviation around the average wake time was plus or minus 90 mins indicating there was a large variation in the wake times of our participants, this high variability also suggests that using individual wake and sleep-onset times would better capture the activity habits of the chronic pain population.
It is important to note the severe health status of our
participants. For example, our participants’kinesiophobia
scores fell into the severe category (43–52 on the TSK)
and were markedly higher compared to another study of 912 chronic pain sufferers whose scores fell into the
moderate category (33–43).34 Further, our chronic pain
population suffered from more pain catastrophizing (higher PCS scores than the referenced study) than a group of 60 subjects from an outpatient chronic pain
treatment group.14,44,45 Additionally, our participants had
higher depression scores (higher BECK scores than the referenced study), reported more severe subjective ratings of pain (higher MPQ scores than the referenced study), and more severe subjective perceptions of disability (higher PDI scores than the referenced study) than the
previous literature in chronic pain populations.14,45–47
Nevertheless, our participants were most active in the afternoon engaging in light activity, and they participated in less sedentary activity compared to the general
Canadian population.41
Our findings have important clinical implications, 1)
Practitioners who encourage chronic pain patients to par-ticipate in activity must be aware that these patients will have higher kinesiophobia and pain catastrophizing, even when participating in higher intensity activity, and 2) our pain patients participated in the most light activity in the afternoon, so clinicians may be more successful at sche-duling activity interventions in the afternoon.
Limitations
The severe health status of the participants in our study limits the generalizability of the results. Our study also included more women than men, but women tend to
experi-ence more chronic pain, especially fibromyalgia, so the
demographic characteristics of our sample are similar to
the general chronic pain population.2,53 We used a low
wake threshold of 20 counts per minute to collect activity data from our participants. The low wake threshold was a feature of the Actiwatch Score designed to measure sleep in this particular population, which may affect the movement counts. Although the study sample of 21 parti-cipants is relatively small, the previous literature suggests a minimum of 12 subjects would be needed in these models
to minimize bias in the regression coefficients.54Recruiting
subjects from a wait list may affect the results since this would be a sample of participants that are seeking treat-ment. Previous studies have approached subjects on a wait list in order not to withhold treatment for research
purposes.31,32 However, most chronic pain subjects have
interacted with multiple clinicians and are often seeking additional treatment options but their choice of seeking treatment may affect the results of this study. We did not conduct a power calculation a priori so these results must be interpreted with caution.
Conclusion
By evaluating 4-day average activity based on time of day (morning, afternoon, and evening) and by incor-porating individual wake-sleep onset times we were able to demonstrate that baseline kinesiophobia is associated with 4-day average evening light activity and sedentary activity during the day. In addition, baseline
catastrophiz-ing was significantly correlated with more 4-day average
light activity in the morning and more moderate to
vig-orous activity in the evening. Another key finding was
that the participants with chronic pain are less sedentary than previously thought. Despite the severe health status of the chronic pain population in our research, our parti-cipants engaged in more 4-day average light activity than sedentary activity. The different results with total daily activity and daily activity categorized by time of day and activity intensity demonstrate the importance of separat-ing daily activity by wake and sleep times, time of day, and activity intensity in the chronic pain population in future studies.
Journal of Pain Research downloaded from https://www.dovepress.com/ by 118.70.13.36 on 24-Aug-2020
Acknowledgment
Matthew B. Miller and Melissa J. Roumanis have contrib-uted equally to the research.
Funding
This research was partially supported by Centre de Recherché Interdisciplinaire en Réadaptation du Montréal metropolitain (CRIR), CRIR-759-0812, and La Corporation des Thérapeutes du Sport du Québec (CTSQ).
Disclosure
The authors report no conflicts of interest in this work.
References
1. De Souza LH, Frank AO. Experiences of living with chronic back pain: the physical disabilities.Disabil Rehabil.2007;29(7):587–596. doi:10.1080/09638280600925852
2. Kurklinsky S, Perez RB, Lacayo ER, Sletten CD. The efficacy of interdisciplinary rehabilitation for improving function in people with chronic pain.Pain Res Treat.2016;2016:7217684.
3. Duque I, Parra JH, Duvallet A. Maximal aerobic power in patients with chronic low back pain: a comparison with healthy subjects.Eur
Spine J.2011;20(1):87–93. doi:10.1007/s00586-010-1561-0
4. Smith MT, Haythornthwaite JA. How do sleep disturbance and chronic pain inter-relate? Insights from the longitudinal and cognitive-behavioral clinical trials literature.Sleep Med Rev.2004;8 (2):119–132. doi:10.1016/S1087-0792(03)00044-3
5. Song MR, Lee YS, Baek JD, Miller M. Physical activity status in adults with depression in the National Health and Nutrition Examination Survey, 2005–2006. Public Health Nurs. 2012;29 (3):208–217. doi:10.1111/j.1525-1446.2011.00986.x
6. Werneck AO, Oyeyemi AL, Silva DR. Physical activity and depres-sion: is 150 min/week of moderate to vigorous physical activity a necessary threshold for decreasing risk of depression in adults? Different views from the same data.Soc Psych Psych Epid.2018;53 (3):323–324. doi:10.1007/s00127-018-1490-5
7. Biswas A, Oh PI, Faulkner GE, Bajaj RR, Silver MA, Mitchell MS. Sedentary time and its association with risk for disease incidence, mortality, and hospitalization in adults (vol 162, pg 123, 2015).Ann
Intern Med.2015;163(5):400.
8. Perruchoud C, Buchser E, Johanek LM, Aminian K, Paraschiv-Ionescu A, Taylor RS. Assessment of physical activity of patients with chronic pain. Neuromodulation. 2014;17(Suppl 1):42–47. doi:10.1111/ner.2014.17.issue-s1
9. Herman KM, Hopman WM, Vandenkerkhof EG, Rosenberg MW. Physical activity, body mass index, and health-related quality of life in Canadian adults. Med Sci Sport Exer. 2012;44(4):625–636. doi:10.1249/MSS.0b013e31823a90ae
10. Chibnall JT, Tait RC. The pain disability index: factor structure and normative data. Arch Phys Med Rehabil. 1994;75(10):1082–1086. doi:10.1016/0003-9993(94)90082-5
11. Ware JE Jr., Sherbourne CD, The MOS. 36-item short-form health survey (SF-36). I. Conceptual framework and item selection. Med Care. 1992;30(6):473–483. doi:10.1097/00005 650-199206000-00002
12. Peppin JF, Marcum S, Kirsh KL. The chronic pain patient and functional assessment: use of the 6-minute walk test in a multidisciplinary pain clinic. Curr Med Res Opin. 2014;30(3):361–365. doi:10.1185/03007 995.2013.828587
13. Raijmakers BG, Nieuwenhuizen MG, Beckerman H, de Groot S. Differences in the course of daily activity level between persons with and without chronic pain.Am J Phys Med Rehabil.2015;94 (2):101–109; quiz 110–103. doi:10.1097/PHM.0000000000000206 14. Sullivan MJ, Adams H, Horan S, Maher D, Boland D, Gross R. The
role of perceived injustice in the experience of chronic pain and disability: scale development and validation. J Occup Rehabil. 2008;18(3):249–261. doi:10.1007/s10926-008-9140-5
15. Crombez G, Vlaeyen JWS, Heuts PHTG, Lysens R. Pain-related fear is more disabling than pain itself: evidence on the role of pain-related fear in chronic back pain disability. Pain. 1999;80(1–2):329–339. doi:10.1016/S0304-3959(98)00229-2
16. Schutze R, Rees C, Smith A, Slater H, Campbell JM, O’Sullivan P. How can we best reduce pain catastrophizing in adults with chronic noncancer pain? A systematic review and meta-analysis. J Pain. 2018;19(3):233–256. doi:10.1016/j.jpain.2017.09.010
17. Turk DC, Robinson JP, Burwinkle T. Prevalence of fear of pain and activity in patients with fibromyalgia syndrome. J Pain. 2004;5 (9):483–490. doi:10.1016/j.jpain.2004.08.002
18. Susan H, Picavet J, Vlaeyen JWS, Schouten JSAG. Pain cata-strophizing and kinesiophobia: predictors of chronic low back pain. Am J Epidemiol. 2002;156(11):1028–1034. doi:10.1093/ aje/kwf136
19. Damsgard E, Thrane G, Anke A, Fors T, Roe C. Activity-related pain in patients with chronic musculoskeletal disorders.Disabil Rehabil. 2010;32(17):1428–1437. doi:10.3109/09638280903567877 20. Kindermans HPJ, Roelofs J, Goossens MEJB, Huijnen IPJ,
Verbunt JA, Vlaeyen JWS. Activity patterns in chronic pain: under-lying dimensions and associations with disability and depressed mood.
J Pain.2011;12(10):1049–1058. doi:10.1016/j.jpain.2011.04.009
21. Haldorsen EMH, Grasdal AL, Skouen JS, Risa AE, Kronholm K, Ursin H. Is there a right treatment for a particular patient group? Comparison of ordinary treatment, light multidisciplinary treatment, and extensive multidisciplinary treatment for long-term sick-listed employees with musculoskeletal pain. Pain. 2002;95(1–2):49–63. doi:10.1016/S0304-3959(01)00374-8
22. Liddle SD, Baxter GD, Gracey JH. Chronic low back pain: patients’ experiences, opinions and expectations for clinical management.
Disabil Rehabil. 2007;29(24):1899–1909. doi:10.1080/096382807
01189895
23. Gordon D, Eaton L, Rue T, et al. Measuring activity goals important to individuals with chronic pain. J Pain. 2014;15(4):S100–S100. doi:10.1016/j.jpain.2014.01.410
24. Main CJ, George SZ. Psychologically informed practice for manage-ment of low back pain: future directions in practice and research.
Phys Ther.2011;91(5):820–824. doi:10.2522/ptj.20110060
25. Vlaeyen JWS, Kolesnijders AMJ, Boeren RGB, Vaneek H. Fear of move-ment (re)injury in chronic low-back-pain and its relation to behavioral performance. Pain. 1995;62(3):363–372. doi:10.1016/0304-3959(94) 00279-N
26. Carvalho FA, Maher CG, Franco MR, et al. Fear of movement is not associated with objective and subjective physical activity levels in chronic nonspecific low back pain.Arch Phys Med Rehab.2017;98 (1):96–104. doi:10.1016/j.apmr.2016.09.115
27. Elfving B, Andersson T, Grooten WJ. Low levels of physical activity in back pain patients are associated with high levels of fear-avoidance beliefs and pain catastrophizing. Physiother Res Int. 2007;12 (1):14–24. doi:10.1002/(ISSN)1471-2865
28. Blagestad T, Pallesen S, Lunde LH, Sivertsen B, Nordhus IH, Gronli J. Sleep in older chronic pain patients a comparative poly-somnographic study.Clin J Pain.2012;28(4):277–283. doi:10.1097/ AJP.0b013e3182313899
29. Stiefel F, Stagno D. Management of insomnia in patients with chronic pain conditions. CNS Drugs. 2004;18(5):285–296. doi:10.2165/ 00023210-200418050-00002
Journal of Pain Research downloaded from https://www.dovepress.com/ by 118.70.13.36 on 24-Aug-2020
30. Skender S, Ose J, Chang-Claude J, et al. Accelerometry and physical activity questionnaires –a systematic review.BMC Public Health. 2016;16:515.
31. Spenkelink CD, Hutten MM, Hermens HJ, Greitemann BO. Assessment of activities of daily living with an ambulatory monitor-ing system: a comparative study in patients with chronic low back pain and nonsymptomatic controls.Clin Rehabil.2002;16(1):16–26. doi:10.1191/0269215502cr463oa
32. Zhang QJS, Lufei Y. The effectiveness of group-based physiotherapy-led behavioural psychological interventions on adults with chronic low back pain. A systematic review and meta-analysis.Am Jour Phys Med Rehab. 2019;93(3):215–225. doi:10.1097/PHM.0000000000001053
33. Hoftun GB, Romundstad PR, Zwart JA, Rygg M. Chronic idiopathic pain in adolescence – high prevalence and disability: the young HUNT study 2008. Pain. 2011;152(10):2259–2266. doi:10.1016/j. pain.2011.05.007
34. Neblett R, Hartzell MM, Mayer TG, Bradford EM, Gatchel RJ. Establishing clinically meaningful severity levels for the Tampa Scale for Kinesiophobia (TSK-13).Eur J Pain.2016;20(5):701–710. doi:10.1002/ejp.795
35. Cook AJ, Brawer PA, Vowles KE. The fear-avoidance model of chronic pain: validation and age analysis using structural equation modeling. Pain.2006;121(3):195–206. doi:10.1016/j.pain.2005.11.018
36. Hirsh AT, George SZ, Bialosky JE, Robinson ME. Fear of pain, pain catastrophizing, and acute pain perception: relative prediction and timing of assessment. J Pain. 2008;9(9):806–812. doi:10.1016/j. jpain.2008.03.012
37. Harris CA, D’Eon JL. Psychometric properties of the Beck Depression Inventory-Second Edition (BDI-II) in individuals with chronic pain. Pain.2008;137(3):609–622. doi:10.1016/j.pain.2007.10.022
38. Tait RC, Pollard CA, Margolis RB, Duckro PN, Krause SJ. The Pain Disability Index: psychometric and validity data. Arch Phys Med
Rehabil.1987;68(7):438–441.
39. Respironics. Actiware and Actiware CT Software and Hardware Manual: Actiwatch Communication and Sleep Analysis Software
with ActiReader. Respironics, Inc.;2009.
40. Migueles JH, Cadenas-Sanchez C, Ekelund U, et al. Accelerometer data collection and processing criteria to assess physical activity and other outcomes: a systematic review and practical considerations.
Sports Med.2017;47(9):1821–1845. doi:10.1007/s40279-017-0716-0
41. Colley RC, Garriguet D, Janssen I, Craig CL, Clarke C, Tremblay MS. Physical activity of Canadian adults: accelerometer results from the 2007 to 2009 Canadian health measures survey.
Health Rep.2011;22(1):1–7.
42. Rainville P. Brain mechanisms of pain affect and pain modulation.
Curr Opin Neurobiol. 2002;12(2):195–204.
doi:10.1016/S0959-4388(02)00313-6
43. van Weering MGH, Vollenbroek-Hutten MMR, Tonis TM, Hermens HJ. Daily physical activities in chronic lower back pain patients assessed with accelerometry. Eur J Pain.2009;13(6):649–654. doi:10.1016/j. ejpain.2008.07.005
44. Osman A, Barrios FX, Gutierrez PM, Kopper BA, Merrifield T, Grittmann L. The pain catastrophizing scale: further psychometric evaluation with adult samples. J Behav Med. 2000;23(4):351–365. doi:10.1023/A:1005548801037
45. Nicholas MK, Asghari A, Blyth FM. What do the numbers mean? Normative data in chronic pain measures.Pain.2008;134(1–2):158– -173. doi:10.1016/j.pain.2007.04.007
46. Orenius T, Koskela T, Koho P, et al. Anxiety and depression are independent predictors of quality of life of patients with chronic musculoskeletal pain. J Health Psychol. 2013;18(2):167–175. doi:10.1177/1359105311434605
47. Richardson EJ, Ness TJ, Doleys DM, Banos JH, Cianfrini L, Richards JS. Depressive symptoms and pain evaluations among persons with chronic pain: catastrophizing, but not pain acceptance, shows significant effects. Pain.2009;147(1–3):147–152. doi:10.1016/j.pain.2009.08.030 48. Dansie EJ, Turk DC, Martin KR, Van Domelen DR, Patel KV.
Association of chronic widespread pain with objectively measured physical activity in adults: findings from the national health and nutrition examination survey. J Pain. 2014;15(5):507–515. doi:10.1016/j.jpain.2014.01.489
49. JO WH H, Reed GW, Peters JC. Obesity and the environment: where do we go from here?Science.2003;299(5608):853–855. doi:10.1126/ science.1079857
50. Brown WJ, Miller YD, Miller R. Sitting time and work patterns as indicators of overweight and obesity in Australian adults.
Int J Obesity.2003;27(11):1340–1346. doi:10.1038/sj.ijo.0802426
51. Grotle M, Vollestad NK, Brox JI. Clinical course and impact of fear-avoidance beliefs in low back pain: prospective cohort study of acute and chronic low back pain: II.Spine (Phila Pa 1976).2006;31 (9):1038–1046. doi:10.1097/01.brs.0000214878.01709.0e
52. Spenkelink CD, Hutten MMR, Hermens HJ, Greitemann BOL. Assessment of activities of daily living with an ambulatory monitor-ing system: a comparative study in patients with chronic low back pain and nonsymptomatic controls.Clin Rehabil.2002;16(1):16–26. doi:10.1191/0269215502cr463oa
53. Latorre-Roman P, Santos-Campos M, Heredia-Jimenez J, Delgado-Fernandez M, Soto-Hermoso V. Analysis of the performance of women withfibromyalgia in the six-minute walk test and its relation with health and quality of life.J Sports Med Phys Fitness.2014;54 (4):511–517.
54. Austin PC, Steyerberg EW. The number of subjects per variable required in linear regression analyses. J Clin Epidemiol. 2015;68 (6):627–636. doi:10.1016/j.jclinepi.2014.12.014
Journal of Pain Research
Dove
press
Publish your work in this journal
The Journal of Pain Research is an international, peer reviewed, open access, online journal that welcomes laboratory and clinicalfindings in thefields of pain research and the prevention and management of pain. Original research, reviews, symposium reports, hypothesis formation and commentaries are all considered for publication. The manuscript
management system is completely online and includes a very quick and fair peer-review system, which is all easy to use. Visit http:// www.dovepress.com/testimonials.php to read real quotes from pub-lished authors.
Submit your manuscript here:https://www.dovepress.com/journal-of-pain-research-journal
Journal of Pain Research downloaded from https://www.dovepress.com/ by 118.70.13.36 on 24-Aug-2020