MEASURING AND UNDERSTANDING CONSUMER-BASED BRAND EQUITY OF READY TO EAT PRODUCTS: A STUDY WITH REFERENCE TO OATS
Dr. M. VASAN Assistant Professor of Commerce A. V. V. M. Sri Pushpam College (Autonomous)
Poondi, Thanjavur - 613 503
Abstract
The study develops and empirically tests a model for consumer-based brand equity among oats consumers. In this regard, statistical tools such as Factor analysis, Multiple-regression, Karl Pearson’s coefficient of correlation, One-way Analysis of Variance (ANOVA) and One sample ‘t’ test are used. The dimensions of brand equity such as brand awareness, brand knowledge, perceived quality, brand association, purchase decision and post purchase behavior are examined through factor analysis. There is a perfect correlation exists among these dimensions of brand equity. After the thorough analysis it has been found out the demographic variables significantly differ with the dimensions of brand equity. Multiple regression analysis identified that brand awareness, brand knowledge; perceived quality, purchase decision and post purchase behavior are the fundamental building blocks of brand equity.
Key Words: Brand Equity, Brand Value, Brand Awareness and Brand Knowledge.
INTRODUCTION
The most popular and potentially important marketing concept which has been extensively discussed by
both academicians and practitioners over the past decade is brand equity (Atligan, 2005). This is
because successful brands can allow marketers to gain competitive advantage. A brand is any label that carries meaning and associations, and a great brand lends coloration and resonance to a product or service (Kotler, 2003). A strong brand provides a series of benefits to a firm, such as greater customer loyalty and higher resiliency to endure crisis situations, higher profit margins, more favorable customer
response to price change, and licensing and brand extension opportunities (Kim, 2008). Furthermore,
according Pappu et al., high brand equity levels are known to lead to higher consumer preferences and purchase intentions.
The issue of brand equity has emerged as one of the most crucial topics for marketing management in the 1990s. The emergence of brand equity has raised the importance of marketing strategies and provided focus for managers and researchers (Boo, et al., 2009). A powerful brand has high brand equity. Brands have higher brand equity to the extent that they have higher brand loyalty, brand awareness, perceived quality, strong brand associations and other assets such as patents, trademarks and channel relationships. A brand with strong brand equity is a valuable asset. Brand equity is the added value endowed to products and services. This value may be reflected in how consumers think, feel, and act with respect to the brand, as well as the prices, market share, and profitability that the brand commands for the firm. Brand equity is an important intangible asset that has psychological and financial value to the firm (Kotler, 2007).
STATEMENT OF THE PROBLEM
The value of a brand and its equity is ultimately derived in the marketplace from the words and actions of consumers. Generally, consumers bank upon various factors before making their purchase decisions, yet most of them critically consider brand as one of the predominant factors influencing their choice of product. This underscores the significance of the brand for any product. It is an undisputed fact that brand plays a very crucial role especially in Ready to Eat Market. This market has been developed organically and vertically over the years in India. Over the coming years this market has huge potential for all its stakeholders to grow and develop. Despite this promising future, no empirical studies were undertaken in this area in the past. As brand plays a significant role in this market, the researcher is obviously interested in measuring and understanding brand equity of oats with the following researchable questions.
How far the brand equity influences among the oats consumers?
What are the factors influencing towards purchase decision?
How the consumers react after purchase of oats?
How the demographic variables are influencing on dimensions of brand equity?
By addressing all these questions, the present research would seek to build a knowledge base about the brand equity among oats consumers.
OBJECTIVES OF THE STUDY
1. To identify the predominant factors influencing the consumer-based brand equity of Oats; and
2. To analyse the influence of demographic variables on dimensions of brand equity.
RESEARCH STRATEGY
Survey Method has been followed for the study. Both primary and secondary data are used. The study depends mainly on the primary data collected through a well-structured questionnaire. The first part of questionnaire contains demographic backgrounds of consumers. The second part consists, consumption pattern of oats. In third part, the statements for measuring consumer-based brand equity are contained. To find out the consumer based brand equity Likert’s 5 point scaling technique is employed ranging from strongly agree [5] to strongly disagree [1]. This questionnaire was tested for its reliability and its Cronbach’s Alpha Co-efficient was 0.745. So, it is inferred that the questionnaire is highly suitable for the study. The secondary data are collected from the books, journals, magazines and web portals.
The sampling framework for this study is done in the following manner. First, Tiruchengode, one of the most popular urbanized town of Tamil Nadu is chosen for the study. Second, important streets are randomly selected. Third, oats consumers are selected by implementing snowball sampling method for collecting data. The sample size of 150 respondents has been duly selected for the study.
RESULTS AND DISCUSSION
The first part consists of demographic profile and consumption pattern of oats consumers. The second part vigilantly analyses the consumer-based brand equity with appropriate statistical tools.
DEMOGRAPHIC PROFILE
Consumers’ wants, preferences, and usages rates are often associated with demographic variables (Kotler, 2000). Demographics are easier to measure than any other segmentation variables; they are invariably included in psychographic and socio cultural studies because they add new colour to the findings of the study (Schiffman and Kanuk, 2000).
Table -1: Demographic Profile
Demographic Profile Classifications Frequency Percent
Age Below 30 41 27.3
31 - 40 77 51.3
41 - 50 16 10.7
Above 51 16 10.7
Total 150 100
Gender Male 70 46.7
Female 80 53.3
Total 150 100
Educational Qualification Up to HSC 21 14.0
Diploma / Technical 38 25.3
Graduate 91 60.7
Total 150 100
Marital status Unmarried 68 45.3
Married 82 54.7
Total 150 100
Family size Up to 3 50 33.3
4 - 6 75 50.0
Above 7 25 16.7
Total 150 100
Occupation Businessmen 32 21.3
Govt/private Employees 59 39.3
Professionals 13 8.7
Students 21 14.0
House Wife 25 16.7
Total 150 100
Monthly Income Below 5000 28 18.7
5001 - 10000 48 32.0
10001 - 15000 34 22.7
Above 15000 40 26.7
Total 150 100
married. Family size of the respondents shows that majority (50 percent) of the respondents having 4-6 dependents. Occupation-wise classification of the respondents infers that 39.3 percent of the respondents are Government / Private employees, followed by 21.3 percent of the respondents are businessmen and 16.7 percent of the respondents are housewives. Monthly income of the respondents explores that 32 percent of respondents are earning the income ranges between Rs.5001-10000 and 26.7 percent are earning more than Rs.15000 (Table 1).
CONSUMPTION PATTERN OF OATS
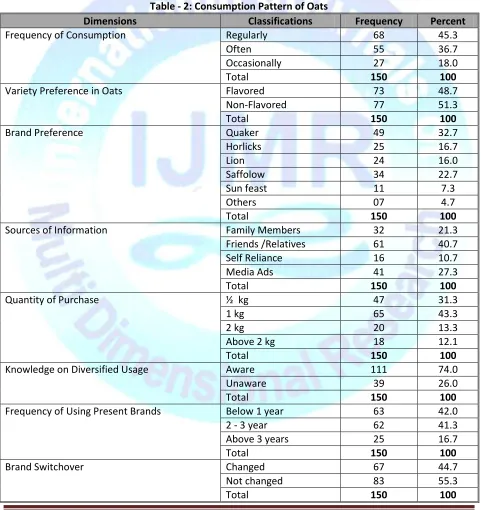
Consumption pattern of oats can be understood by various parameters such as, frequency of consumption, brand preference, sources of information in purchase decision and quantity of oats purchased. The results of these are presented hereunder:
Table - 2: Consumption Pattern of Oats
Dimensions Classifications Frequency Percent
Frequency of Consumption Regularly 68 45.3
Often 55 36.7
Occasionally 27 18.0
Total 150 100
Variety Preference in Oats Flavored 73 48.7
Non-Flavored 77 51.3
Total 150 100
Brand Preference Quaker 49 32.7
Horlicks 25 16.7
Lion 24 16.0
Saffolow 34 22.7
Sun feast 11 7.3
Others 07 4.7
Total 150 100
Sources of Information Family Members 32 21.3
Friends /Relatives 61 40.7
Self Reliance 16 10.7
Media Ads 41 27.3
Total 150 100
Quantity of Purchase ½ kg 47 31.3
1 kg 65 43.3
2 kg 20 13.3
Above 2 kg 18 12.1
Total 150 100
Knowledge on Diversified Usage Aware 111 74.0
Unaware 39 26.0
Total 150 100
Frequency of Using Present Brands Below 1 year 63 42.0
2 - 3 year 62 41.3
Above 3 years 25 16.7
Total 150 100
Brand Switchover Changed 67 44.7
Not changed 83 55.3
Frequency of oats consumption reveals that the majority (45.3 percent) of the respondents consume oats regularly. The choice of preference of oats explores that 51.3 percent of the respondents consume non-flavoured oats. The brand preference of oats indicates that 32.7 percent of the consumers’ choice is Quaker and 22.7 percent of the respondents’ preference is Saffolow. Friends and relatives constitute a major source of information (61 percent) for choosing a particular brand of oats. The quantity of purchase of oats reveals that 43.3 percent of the consumers buy 1 Kg oats in a month. 74 percent of
oats consumers are well aware about the preparation of diversified recipes using oats like Idli, Dosa,
Payasam, Upma, etc. Frequency of using present brand indicates that 42 percent of the respondents are consuming their brand of oats less than 1 year and 41.3 percent of the respondents are consuming for a period of 2-3 years. 44.7 percent of the respondents switch-over the brand of oats due to quality, quantity, sales offers, advertisement and affordable price consideration (Table 2).
PREDOMINANT FACTORS INFLUENCING CONSUMER-BASED BRAND EQUITY
Factor analysis with principal component method is applied to know the predominant factors influence in the brand equity. The KMO and Bartlett’s test for sampling adequacy for 30 variables are found to be 0.705 and the chi-square value of Bartlett's test for Sphericity is 1287.871. This clearly indicates that all the 30 variables are different and perfectly distributed in a normal distribution. This also emphasized that the factor analysis is suitable for 30 variables of brand equity (Table 3).
Table - 3: Factors Influencing in Brand Equity of Oats
Factor Label and Variables Variable
Loadings Factor - 1: Brand Awareness
I know the details manufacturers of the brands of oats using by me .794
I have sound knowledge about other brands of oats available in the market .752
Able to differentiate my brand to other brands available in the market .654
I know well about the free gifts and sales offers of the my present brand .650
Able to distinguish between original brand and spurious brand .552
Factor - 2: Brand Knowledge
It is very tasty .764
The flavor is good .642
It reduces hungry .618
It controls weight and cholesterol .576
High fiber content helps for easy digestion .493
Factor - 3: Perceived Quality
The brand is long lasting .768
I am satisfied with the quality of the brand .717
The quantity of the brand is comparatively good .590
Ingredients of the brand is good .494
The brand offers good utility to me .421
Factor - 4: Brand Association
Advertisements and other promotional activities of my brand is good .672
The information provided by the manufacturer of Oats is more reliable .566
More brand association is due to the utility of the brand .525
Factor - 5: Purchase Decision
Availability is important for my purchase decision .744
Factor Label and Variables Variable Loadings
Quantity must be reasonably good .608
I assess the quality of the products before the decision of purchase .601
Manufacturer’s name and reputation are very important to me .561
Utility of the brand is an important factor for purchase decision .472
Factor - 6: Post purchase Behaviour
I am satisfied with the utility of my brand .814
I am frequently discussed about my brand with others .785
I am felt happy with the people who use my brand .643
Make repeated purchase if the product is satisfactory .583
The brand which I use is the toppest brand .523
I am having much more affection on my brand .472
Extraction Method: Principal Component Analysis Rotation Method: Varimax with Kaiser Normalization Rotation converged in 17 iterations
The first brand equity dimension indicates that consumers give prime importance to know the
manufacturers details and they also having sound knowledge about other brands available as well in the market. They can able to differentiate from one brand to another brand. Further, they are well aware about the free gifts and sales offers provided by the sellers. So, it is suitably named as Brand Awareness.
The second brand equity dimension signifies that consumers strongly believe oats controls
weights, hungry and cholesterol. So, it is suitably called as Brand Knowledge.
Third factor described the Perceived Quality of the consumers. The consumers are highly
satisfied with the available quality and quantity of their oats brands. Further, consumers are also satisfied with the performance of their brand.
The fourth brand equity dimension portrays that the advertisement and other promotional
activities of manufacturers are highly attracting the oats consumers. Further, they believe that the information provided by the manufacturers is more reliable to bank upon. So, it is suitably named as Brand Association.
The fifth brand equity dimension depicts that the consumers of oats are having clear view about
the purchase decision. The purchase decision of oats is based on availability, quality, quantity, price, brand name and utility of brand. So, it is suitably called as Purchase Decision.
The sixth brand equity dimension shows that that the consumers of oats are highly satisfied with
Table - 4: Total Variance Explained
Component
Initial Eigen values Rotation Sums of Squared Loadings
Total % of
Variance
Cumulative
% Total
% of Variance
Cumulative %
Brand Awareness 7.78 6.38 37.66 3.52 7.00 32.03
Brand Knowledge 6.33 5.43 43.09 3.22 6.20 38.23
Perceived Quality 6.61 5.12 48.21 3.22 6.19 44.42
Brand Association 2.73 4.90 53.11 2.91 5.38 49.80
Purchase Decision 2.70 4.83 57.94 2.88 5.29 55.09
Post purchase Behaviour 2.59 4.54 62.48 2.77 5.01 60.10
The total variance table divulges that among six factors ‘Brand Awareness’ with highest variance of 6.38 percent influence among the consumers followed by ‘Brand Knowledge’ influence with the variance of 5.43 percent, ‘Perceived Quality’ with the variance of 5.12 percent, ‘Brand Association’ with the variance of 4.9 percent, ‘Purchase Decision’ with the variance of 4.83 percent and ‘Post purchase Behaviour’ with the variance of 4.54 percent influence in the brand equity dimensions (Table 4).
RELATIONSHIP BETWEEN DIMENSIONS OF CONSUMER-BASED BRAND EQUITY
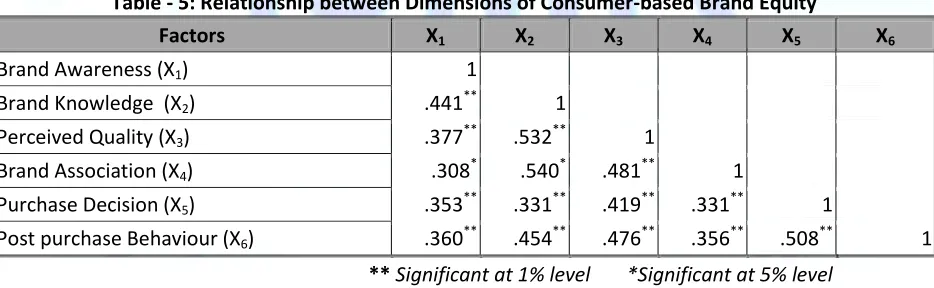
An attempt has been made to find out the relationship among various dimensions of brand equity such as brand awareness, brand knowledge, perceived quality, brand association, purchase decision and post purchase behavior. In this regard, Karl Pearson’s coefficient of correlation is employed.
Table - 5: Relationship between Dimensions of Consumer-based Brand Equity
Factors X1 X2 X3 X4 X5 X6
Brand Awareness (X1) 1
Brand Knowledge (X2) .441** 1
Perceived Quality (X3) .377** .532** 1
Brand Association (X4) .308* .540* .481** 1
Purchase Decision (X5) .353** .331** .419** .331** 1
Post purchase Behaviour (X6) .360** .454** .476** .356** .508** 1
** Significant at 1% level *Significant at 5% level
The correlation results explores that there exist a perfect correlation between the various dimensions of brand equity. This shows that all these dimensions are highly influencing in determining the consumer based brand equity (Table 5).
INFLUENCE OF DEMOGRAPHIC FACTORS ON BRAND EQUITY DIMENSIONS
Table - 6: Influence of Demographic Variables on the Dimensions of Brand Equity
Factors Age Gender Marital
status
Educational
Qualification Occupation
Monthly income
Brand Awareness 1.96** .30** 5.55* 6.22** 1.96* 0.86*
Brand Knowledge 1.96* .23* 3.88 11.43* 1.96** 2.78*
Perceived Quality 1.02* .96* 1.60* 10.68** 1.65* 0.92**
Brand Association 0.97* .75* 3.00* 17.28* 1.62* 4.17*
Purchase Decision 0.42* .59 2.32* 5.12* 1.51* 1.40
Post purchase Behaviour 1.22** 1.17 4.69 4.47 1.32* 1.88*
** Significant at 1% level *Significant at 5% level
Age of consumers significantly differs with brand awareness, brand knowledge, perceived
quality, brand association, purchase decision and post purchase behaviour.
Gender significantly varies with brand awareness, brand knowledge, perceived quality and
brand association.
Marital status of the respondents significantly differs with brand awareness, perceived quality,
brand association and purchase decision.
Educational qualification of the consumers significantly differs with brand awareness, brand
knowledge, perceived quality, brand association and purchase decision.
Occupation of the respondents significantly differs with brand awareness, brand knowledge,
perceived quality, brand association, purchase decision and post purchase behaviour.
Monthly income of the respondents significantly differs with brand awareness, brand
knowledge, perceived quality, brand association and post purchase behaviour.
MEASUREMENT OF OVERALL BRAND EQUITY OF OATS
The consumers’ attitude towards brand and purchase intention is called as overall brand equity (Andreas Lokken et al., 2012). To measure this overall brand equity, the scale developed by Yoo, Donthu (2001) and Wenbo Cui (2011) are adopted in this study. In this regard, One-sample ‘t’ test is used.
Table - 7: One-Sample ‘t’ Test for Overall Brand Equity
Variables Mean Std.
Deviation t Sig.
Even if another brand has the same feature as this brand, I would prefer to buy this brand
3.81 1.230 8.033 .000
If there is another brand as good as this brand, I would prefer to buy this brand
3.57 .951 7.296 .000
If there is another brand has same price as this brand, I prefer to buy this brand
3.27 1.034 3.158 .002
If I have to choose among brands of oats, this brand is definitely my choice
3.36 1.000 4.340 .000
CONSUMER BASED BRAND EQUITY MODEL
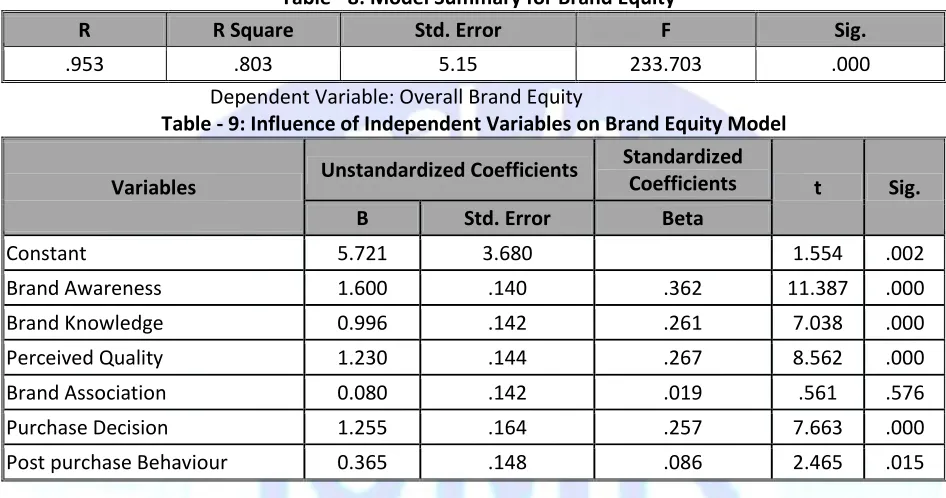
Factor analysis and its application reveals that the there exists a set of major factors among the elements of brand equity. Further, the multiple regression analysis is employed to find out the fundamental building blocks of brand equity.
Table - 8: Model Summary for Brand Equity
R R Square Std. Error F Sig.
.953 .803 5.15 233.703 .000
Dependent Variable: Overall Brand Equity
Table - 9: Influence of Independent Variables on Brand Equity Model
Variables Unstandardized Coefficients
Standardized
Coefficients t Sig.
B Std. Error Beta
Constant 5.721 3.680 1.554 .002
Brand Awareness 1.600 .140 .362 11.387 .000
Brand Knowledge 0.996 .142 .261 7.038 .000
Perceived Quality 1.230 .144 .267 8.562 .000
Brand Association 0.080 .142 .019 .561 .576
Purchase Decision 1.255 .164 .257 7.663 .000
Post purchase Behaviour 0.365 .148 .086 2.465 .015
The R2 value (.803) indicates that 80.3 percent of variation in the brand equity is influenced by the set of
Fig. 1: Consumer-Based Brand Equity Model
CONCLUSION
Branding plays a very vital role in today’s business competitive environment. This study explored the various dimensions of consumer-based brand equity of oats such as brand awareness, brand knowledge, perceived quality, purchase decision and post purchase behaviour which forms a model for construction of model for consumer-based brand equity. This study is useful to oats marketers to understand and comprehend the dimensions of consumer-based brand equity of oats. Further, this study suggests that the marketing agencies are advised to conduct health awareness programs to educate the people about the need for consumption of oats such as fat and cholesterol control. Moreover, this study may provide the useful information in the direction of designing the clutter breaking sales promotion strategies to managers.
REFERENCES
Aaker David A., (1991), Measuring Brand Equity, Free Press, New York.
Andreas Lokken, Malini Nayar and Maria Runering, (2012), Brand Equity - Measuring Corporate
Brand Strength in the Swedish Smartphone Market Dimensions of Corporate Brand Equity from a Consumer Perspective, School of Management, Blekinge Institute of Technology, Karlskrona, Sweden, p.25.
Atligan, E., (2005), Determinants of the Brand Equity a Verification Approach in the Beverage
Industry in Turkey, Marketing Intelligence & Planning, Vol. 23 (3), pp.237-248.
Aziz, N. A., & Yasin, N. M., (2010), Analyzing the Brand Equity and Resonance of Banking
Services: Malaysian Consumer Perspective, International Journal of Marketing Studies, Vol. 2(2), pp.180-189.
Emari Hossien (2011), Determinants of Brand Equity: Offering a Model to Chocolate Industry,
Working Paper, World Academy of Science, Engineering and Technology, pp.1205-10213.
Farquhar, P.H., (1989), Managing Brand Equity, Journal of Marketing Research, Vol.1 (3),
pp.24-33.
Brand
Equity
Brand Awareness
Brand Knowledge
Perceived Quality Purchase
Decision Post
Henry Tsai, C Cheung, A Lo (2010), An Exploratory Study of the Relationship between
Customer-Based Casino Brand Equity and Firm Performance, International Journal of Hospitality
Management, Vol.29 (4), pp.754-757
Jeou-Shyan Horngab, Chih-Hsing Liuc, Hsin-Yu Chiua & Chang-Yen Tsaid (2012), The Role of
International Tourist Perceptions of Brand Equity and Travel Intention in Culinary Tourism, The
Service Industries Journal, Vol. 32 (16), pp.2607-2621.
Kamakura, A. W. and Russell G. J., (1993), Measuring Brand Value with Scanner Data.
International Journal of Research in Marketing, Vol. 10 (March), pp.9-22.
Keller, K.L. (2001), Building Customer Based Brand Equity: A blue print for creating strong
brands, Marketing Science, Institute Working Paper Series, Report 1, p.107.
Keller, K.L. (2002). Strategic Brand Management: Building, Measuring, and Management Brand
Equity (Second Edition). Pearson Education Ltd., New York.
Keller, K.L. and Lehmann, D.R. (2006) “Brands and Branding: Research Findings and Future
Priorities”, Marketing Science, 25, 6, pp. 740-759.
Keller, Kevin L., (1998), Strategic Brand Management-Building, Measuring, and Managing Brand
Equity, Englewood Cliffs, NJ: Prentice Hall, p. 42.
Kevin Lane Keller, (1993), Conceptualizing, Measuring Consumer Based Brand Equity, Journal of
Marketing, Vol.57 (1), pp.1-22.
Kim, K., (2008), Brand Equity in Hospital Marketing, Journal of Business Research, Vol. 61, pp.
75-82.
Kotler, P. (2000), Marketing Management (10th Edition), Prentice Hall, New Jersey.
Leone P.RRao., V.R., Keller K.L., Luo A.M., McAlister L., Srivastava R., (2006), Linking Brand Equity
to Customer Equity, Journal of Service Research, Vol.9 (2), pp.125-138.
Pappu, R., (2006), Consumer-Based Brand Equity and Country-Of-Origin Relationships Some
Empirical Evidence, European Journal of Marketing, Vol. 40, (5), pp. 696-717.
Rangaswamy A, Burke R and Oliva T., (1993), Brand Equity and the Expendability of Brand
Names. International Journal of Research in Marketing, Vol.10 (1), pp.61-75.
Rosa R. E., & Riquelme H. E., (2008), Brand Equity for Online Companies, Marketing Intelligence
& Planning, Vol. 26(7), pp. 719-742.
Salinas, E., Perez, J., (2009), Modeling the Brand Extensions' Influence on Brand Image, Journal
of Business Research, Vol. 62, pp. 50-60.
Samantha Kumara, P.A.P and Kang Canhua (2010), Perceptions of Country of Origin: An
Approach to Identifying Expectations of Foreign Products, Journal of Brand Management,
Macmillan Publisher’s Ltd, pp.343-353.
Simon, Carol and Mary Sullivan (1993), The Measurement and Determinants of Brand Equity: A
Financial Approach, Marketing Science, Vol.12 (winter), pp.28-52.
Srivastava, R (2009), Brand Equity Measurement in India - How to be more realistic?
International Journal of Indian Culture and Business Management, Vol.2 (3), pp. 295-306.
Stella Kladou, John Kehagias (2013), Assessing Destination Brand Equity: An Integrated
Approach, Journal of Destination Marketing & Management, November, p.323.
Sudhir Gupta (2011), Marketing Management, Tata Mc Graw Hill, New Delhi.
Vasan, M. (2006). Consumer Behaviour and Brand Preferences of Britannia Biscuits - An
Empirical Study with reference to Salem, Tamil Nadu. Indian Journal of Marketing, 36(8),
17-21&39.
Vasan, M. (2006). Customer Satisfaction on ICICI Bank Debit Cards. Economic Challenger, 33(9),
71-74.
Vasan, M. (2011). Consumer Shopping Behaviour in Retail Stores - A Case of Salem District. International Journal of Marketing & Management Research, 2 (7), 226-237.
Vasan, M. (2014). Customers’ Satisfaction towards Internet Banking of ICICI Bank Limited - A
Study in Erode City, Vidushi, 6 &7 (1), 13-26.
Vasan, M. (2016). Consumers’ Perception towards Viral Marketing in Erode City. International
Journal of Research & Business Innovation, 2(1), 13-18.
Vasan.M. (2014). Marketing Management. Coimbatore: Bornfring Publishers.
Wenbo Cui (2011), Creating Consumer-Based Brand Equity in the Chinese Sports Shoes Market:
Measurement, Challenges and Opportunities, Published Master of Science Thesis, Aalborg University, Denmark, p.71.
Yoganandan, G., & Prabhukumar, G. (2015). Consumer Buying Behavior towards Books in Erode
City. International Journal of Research,2 (1), 609-614.
Yoganandan, G., & Sakthivel, M. (2015). Brand Preference towards Toothpaste in Namakkal
District, Tamilnadu. International Journal of Research in Management Studies, 5(1), 1-9.
Yoo B., Donthu N., Lee S., (2000), An Examination of Selected Marketing Mix Elements and
Brand Equity, Academy of Marketing Science Journal, Vol. 28 (2), pp. 195-211.
Zeithaml V.A., (1988), Consumer Perceptions of Price, Quality, and Value: A Means-end Model