Article
1
Conceptual Framework for Assessing Organization’s
2
Readiness to Big Data Adoption
3
Celina M. Olszak 1 and Maria Mach-Król 1 *
4
1 Dept. of Business Informatics, University of Economics in Katowice, Bogucicka 3a, 40-287 Katowice,
5
Poland; [email protected] (C.M.O.); [email protected] (M.M.-K.)
6
* Correspondence: [email protected]; Tel.: +48 32 257 76 11
7
8
Abstract: The main aim of this paper is to explore the issue of big data and to propose a conceptual
9
framework for big data, based on the temporal dimension. The Temporal Big Data Maturity Model
10
(TBDMM) is a means for assessing organization’s readiness to fully profit from big data analysis. It
11
allows the measurement of the current state of the organization’s big data assets and analytical tools,
12
and to plan their future development. The framework explicitly incorporates a time dimension,
13
providing a complete means for assessing also the readiness to process temporal data and/or
14
knowledge that can be found in modern sources, such as big data ones. Temporality in the proposed
15
framework extends and enhances the already existing maturity models for big data. This research
16
paper is based on a critical analysis of literature, as well as creative thinking, and on the case-study
17
approach involving multiple cases. The literature-based research has shown that the existing
18
maturity models for big data do not treat the temporal dimension as the basic one. At the same time,
19
dynamic analytics is crucial for a sustainable competitive advantage. This conceptual framework
20
was well received among practitioners, to whom it has been presented during interviews. The
21
participants in the consultations often expressed their need of temporal big data analytics, and hence
22
the temporal approach of the maturity model was widely welcomed.
23
Keywords: big data; maturity model; temporal analytics; advanced business analytics
24
25
1. Introduction
26
Organizations collect and analyze information for different purposes. They may refer to [1]: (1)
27
the deepening and expanding of the existing business, (2) risk management, (3) information control
28
and security control and management, as well as (4) information manipulation. Until now,
29
organizations usually have gathered and analyzed internal information in order to better understand
30
their business processes and to improve decision-making on an operational and tactical level [2].
31
Recently, they have started to collect and explore the external information that comes from the
32
organizational environment, e.g.: from competitors, industries, government, administration, and
33
healthcare [3,4]. Such data called “big data” refers to databases whose size is beyond the ability of
34
typical databases software tools to capture, store, manage, and analyze.
35
Big data is generally characterized by 7Vs, which stand for Volume, Velocity, Variety, Veracity,
36
Variability, Visualization and Value [5]. In contemporary fast-paced economy, especially the velocity
37
dimension of big data is extremely important, as the speed of action is critical to gaining a sustainable
38
competitive advantage. Organizations have to respond in almost real time to rise to emergent
39
challenges and opportunities [6]. For this reason, real-time big data analytics gains importance. One
40
of the hottest trends for 2018 in big data analytics is real-time data analytics, another concerns data
41
visualization [7]. All definitions of big data as e.g. those listed in [5] put the emphasis on big data
42
volume, variety, and rate of change (velocity) – revealing at the same time the strong linkage between
43
big data analytics and new business insights [8]. These analytical procedures may be even called
44
temporal big data analytics that is analytics focused on data change, and on time dimension in the
45
domain being analyzed. At the same time, the greatest benefits (as perceived by top management)
46
for a competitive organization come from the use of all data available from inside and outside at the
47
same time, its blending, integration, and then real-time analysis of this holistic view [7]. A sustainable
48
competitive advantage, and sustainable development are more and more dependent on the
49
organization’s ability to manage big data, information, and knowledge [9,10,11]. In this way
50
advanced data analytics, and sustainable competitive advantage are eternally linked together.
51
Research shows that any organization willing to be competitive and innovative must be
self-52
adjusting, sensing and responding to the continued market relevance and viability/sustainability [12].
53
The real-time big data analytics is one of the ways to achieve this state.
54
It is widely understood that new sources of insight need to be used, as big data analytics is a
55
new enabler of sustainable competitive advantage. It enables improved business efficiency because
56
of its high operational and strategic potential [13]. “Big data analytics (…) has emerged as the new
57
frontier of innovation and competition” [14] (p.190).
58
The main aim of this paper is to explore the issue of big data and to propose a conceptual
59
framework for big data, based on the temporal dimension. Temporality in the proposed framework
60
extends and enhances the already existing maturity models for big data developed e.g. by [15-19].
61
The existing frameworks in fact take into account only the 5Vs – Volume, Variety, Veracity,
62
Visualization, Value. The proposed framework also incorporates the 6th, and the 7th “V” – Velocity
63
and Variability. It provides a complete means for assessing not only the current state of the
64
organization’s big data assets and analytical tools, but also the organization’s readiness to process
65
temporal data and/or knowledge that can be found in modern sources, such as big data ones.
66
The structure of the paper is as follows. In Section 2 related work concerning big data,
67
sustainability, and maturity models is presented and discussed. Section 3 is devoted to the framework
68
of TBDMM. In Section 4 the reception of the TBDMM among managers is presented in detail. Section
69
5 contains discussion of research findings, and in Section 6 concluding remarks are included.
70
2. Related Work
71
2.1. Big Data and Sustainability Issues
72
The interest in analytics in information systems domain has continued for many years. This is
73
reflected in research that was conducted in the 80’s and 90’s of XX century and that has referred
74
mainly to Management Information Systems (MIS), Decision Support Systems (DSS), Enterprise
75
Information Systems (EIS) [2, 20-22]. The 21st century is characterized by the development of data
76
warehousing, Online Analytical Processing (OLAP), Business Intelligence (BI), Competitive
77
Intelligence (CI) and lastly big data. The common assumption underlying these analytical systems is
78
that an appropriately acquired, collected, analyzed, integrated and used information may be a critical
79
component for the success of the organization. Analytical systems may help organizations to reach
80
strategic goals, make better decisions, improve business processes, increase profitability and
81
improve customer satisfaction [22-26]. At the same time it is emphasized that this challenge becomes
82
more difficult with the constantly increasing volume of information, both internal and external to an
83
organization.
84
To better understand the idea of big data is worth recalling the basic assumptions underlying
85
the idea of BI and CI that present last stages in the evolution of analytical systems. It is stated that BI
86
is focused mainly on gathering and analyzing internal information, thus it helps to improve internal
87
business processes and decision-making on an operational and tactical level of organizations [2]. CI
88
refers to collection and exploration of external information that comes from the organizational
89
environment [3,4]. This includes information about competitors, industries, governments and nations
90
for management strategy, as well as information about external background (technology, politics,
91
economy, society and culture), the changing business environment and trends of suppliers, exporting
92
nations, competitors and overseas markets. Organizations believe that the aforementioned
93
information is as valuable for them (and sometimes even more) as information that comes from their
94
environment, their competitors and establish competitive management strategies will win in this
96
rapidly globalized information society [1,21,27].
97
Steyl [28] argues that BI cannot replace CI and vice versa. BI is the management of an
98
organization’s internal data and processes that are well structured. This includes the Extract,
99
Transform and Loading (ETL) of this data in a well-designed data warehouse in order to extract and
100
present the data as intelligent information. BI may help any business make better decisions based on
101
its own historic information and can therefore project possible future trends. Typical BI tools include:
102
reporting, OLAP, data warehouse, data mining and visualization tools. In turn, the data that
103
originates from external sources, distinctive for CI, is usually semi-structured and unstructured.
104
Thus, the tools used to collect, process and analyze the data (known from typical BI systems) are
105
inadequate and insufficient. This does not mean that the functions like: reporting, OLAP, simple data
106
mining are depreciated. They have still their strong position in CI.
107
Big data, compared to BI and CI, concerns an even broader spectrum of data and more complex
108
and sophisticated data processing. It generally refers to data that exceeds the typical storage,
109
processing, and computing capacity of conventional databases and data analysis techniques [29]. As
110
a resource, big data requires tools and methods that can be applied to analyze and extract patterns
111
from large-scale data. The rise of big data has been caused by increased data storage capabilities,
112
increased computational processing power, and the availability of increased volumes of data, which
113
give organizations more data than they have computing resources and technologies to process [30].
114
Big data concerns mainly unstructured information about competitors, customers and other
115
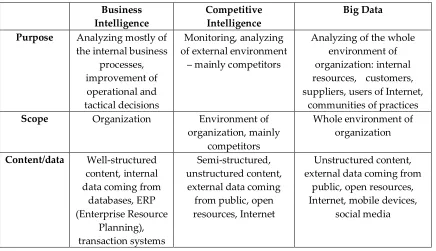
stakeholders of the organization (Table 1).
116
Table 1. The basic differences between BI, CI and big data.
117
Business Intelligence
Competitive Intelligence
Big Data
Purpose Analyzing mostly of the internal business
processes, improvement of
operational and tactical decisions
Monitoring, analyzing of external environment
– mainly competitors
Analyzing of the whole environment of organization: internal resources, customers, suppliers, users of Internet,
communities of practices
Scope Organization Environment of
organization, mainly competitors
Whole environment of organization
Content/data Well-structured content, internal data coming from
databases, ERP (Enterprise Resource
Planning), transaction systems
Semi-structured, unstructured content, external data coming
from public, open resources, Internet
Unstructured content, external data coming from
public, open resources, Internet, mobile devices,
Business Intelligence
Competitive Intelligence
Big Data
Used tools, technologies
OLAP, data mining, data warehouse
Advanced data mining, predictive modeling,
web mining, text mining, exponential random graph models,
search based applications, dashboards, SOA
Advanced data mining, predictive modeling, web
mining, opinion mining, text mining, exponential random graph models, search based application, dashboards, SOA (Service Oriented Architecture),
Hadoop, Spark, MapReduce, parallel processing, real-time processing, machine learning techniques
118
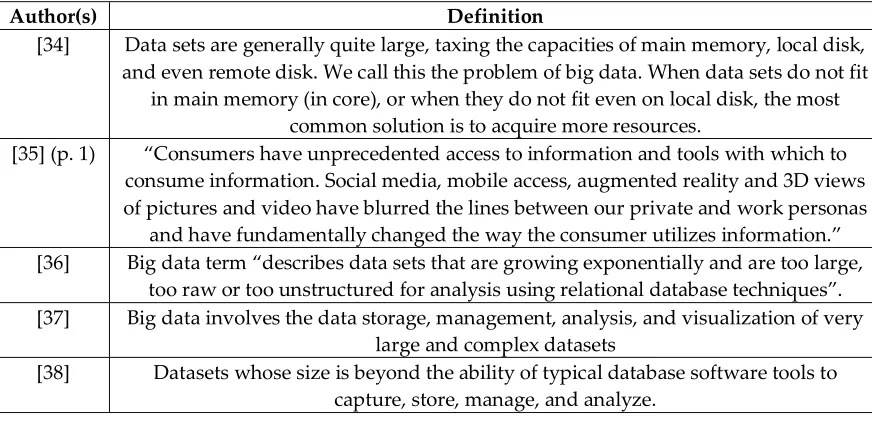
The critical analysis of the subject literature shows that there is no consensus in interpretation of
119
big data term (Table 2).
120
According to Ferguson [31] the term “big data” is “associated with the new types of workloads
121
and underlying technologies needed to solve business problems that could not be previously
122
supported due to technology limitations, prohibitive cost or both”. Big data is therefore not just about
123
data volumes but about analytical workloads that are associated with some combination of data
124
volume, data velocity and data variety that may include complex analytics and complex data types.
125
It is believed that big data analyzed in combination with traditional organization data (mostly
126
structured and semi-structured), enable organizations not only to better understand their business,
127
but first of all to change it and to have new sources of revenues, stronger competitive position and
128
greater innovation. The most widely accepted definition of big data is the one by Gartner [32] – cf.
129
Table 2. Gartner stresses the role of big data as a new type of asset, which – if properly addressed –
130
may give organizations enhanced insights and better decision making. In turn, the most extensive
131
definition of the big data notion has been given by [33], focusing on data heterogeneity, lack of
132
structure, and the Internet as big data source. Analyzing such data, organizations gain deeper
133
understanding of the economic environment, which may lead to the creation of sustainable business
134
and a sustainable competitive advantage.
135
Table 2. Sample various definitions of big data term, listed in chronological order.
136
Author(s) Definition
[34] Data sets are generally quite large, taxing the capacities of main memory, local disk, and even remote disk. We call this the problem of big data. When data sets do not fit
in main memory (in core), or when they do not fit even on local disk, the most common solution is to acquire more resources.
[35] (p. 1) “Consumers have unprecedented access to information and tools with which to consume information. Social media, mobile access, augmented reality and 3D views of pictures and video have blurred the lines between our private and work personas and have fundamentally changed the way the consumer utilizes information.” [36] Big data term “describes data sets that are growing exponentially and are too large,
too raw or too unstructured for analysis using relational database techniques”. [37] Big data involves the data storage, management, analysis, and visualization of very
large and complex datasets
Author(s) Definition
[39] Big data involves more than simply the ability to handle large volumes of data; instead, it represents a wide range of new analytical technologies and business possibilities. These new systems handle a wide variety of data, from sensor data to
Web and social media data, improved analytical capabilities, operational business intelligence that improves business agility by enabling automated real-time actions and intraday decision making, faster hardware and cloud computing including
on-demand software-as-a service. Supporting big data involves combining these technologies to enable new solutions that can bring significant benefits to the
business.
[31] Big data is “associated with the new types of workloads and underlying technologies needed to solve business problems that could not be previously
supported due to technology limitations, prohibitive cost or both”
[40] Big data term is “used to describe data sets so large, so complex or that require so rapid processing (…) that they become difficult or impossible to work with using
standard database management or analytical tools”.
[41] Big data: high-volume, high-velocity, and/or high-variety information assets that require new forms of processing to enable enhanced decision making, insight
discovery, and process optimization.
[42] Big data, like analytics before it, seeks to glean intelligence from data and translate that into business advantage. However, there are three key differences: Velocity,
variety, volume.
[43] Big data focuses on three main characteristics: the data itself, the analytics of the data, and presentation of the results of the analytics that allow the creation of
business value in terms of new products or services.
[44] Big data: a cultural, technological, and scholarly phenomenon that rests on the interplay of (1) Technology: maximizing computation power and algorithmic accuracy to gather, analyze, link, and compare large datasets. (2) Analysis: drawing on large datasets to identify patterns in order to make economic,
social, technical, and legal claims. (3) Mythology: the widespread belief that large datasets offer a higher form of intelligence and knowledge that can generate insights
that were previously impossible, with the aura of truth, objectivity, and accuracy. [45] Big data is massively generated by uncountable online interactions between people,
by human-systems transactions, and by sensor devices. [46] Big data is a combination of volume, variety, velocity and veracity that
creates an opportunity for organizations to gain sustainable competitive advantage in today’s digitized marketplace.
[47] Big data is no subject to sampling, it is linked with building databases from electronic sources, with no intention of statistical inference.
[48] Big data refers to datasets with sizes beyond the ability of common software tools to capture, curate, manage, and process the data within a specified elapsed time. [32] Big data is high-volume, high-velocity and high-variety information assets that
demand cost-effective, innovative forms of information processing for enhanced insight and decision making.
[49] (p. 21)
“Companies today are overgrown with information, including what many categorize as big data. The jungle includes information about customers, competition, media and channel performance, locations, products, and transactions,
to name just a few (…)” [17] (p.
xxi)
“(…) big data is about leveraging the unique and actionable insights gleaned about your customers, products, and operations to rewire your value creation processes,
Author(s) Definition [50] (p.
89)
“big data (…) means that the organization’s need to handle, store, and analyze data (its volume, variety, velocity, variability, and complexity) exceeds its current
capacity and has moved beyond the IT comfort zone.”
[51] Big data involves the data storage, management, analysis, and visualization of very large and complex datasets. It focuses on new data-management techniques that supersede traditional relational systems, and are better suited to the management of
large volumes of social media data.
[52] Big data consists of expansive collections of data (large volumes) that are updated quickly and frequently (high velocity) and that exhibit a huge range of different
formats and content (wide variety).
[53] The broad range of new and massive data types that have appeared over the last decade or so.
[54] A new attitude by businesses, non-profits, government agencies, and individuals that combining data from multiple sources could lead to better decisions. [55] Big data is large-scale data with various sources and structures that cannot be
processed by conventional methods and that is intended for organizational or societal problem solving.
[56] Data of a very large size, typically to the extent that its manipulation and management present significant logistical challenges.
[57] Big data: the data-sets from heterogeneous and autonomous resources, with diversity in dimensions, complex and dynamic relationships, by size that is beyond the capacity of conventional processes or tools to effectively capture, store, manage,
analyze, and exploit them.
[58] Big data typically refers to the following types of data: (1) traditional enterprise data, (2) machine-generated/sensor data (e.g. weblogs, smart meters, manufacturing
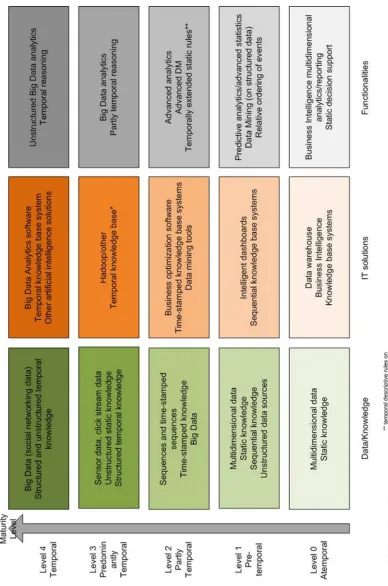
sensors, equipment logs), and (3) social data.
[33] Big data often represents miscellaneous records of the whereabouts of large and shifting online crowds. It is frequently agnostic, in the sense of being produced for generic purposes or purposes different from those sought by big data crunching. It is based on varying formats and modes of communication (e.g. text, image, and sound), raising severe problems of semiotic translation and meaning compatibility. Big data is commonly deployed to refer to large data volumes generated and made
available on the Internet and the current digital media ecosystems. [59] Big data is an emerging paradigm applied to datasets whose size is beyond the
ability of commonly used software tools to capture, manage, and process the data within a tolerable elapsed time.
[60] “Big data” means enormous volumes of data. The data can be divided as structured data and unstructured data. Various methods are applied to collect these data.
137
Analyzing the literature it should be noted that the term “big data” may be described from
138
technical or organizational perspectives. From a technical point of view, big data means new
139
technologies, tools giving the possibility of processing huge amounts of data, coming from such new
140
sources, as sensors, social media, real-time systems. From an organizational point of view, big data
141
means new ways of running a business, of decision making, of understanding the customers,
142
suppliers and other stakeholders of organizations. First pieces of research show that big data can
143
completely change the functioning of an organization [61]. Recently the notion of smart data has been
144
gaining popularity [62,63] – meaning big data that has been initially preprocessed. “Smart data arises
145
by expediently structuring information from big data which then can be used for knowledge
146
advances and decision making” [64].
147
According to [49] and [17], big data is a new asset that opens valuable opportunities to
148
encompassing inter alia insights into customers interests, passions, affiliations, and associations,
150
product performance recommendations, and location-based insights. In this way, organization is able
151
to quickly respond to external challenges/trends, to make faster decisions, to get more precise
152
answers from data [50].
153
It is believed that big data analyzed in combination with traditional organization data (most
154
structured and semi-structured), enable organizations not only to better understand their business,
155
but first of all to change it and to have new sources of revenues, a stronger competitive position and
156
greater innovation. Nelson [35] argues that the implementation of big data in management will
157
contribute mainly to:
158
decisions, facts and context will be developed through crowdsourcing;
159
data and reports will incorporate narrative context information supplied by users;
160
data will have a more direct linkage with action;
161
people will be able to directly act on information;
162
business decisions will be monitored so that interventions and hypotheses about business tactics
163
will be tagged in the context of the data that measures its effect;
164
visualization data and complex relationships will be easier, and more intuitive models of
info-165
graphics will become mainstream;
166
the ability to detect complex patterns in data through automated analytic routines or intelligent
167
helper models will be built into analytic applications;
168
finding information will be easier, and search results will provide context so that it is known
169
when the results are right.
170
It is stated that big data enables the creation of innovative business models, products and
171
services. It gives organizations a way to outperform the competition. This kind of data may be used
172
to achieve a better understanding of an organization’s customers, employees, partners and
173
operations, with an eye towards improving every aspect of the business [36]. Big data may
174
complement BI systems, providing in-depth insights and predictive analytics on unstructured
175
massive data. Big data gives a completely new kind of insight, with analyses of social media, images,
176
natural language and so on. With big data the unstructured web content may be understood and
177
used for predictive analysis. With such possibilities, big data sources may be used for analysis in such
178
areas, as decision making, customer insights, competitive intelligence systems, marketing or human
179
resources. The customers and the competitors are now understood, and the decisions are better, as
180
they are fact-based [65]. Schmarzo [17] gives some examples of new insights, possible with big data.
181
These are, among others:
182
resource scheduling based on purchase history, buying behaviors, local weather and events;
183
distribution and inventory optimization given current and predicted buying patterns, local
184
demographic, weather, and events data;
185
integrating analytics directly into products to create “intelligent” products;
186
insights about customers’ usage patterns, product performance behaviors, and overall market
187
trends.
188
These insights may be also accompanied with social media analysis, when an organization gets
189
feedback on customers’ needs and expectations concerning current and future products/services. As
190
pointed out in [66] modern organizations face several new megatrends, one of which is globalization.
191
It is therefore not sufficient to analyze only the closest economic environment in order to be
192
competitive, but organizations have to consider also the globalization processes. One of the current
193
globalization challenges is to ensure a sustainable evolvement of human existence in its social,
194
environmental and economic dimensions. Hence, business value creation must be geared towards
195
sustainability [64]. According to [67] “sustainability is a paradigm for thinking about the future in
196
which environmental, societal and economic considerations are equitable in the pursuit of an
197
improved lifestyle” and innovative solutions (as business models, goods, services) have to be
198
developed according to this new paradigm. Big data has the potential to transform business processes
199
realizing sustainable business value creation in the three sustainability dimensions: economic, social,
201
and environmental [64]. As claimed in [69], these new business models can contribute to solving an
202
environmental or social problem. It is even postulated to treat big data captured and analyzed by
203
organizations as a knowledge commons, helping to create innovative solutions to various
204
socioeconomic problems [70]. It is also argued that real-time big data analytics may provide the basis
205
for a more efficient, sustainable, competitive, and productive organization [10]. In this way temporal
206
big data analytics may link together a successful organization and sustainability.
207
As the number of data sources and types increases, sustaining trust in big data analytics presents
208
a practical challenge. The IBM research has shown that 1 of 3 managers do not trust information used
209
in their decision processes, and 27% of managers were unsure of data and information accurateness
210
[71]. Big data analytics faces a number of challenges beyond those implied by the seven Vs. While not
211
meant to be an exhaustive list, some key problem areas include mainly: data quality and validation,
212
data cleansing, parallel and distributed data processing, real-time analysis and decision making,
213
crowdsourcing and semantic input for improved data analysis, parallel and distributed computing,
214
exploratory analysis, and developing new models for massive data computation [30].
215
Despite many potential benefits of big data analytics, pointed out above, still the current level of
216
take-up is not satisfactory [7]. Most probably this is due to the fact that many organizations lack the
217
knowledge on how to organize, and create big data insights, and how to profit from them. The theory
218
of maturity models may provide the ways and guidelines to develop the big data idea in
219
organizations.
220
2.2. Maturity Models
221
The most concise definition of maturity says that it is “a state of being complete, perfect or ready”
222
[72]. A broader one is given by Cooke-Davies [73], who points out that maturity arises gradually as
223
a result of a process of shaping the needed features, enabling the performance of certain tasks.
224
Therefore maturity is a state that may be graduated, from extreme immaturity to extreme maturity.
225
In order to do this, series of so-called maturity models – concerning different phenomena – has been
226
elaborated.
227
According to [72, 74] a maturity model is a means of identifying strong and weak points of a
228
certain domain, and is used to assess an organization (or its part), and to delineate its development
229
path. Most commonly maturity models come from a well-known and appreciated Capability
230
Maturity Model (CMM) model, established in 1991 for a software development process. It was then
231
followed by a Capability Maturity Model Integration (CMMI) model for assessing process maturity.
232
In the latter model – as well as in many of its followers from different domains – a phenomenon is
233
assessed on one of (most commonly) five maturity levels. The typical maturity levels are presented
234
in Fig. 1. The main aim of using maturity models is to codify knowledge on good processes/activities,
235
on their assessment criteria, and to elaborate systematized way of assessing a domain [75].
236
Figure 1. Description of maturity levels in the process approach (the CMM model) [76].
238
Maturity models may be in general divided into the following categories [77]:
239
descriptive – used to determine organization’s level of maturity;
240
prescriptive – describing a desired state and assessing organization’s distance to it;
241
transitive – determining the steps that an organization must follow to reach the desired state.
242
As already pointed out, maturity models were first elaborated for process management, and
243
software development, but their usefulness and elasticity made them popular in other domains. Also
244
in the big data domain a maturity model may be a means of assessing organization’s capability to
245
adopt this new phenomenon.
246
2.3. Maturity Models for Big Data
247
Most commonly it is proposed to use classical CMM and/or CMMI models to assess an
248
organization’s capability to adopt big data. Such approach is presented e.g. in [78]. Spaletto [79]
249
proposes to use CMM while assessing an organization’s big data strategy, and standards of data
250
growth management. Such an approach would enable identifying effective strategies for managing
251
exponential data growth.
252
[80] propose to use CMMI and/or Software Process Improvement and Capability Determination
253
(SPICE) models to assess web engineering systems, because using them one may consider also the
254
latest trends, such as e.g. cloud computing, which is closely related to big data. Hence it would be
255
possible to adapt this approach in order to investigate an organization’s maturity in adopting big
256
data.
257
The SaaS maturity model, proposed in [81] may be considered partially a model of an
258
organization’s maturity in the big data journey. It is so, because any organization capable of using
259
SaaS is also capable of using big data. These authors propose to assess maturity in the context of
260
service components, linking them to the levels of maturity.
261
The first model defined for assessing an organization’s readiness to fully adopt big data
262
capabilities has been proposed by The Data Warehouse Institute (TDWI). The TDWI Big Data
263
Maturity Model describes the steps that every organization has to follow while undertaking big data
264
initiatives. The model shows how to transform an organization to fully profit from big data, and is
265
composed of five levels [15]: nascent, pre-adoption, early adoption, corporate adoption, and
266
mature/visionary.
267
Radcliffe Advisory Services [16] proposes Big Data Maturity Model, aimed at arranging notions
268
connected to big data, assessing the current state of organization, and building a vision of using big
269
data in the future. The model is similar to other maturity models and is composed of six levels: five
270
main ones, and an additional one, described as “level 0” (“In the Dark”), where organizations do not
271
even realize the existence of big data. The next levels are called Catching up, First Pilot(s), Tactical
272
Value, Strategic Leverage, Optimize and Extend. The Radcliffe model is rather general, and the
273
company offers only a set of big data hints, which would help organizations pass all the maturity
274
levels [82].
275
Schmarzo [17] proposed the Big Data Business Model Maturity Index as a tool for assessing the
276
maturity of business model in the context of big data usage. As Schmarzo claims, organizations may
277
use this index to:
278
1. get information on the stage of using advanced big data analytics, on their value creation process,
279
and on business models – that is, get information on current state;
280
2. identify desired target state.
281
Schmarzo’s model is composed of five levels (stages): Business Monitoring, Business Insights;
282
Business Optimization; Data Monetization, Business Metamorphosis. The first three levels are
283
focused on organization’s interior, on optimizing its internal business processes. The last two levels
284
It has to be noted, however that none of the existing big data maturity models, discussed in this,
286
and previous sections, accommodate such an important factor, as time, while the temporal dimension
287
is essential due to the big data velocity. For this reason, in this paper a new conceptual framework
288
for assessing organization’s readiness to big data adoption is proposed. The framework, named
289
Temporal Big Data Maturity Model (TBDMM) explicitly incorporates the temporal dimension.
290
Temporality in the proposed maturity framework is the element that complements other models, and
291
enables for a full adoption of big data’s 7Vs. The existing models in fact take into account only 5Vs –
292
Volume, Variety, Veracity, Visualization, Value, while the framework proposed in this paper
293
incorporates also the 6th, and the 7th “Vs” – Velocity and Variability. In this way, adding this new
294
dimension, the presented new maturity framework is more complete than the existing ones.
295
3. Framework of the Temporal Big Data Maturity Model (TBDMM)
296
3.1.Levels of Temporality
297
The main idea of the proposed framework – to incorporate the time dimension in it – results
298
from several observations. First, knowledge in an organization, and knowledge from big data is
299
mostly temporal in characteristics. This means that with the passing of time knowledge changes, new
300
information comes on objects that knowledge concerns, if these object poses temporal characteristics.
301
It can be therefore said that this knowledge dimension that is called “time” is in this case explicit.
302
Thus, omitting this dimension would lead to losing important elements of knowledge – temporal
303
features. Having this in mind, time becomes for an organization a very important category in the area
304
of knowledge usage.
305
Second, introduction of time allows an organization to perform inference about changing
306
domains, including the economic one. It also allows a computer to simulate human inference, because
307
people infer about time and change. In particular, such notions as change, causality or actions are
308
described in the context of time, therefore the proper representation of time, and proper temporal
309
reasoning is of major importance in the field of e.g. artificial intelligence. Hence, data, knowledge,
310
and reasoning may be regarded by different levels of temporality.
311
Regarding time dimension, there can be the following types of data:
312
static data – does not contain any temporal context nor this context can be inferred from it;
313
sequences – ordered sequences of static data, with no direct time stamps (relative ordering, such
314
as “earlier”, “later”);
315
time stamped sequences – sequences of static data stamped with time, collected in regular or
316
irregular intervals;
317
fully temporal data – contains at least one time dimension, e.g. valid time, transaction time.
318
Knowledge temporality levels are similar, and may be characterized as follows:
319
static knowledge – does not contain any temporal context nor this context can be inferred from
320
it. An example of such knowledge is the sentence: “Any organization has to conform to legal
321
rules”;
322
sequences – ordered sequences of events, with no direct time stamps. These may be e.g. events
323
ordered by Allen’s temporal relations [83]. Example of a sequential knowledge may concern the
324
legal domain, namely the sequential knowledge about a legal act processing: Passing a law ->
325
signing the law by the President -> publishing the law;
326
time stamped knowledge – static knowledge extended with time stamps (an example of which
327
is a description of license issuing process: Application for license -> decision -> valid period of
328
license);
329
fully temporal knowledge – possessing at least one time dimension, e.g. knowledge on varying
330
prices of shares.
331
Depending on the type of data and knowledge, different reasoning rules may be applied:
332
temporally extended static rules – e.g. temporal descriptive rules;
334
rules proper to fully temporal knowledge – e.g. causal detection rules, temporal data mining
335
rules, etc.
336
The above definitions of various atemporal and temporal types of data, knowledge and
337
reasoning have been used to compose the subsequent levels of the Temporal Big Data Maturity
338
Model. The main assumption regarding analytical maturity of organization in the context of temporal
339
big data states that the more mature organization is, the more temporal solutions it uses for analytics.
340
3.2.Proposal of the Temporal Big Data Maturity Model (TBDMM)
341
The proposed framework called Temporal Big Data Maturity Model (TBDMM) is a means for
342
assessing organization’s readiness to fully profit from big data analysis. It allows to measure the
343
current state of organization’s big data assets and analytical tools, and to plan their future
344
development. Moreover, the model explicitly incorporates the time dimension, providing a complete
345
means for assessing also the readiness to process temporal data and/or knowledge that can be found
346
in modern sources, such as big data ones.
347
The model is composed of five maturity levels coordinated with the temporality levels discussed
348
in the previous section. The maturity levels are called: Atemporal, Pre-Temporal, Partly Temporal,
349
Predominantly Temporal, and Temporal. At each level, maturity is assessed against three key aspects:
350
data/knowledge being processed, implemented IT solutions, and functionalities provided by these
351
solutions. Such three-tier perspective allows the examination of the most important factors
352
influencing the big data readability of an organization. The maturity levels are numbered beginning
353
with 0, because here an organization makes no use of big data nor of temporal data/knowledge. The
354
detailed description of the maturity levels is as follows.
355
Level 0 (Atemporal) – at this level, organization makes use only of atemporal data/knowledge,
356
such as multidimensional data, and static knowledge (as defined in the previous section). Obviously,
357
in the multidimensional data model (OLAP data) there is a time dimension, but temporal reasoning
358
against this data is not possible. Also, at this level, organization makes no use of big data or its
359
elements. The IT solutions implemented at this level encompass e.g. data warehouse, BI system, and
360
knowledge base system, which provide the following functionalities: performance monitoring, trend
361
analysis, reporting, comparative analysis, benchmarking, and finally decision support with the use
362
of static rules. Data warehouses, and BI systems may not be considered temporal, because up till now
363
the questions e.g. of processes representation, persistence representation, temporal operators in
364
queries, and temporal relations analysis have not been successfully solved. The same applies to trend
365
analysis. Although time series are time-stamped, they do not allow for temporal reasoning. They only
366
record data in predefined time intervals. On the Level 0 organization is able to perform daily
367
reporting from structured data, historical analytics on structured data, and it is possible to use some
368
intelligent decision support for daily operations. However these are only day-to-day insights, with
369
no possibility to mine client data, to perform sentiment analysis or to predict possible decisions of an
370
organization’s market competitors. Such basic business analytics on structured data has a very little
371
potential to support a sustainable competitive advantage. On this level any activities aimed at gaining
372
such an advantage are not supported properly, and decisions rely mainly on managers’ own beliefs.
373
Level 1 (Pre-Temporal) – as for data/knowledge, an organization at this level uses the same
374
structures as at the previous one, but has begun to use some unstructured data sources (e.g. texts).
375
The knowledge is now static or sequential. To process the data/knowledge sources, organizations
376
implement – apart from the solutions used on level 0 – also e.g. intelligent dashboards, and sequential
377
knowledge base systems. Thanks to these, the following functionalities are available: predictive
378
analytics, advanced statistics, data mining on structured data, and text mining. It is also possible to
379
order knowledge chunks in a qualitative manner, using relations such as “earlier” or “later”. With
380
data/knowledge, IT solutions, and IT functionalities implemented on Level 1, organization may gain
381
some deeper insights into its customers, by analyzing e.g. customer relationships management
382
(CRM) data. This gives for example clients’ profiles, but they are based only on structured data. An
383
also possible to predict possible changes in the market environment, and possible consumers’ and
385
competitors’ behavior. Decision support can be based on information, how knowledge base is
386
changing in time. However, this support only reveals the directions of changes, and possible causes
387
and effects of them. Such a level of analytics may give an organization a temporal competitive
388
advantage, but in the long run it is not sufficient to maintain a sustainable advantage over
389
competitors.
390
Level 2 (Partly Temporal) – data/knowledge at this maturity level consists of sequences,
391
including time-stamped sequences, time-stamped knowledge. These may partially come from big
392
data sources. To analyze this data/knowledge, organization implements business optimization
393
software, time-stamped knowledge systems, and data mining systems. Thus, the following
394
functionalities are possible: embedded analytics, optimization, and scheduling, pattern analysis,
395
advanced data mining functions, temporal descriptive reasoning rules enabling description of
396
knowledge in the system and knowledge sources evolution. On this level, through time series
397
analytics and business optimization software it is possible to optimize business processes and market
398
operations. Also possible is temporal analysis of knowledge on business environment, giving
399
organization the first possibility to predict possible changes in market conditions. Client data can be
400
analyzed in advanced manner (e.g. market basket analysis, natural groups based on demographical
401
features and former buying decisions), however these analyzes do not contain the time component
402
and are predominantly static. On the other hand, on this partly temporal level of maturity,
403
organizations may implement first elements of temporal reasoning for decision support, thus gaining
404
insights into changes in clients’ and competitors’ behavior. Also on this level basic big data analytics
405
is implemented, hence unstructured or semi-structured information on market trends is added to the
406
analytical landscape. With this kind of business analytics organizations are able to gain stronger and
407
more durable competitive advantage than on the previous level but having no possibility to detect
408
real-time changes in big data it is hard to obtain sustainability in advantage or business models.
409
Level 3 (Predominantly Temporal) – an organization begins to use new big data sources, as e.g.
410
sensor data, and click stream data. It also collects and uses unstructured knowledge, e.g. legal
411
regulations. To process such data and knowledge, organizations use Hadoop (and probably other big
412
data tools, such as Spark), partly temporal knowledge base systems – that is KB systems where only
413
the structured knowledge is temporal, while unstructured one is not. They also use text mining and
414
web mining tools. Hence, organization may perform customer behavior analysis, get personalized
415
recommendations, discover market trends, perform what-if strategic analysis, process temporal
416
queries, and perform temporal reasoning (against structured part of knowledge). In the context of
417
sustainable competitive advantage or sustainable business models, the predominantly temporal level
418
provides organizations with more knowledge on market conditions and on competitive environment.
419
Organizations start to get insights from real-time data flow, e.g. clickstreams are analyzed. Also
420
unstructured knowledge from opinion portals is used, however with no possibility of tracking its
421
evolution. Additionally the knowledge base implemented in an organization is temporal. Temporal
422
knowledge representation has many advantages with respect to environment analysis. Some of these
423
advantages are as follows: representation of changes, their scope and the resulting interactions
424
among e.g. market features; representation of both discrete, and continuous changes; representation
425
of changes as processes with causal relationships explicitly defined. Temporal knowledge base
426
systems collect experiences concerning the domain being depicted, thus trace a domain’s evolution
427
and are able to draw new conclusions. Temporal reasoning on temporal knowledge may be
428
qualitative, hence it may concern complex relationships, descriptive information or information only
429
partially specified. Together with the possibility to model persistence of notions, it is possible to
430
encode in the temporal system the so-called erudite knowledge of experts. Such rich representation
431
and reasoning possibilities give organizations valuable dynamic insights on market and competitive
432
environment situation. An organization may react to new challenges more quickly and accurately.
433
On this level of maturity big data analytics is also implemented, providing broader predictive
434
component – e.g. when to bring new product or service to the market. The competitive advantage of
436
organization is therefore becoming sustainable.
437
Level 4 (Temporal) – an organization is mature in terms of big data and temporal knowledge
438
usage. Thus it uses big data, e.g. social data, and also structured and unstructured temporal
439
knowledge. It implements the following IT solutions: big data analytical tools, temporal knowledge
440
bases, other artificial intelligence systems (e.g. multi-agent systems collecting social data), and other.
441
The following functionalities are available: text and opinion mining, sentiment analysis, resource
442
optimization, discovery of customer usage patterns, holistic analysis of clients, qualitative and
443
quantitative temporal reasoning, possibility analysis, belief representation and analysis. On the
444
temporal level organization fully incorporates big data in business analytics, with special attention
445
paid to social media data, and real-time information on customers’ opinions. This can be easily added
446
to the temporal knowledge base system even though real time big data lack structuration. The reach
447
representation of data, information and knowledge from competitive environment enables advanced
448
temporal analytics, and temporal reasoning in every area of management. Through real-time insights
449
on competitive environment, through early detection of customers’ attitudes and expectations,
450
through temporal reasoning on market evolution and competitors’ intentions, organization is able to
451
gain the first mover advantage, which may be easily transformed into sustainable competitive
452
advantage based on sustainable business model. The synthesized illustration of the TBDMM model
453
is presented in Fig. 2.
454
The proposed framework extends previous maturity models for big data adoption by suggesting
455
the time factor to be the primary one in developing advanced business analytics focused on
456
sustainable competitive advantage. The TBDMM responds precisely to modern challenges faced by
457
organizations: the need to analyze unstructured real-time data flow, the need to respond to
458
consumers’ expectations expressed in social media discussions, the need to understand dynamic
459
changes in competitors’ activities, and finally the need to incorporate the new insights into decision
460
support.
461
4. Reception of the TBDMM
462
The results presented in this section are based on the survey conducted in 2016. The survey has
463
been aimed at recognizing how organizations perform big data analytics (BDA), and hence how the
464
proposed framework fits into their analytical needs. Precisely, the research questions are: what BDA
465
activities are undertaken in the researched organizations, and do the solutions concerning
466
data/knowledge, IT systems, and their functionalities, incorporated in the new framework, respond
467
to organizations’ analytical needs?
468
4.1.Research Methodology and Research Sample
469
The proposed temporal framework for big data has been presented to managers during personal
470
CAPI (Computer-Assisted Personal Interviewing) semi-structured interviews. In total, 25
471
organizations have been invited to participate in the research, and 15 of them agreed. Hence,
472
employees from 15 various organizations were interviewed; thus, the research used the case-study
473
approach involving multiple cases.
474
The interview questionnaire was developed in March 2016, and consisted of 15 questions, both
475
closed- and open-ended, followed by 7 questions concerning respondent’s particulars. These research
476
questions referred to:
477
significance of the time factor in analysis and managerial decisions;
478
maturity of the organization;
479
respondents’ understanding of the big data term;
480
types of business analytics particularly important for organization;
481
data/knowledge, IT solutions, IT functionalities appropriate for BDA;
482
respondents’ assessment of their employees’ level of training in context of BDA;
483
advantages and barriers of BDA implementation.
485
The sample has been selected by purposive sampling. Independent variables which were taken
486
into account during sample verification, include: organization’s business activity, number of
487
employees, average annual turnover for the last three years, capital structure, respondent’s position
488
in organization, organization’s sector, and for how long does organization exist on the market.
489
Among the organizations being researched, the largest group (7) are the service ones. Two
490
organizations are manufacturing ones, two indications for banking, three indications for research and
491
development (R&D), and one indication for software development.
492
These are mostly medium and big organizations, because 8 of them belong to one of these two
493
categories. The category of small companies may be assigned to 7 organizations being researched.
494
No micro-organizations have been selected for the study.
495
The majority of organizations are these with domestic capital (10 indications). The interviewed
496
respondents were mostly owners or management board members (8 persons), they were also ICT
497
managers/specialists (2 persons), or performed other functions in their organizations, as e.g.
498
technology department managers, advanced analytics managers, SEO specialists, model validation
499
specialists.
500
As for the sector in which the researched organizations operate, the ICT sector is the most
501
numerous (4 indications, with production of ICT, and ICT service/support treated collectively), the
502
second position is occupied by professional, scientific and technical sectors (3 indications), and the
503
third by financial sector (2 indications).
504
Obviously, these are not all respondents’ particulars, however, they illustrate sufficiently the
505
heterogeneity of the research sample.
506
Research focused on the analytical needs of organizations concerning data/knowledge, IT
507
solutions, and their functionalities. Due to the qualitative nature of research it has been difficult to
508
precisely define the model reception indicators. Hence, attention has been paid to the fact, whether
509
respondents recognize the need to use solutions incorporated in the new temporal maturity
510
512
Figure 2. Proposal of the Temporal Big Data Maturity Model – TBDMM.
513
4.2.Selected Survey Findings
514
4.2.1. Temporal Big Data Understanding by Managers
515
The first two important questions during the survey concerned big data understanding by
516
managers, and the basic assumption of the TBDMM, namely its explicit time dimension. First,
517
managers (14 persons) big data means the flow and processing of huge amounts of data which is
519
constantly changing, dispersed, and only loosely coupled. Five persons pointed out difficulties in the
520
processing of such data, in using standard analytical methods and in searching for dependencies
521
among the data. These people understand big data as vast datasets on which classical processing and
522
storing methods are ineffective. Also 5 persons link the big data term with such notions, as dynamics,
523
and variability. Similarly, 5 persons indicated big data with its sources of origin: the internet, social
524
media, cookies, web usage mining, Internet of Things (IoT), Google. Two managers pointed out that
525
big data’s lack of structure and its irregular flows. Other remarks concerning the big data term were
526
as follows:
527
“people from organizations having no advanced information technology solutions do not know
528
what they mean while using the big data notion”;
529
“big data does not exist, we focus on analysis of dataset’s portion;
530
“big data means creating and validating of models based on machine learning tools, and using
531
these models on complete datasets”;
532
“linked heterogeneous datasets, owned by various organizations”;
533
Hadoop, Spark, Cassandra, HBase, NoSQL.
534
To verify the time assumption of the TBDMM, respondents have been asked to determine, how
535
important is the time factor in managerial analysis and decision-making. For 11 of them, time is
536
important, and for 4 – very important. Hence all the interviewed managers recognize temporality of
537
business analytics and decisions. This means that assuming the time factor to be the key indicator of
538
subsequent maturity levels in the presented framework has been fully justified and correct.
539
4.2.2. The Data/Knowledge Aspect in the TBDMM
540
The next area of the survey concerned data/knowledge used by organizations, and these which
541
should be used for advanced business analytics. The majority of researched organizations (10
542
indications) does not use big data for gaining valuable insights. Five managers indicated the use of
543
customer data, three of them – competitors data, two managers pointed out social media data, one
544
person indicated suppliers data, and also one person – other stakeholders data. As for the quality of
545
data used in organizations for advanced analytics, 3 managers assessed it as high quality data, 9
546
persons – as average quality data, 2 persons – as rather poor quality data, and one person declared
547
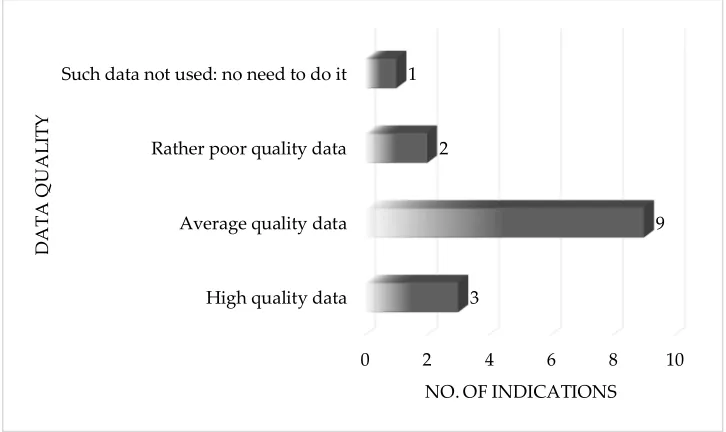
that big data is not used for analytics, as there is no need to do it (Fig. 3).
548
549
Figure 3. Quality of data for BDA in researched organizations.
550
0 2 4 6 8 10
High quality data Average quality data Rather poor quality data Such data not used: no need to do it
3
9 2
1
NO. OF INDICATIONS
D
A
T
A
Q
U
A
L
IT
It should be noted here that while only one person assessing data quality declares no use of big
551
data, as many as 10 indications in the area of data being used concern big data (as not being used at
552
all). At first sight it may seem contradictory, however, most probably this contradiction is due to poor
553
understanding of the big data notion and features – as discussed in section 4.2.1.
554
In the area of the survey concerning data/knowledge which should be used for BDA, managers
555
have been presented a closed set of examples, and asked to express their opinion on each with respect
556
to solution’s usability. Respondents could have also added their own comments during the interview.
557
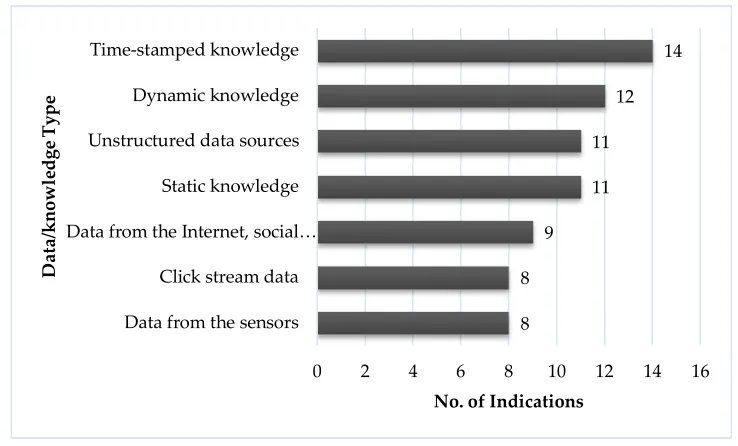
The summarized responses on this topic are given in Fig. 4.
558
559
Figure 4. The most essential data/knowledge in BDA.
560
Respondents explained that by static (unchanging) knowledge they understood e.g. managerial
561
knowledge, models, expert rules, etc. Almost all interviewed persons (14) recognized time-stamped
562
knowledge (as e.g. time series) as indispensable for BDA. However, they indicated that this factor is
563
strictly linked with the industry, and highly project-dependent. For the majority of managers (12)
564
dynamic (changing) knowledge is essential for BDA. Attention should be also paid to the high
565
position of unstructured data, including social networks data. Hence, managers recognize the need
566
and sense to make use of temporal data, including big data. The latter notion has not been present in
567
managers comments explicitly, however, as respondents see the analytical potential of the web, social
568
networks, sensors, click streams, etc. indicates their interest in big data. Additionally, respondents
569
have been asked to give their opinion on whether advanced BI and big data analytics should be
570
unlimited, or conducted only in isolated fragments (departments) of organization? For the majority
571
of researched managers (10 indications) such analytics should be limited to isolated fragments of
572
organization, and according to 5 managers it should be unlimited.
573
4.2.3. The IT Solutions Aspect in the TBDMM
574
The next part of the interviews has been devoted to advanced analytic solutions in organizations,
575
their IT infrastructure, and to the BDA solutions that according to the respondents should be
576
performed. Managers have been asked about types of business analytics solutions particularly
577
important for their organization. The most often indicated have been dynamic analysis systems (12
578
indications) and reporting systems (11 indications). Also real-time analytics systems has been often
579
chosen – 9 indications. On the other end of the solutions spectrum, respondents pointed out scoring
580
systems (1 indication), risk analysis and decision support systems (3 indications), and static analysis
581
systems (understood as simple analytical systems with no time nor dynamic aspects – 4 indications).
582
The detailed information on respondents’ utterances is given in Fig. 5.
583
8 8
9 11 11
12 14
0 2 4 6 8 10 12 14 16
Data from the sensors Click stream data Data from the Internet, social…
Static knowledge Unstructured data sources Dynamic knowledge Time-stamped knowledge
No. of Indications
D
at
a/
k
n
o
w
le
d
g
e
T
y
p
584
Figure 5. Business analytics solutions particularly important for surveyed organizations.
585
Managers also assessed the suitability of the current IT infrastructure for executing advanced
586
business analytics in their organizations. No one of them has assessed it as “very good” or “very
587
bad”. Seven managers assessed the IT infrastructure suitability as “good”, 4 of them as “neither good
588
nor bad”, also 4 of them – as “bad”.
589
Subsequently, the respondents have been asked about IT solutions their organization should use
590
while preparing BDA. Again, they were presented a closed set of examples, and asked to express
591
their opinion on each with respect to solution’s usability for advanced business analytics, including
592
the big data one. As previously, respondents could have added their own comments during the
593
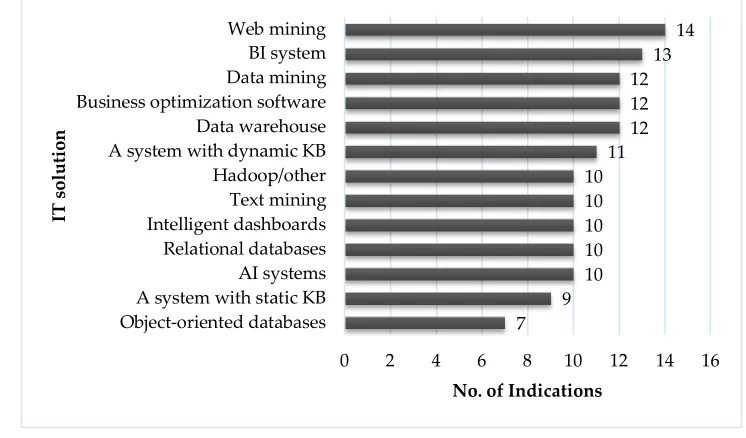
interview. The summarized results are presented in Fig. 6.
594
595
Figure 6. The most suitable IT solutions for BDA in surveyed organizations.
596
Almost all of the respondents (13) recognized BI systems as an indispensable tool for BDA.
597
Similarly, almost all of them (14) admitted that using Web mining tools for BDA is very important
598
for organizations. Hadoop and other big data tools (as e.g. Spark) support organizations in
599
performing BDA – as recognized by 10 managers.
600
1 3
4
7 9 9 9 9
11 12
0 2 4 6 8 10 12 14
Scoring system Risk analysis and decision support…
Static analysis system Ad hoc analysis system Multi-criteria analysis system Predictive analytics system Forecasting system Real-time analytics system Reporting system Dynamic analysis system
No. of indications
T
y
p
e
o
f
so
lu
ti
o
n
7 9
10 10 10 10 10
11 12 12 12
13 14
0 2 4 6 8 10 12 14 16
Object-oriented databases A system with static KB AI systems Relational databases Intelligent dashboards Text mining Hadoop/other A system with dynamic KB Data warehouse Business optimization software Data mining BI system Web mining
No. of Indications
IT
s
o
lu
ti
o