423
Volume 64 48 Number 2, 2016
http://dx.doi.org/10.11118/actaun201664020423
RELIABILITY ANALYSIS OF TEMPERATURE
INFLUENCE ON STRESSES IN RIGID PAVEMENT
MADE FROM RECYCLED MATERIALS
Aleš Florian
1, Lenka Ševelová
2, Jaroslav Žák
31 Lieberzeitova 23a, 614 00 Brno, Czech Republic
2 Department of Landscape Management, Faculty of Forestry and Wood Technology, Mendel University in Brno, Zemědělská 1, 613 00 Brno, Czech Republic
3 Department of Civil Engineering, The Institute of Technology and Businesses in České Budějovice, Okružní 10, 370 01 České Budějovice, Czech Republic
Abstract
FLORIAN ALEŠ, ŠEVELOVÁ LENKA, ŽÁK JAROSLAV. 2016. Reliability Analysis of Temperature Infl uence on Stresses in Rigid Pavement Made from Recycled Materials. Acta Universitatis Agriculturae et Silviculturae Mendelianae Brunensis, 64(2): 423–432.
Complex statistical and sensitivity analysis of principal stresses in concrete slabs of the real type of rigid pavement made from recycled materials is performed. The pavement is dominantly loaded by the temperature fi eld acting on the upper and lower surface of concrete slabs. The computational model of the pavement is designed as a spatial (3D) model, is based on a nonlinear variant of the fi nite element method that respects the structural nonlinearity, enables to model diff erent arrangement of joints, and the entire model can be loaded by thermal load. Four concrete slabs separated by transverse and longitudinal joints and the additional structural layers including soil to the depth of about 3 m are modeled. The thickness of individual layers, physical and mechanical properties of materials, characteristics of joints, and the temperature of the upper and lower surface of slabs are supposed to be random variables. The simulation technique Updated Latin Hypercube Sampling with 20 simulations is used for the reliability analysis. As results of statistical analysis, the estimates of basic statistics of the principal stresses σ1 and σ3 in 106 points on the upper and lower surface of slabs are obtained. For sensitivity analysis the sensitivity coeffi cient based on the Spearman rank correlation coeffi cient is used. As results of sensitivity analysis, the estimates of infl uence of random variability of individual input variables on the random variability of principal stresses σ1 and σ3 are obtained.
Keywords: concrete, FEM, pavement, simulation, sensitivity, statistics, temperature
INTRODUCTION
Complex analysis of rigid pavements is o en very difficult for design practice. Rheological properties of materials, cracking, joints, contact of concrete slabs in joints, contact of slab and subsequent material layer, temperature changes, non-homogenity of pavement base, water regime in the subgrade, environmental changes etc. infl uence serviceability of the structure in a decisive way. Moreover, the problem is complicated by the fact that the input data are generally random variables. Further uncertainties stem from their vagueness.
Taking into account the specifi c properties of the particular type of structure, the combination of the
proper analytical model and modern simulation techniques seems to be an eff ective tool for the solution of the problem see Wojtkiewicz et al. (2010), Lee et al. (2010), Florian et al. (2011), Leonovich et al. (2013). The reliability analysis of a pavement using these methods provides the designer with reliability limits of the structural response and enables the determination of possible critical development. The results of the analysis also enable fi nding out which input variables require special attention due to their random variability dominantly infl uencing the structural behavior.
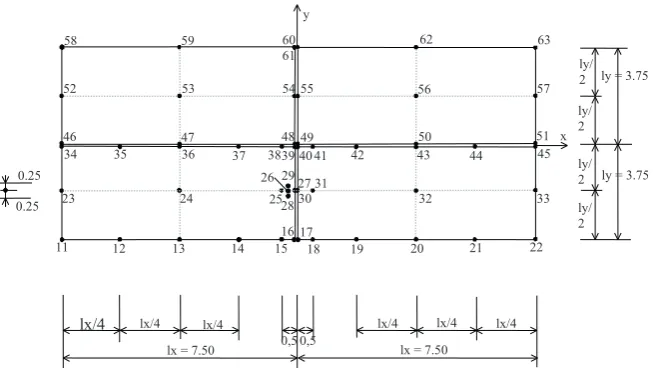
thermal loading due to the temperature diff erence between the upper and the lower surface of the slab, and by the external load of 50 kN intensity at a distance of 0.25 m from the edge of the slab – see point 26 in Fig. 1. Thus the total state of stress in the slab results from all three diff erent sources of load acting together. Contrary to the original former design, the base layer in this study is supposed to be made from a recycled material instead of a natural one. It is made from recycled concrete of fractions 0–16 mm.
The infl uence of uncertainties in input variables on the behavior of the pavement is respected in the analysis with help of numerical simulation techniques McKay et al. (1979). The simulation technique Updated Latin Hypercube Sampling with 20 simulations is used Florian (1992), Florian (2005). Total of 17 basic random input variables describing layer thicknesses, mechanical properties of materials, characteristics of joints and temperature on both surfaces of concrete slabs are taken into account in the study. They are described by the assumed cumulative distribution functions (generally three-parametric) and by the appropriate statistical parameters.
The statistical and sensitivity analysis of principal stresses σ1 and σ3 in concrete slabs is performed to show possibilities of reliability methods in the analysis of real pavement structures. The stresses are evaluated in 53 points on the upper and lower surface (106 points in total) of concrete slabs, see Fig. 1. Sign convention is chosen so that positive stresses are tensile, while the negative stresses are compressive. Principal stress σ1 represents an extreme value of tensile stress in the given point of the structure, while σ3 is an extreme value of compressive stress, that arise due to the spatial state of stress. Although the calculation and measurement
normal stress at a given point of the structure and thus it is the crucial characteristic which would be used in dimensioning process. If the principal stress exceeds the tensile strength of the material, a local tensile crack is created. If it exceeds the compressive strength of the material (only hypothetically for pavements), the material is locally crushed.
The result examples of statistical as well as sensitivity analysis of principal stresses are provided. These results are compared with the results obtained from deterministic analysis. The aim is to demonstrate the practical applicability of reliability methods in analyzing pavement behavior, their possibilities to supplement or even replace experimental methods, the nature of the information obtained, and fi nally, the possibility to quantify the reliability of pavements.
MATERIALS AND METHODS
Analytical Model
The computational model is based on the nonlinear fi nite element method. It is developed in
ANSYS system. Four concrete slabs, all other layers and longitudinal and transverse joints are modeled as 3D space – see Fig. 2. Joints, contact of slabs in joints, contact of slabs and subsequent layer, and the thermal loading are modeled in detail. Its main features are:
• parametric model, open and fl exible,
• nonlinear model that respects the structural nonlinearity,
• designed as a spatial (3D) model that models the four adjacent concrete slabs with subsequent material layers and the surrounding soil,
• allows to model diff erent arrangement of joints,
O[ O[
O[ O[ O[
O[ O[ O[
O\ O\ O\ O\ O\ O\ [ \
• interaction of adjacent slabs is realized with help of special contact elements which prevent the transmission of tensile stress,
• contact between a slab and a subsequent layer is also realized using the contact elements, which allow realistic modeling of li ing of corners and the centre of the slab,
• each material layer can be of any thickness and of any material,
• pavement can be loaded by thermal loading, • external load can be applied at any point of the
slab,
• displacements, rotations, strains, normal or shear stresses etc. can be evaluated at any point in any layer of the pavement structure.
The geometry of the structure is modeled by fi nite elements BRICK45, see Fig. 3. It is the eight-mode element with three degrees of freedom (UX, UY, UZ) in each node.
Attention is paid to modeling of concrete slab contact with subsequent material layer and interaction of adjacent slabs in joints. In these areas the so-called contact problem occurs, in which tensile stresses cannot be transmitted. This is the case of structural nonlinearity and the pavement modeling therefore becomes nonlinear. Thus the numerical solution is divided into individual iteration steps and the Newton-Raphson method is used in each step. The actual contacts are modeled
with a help of special contact elements. The contact element connects appropriate nodes of fi nite element mesh and operates in compression as the imaginary spring with given stiff ness. But if it is pulled, the nodes behave independently and tensile stresses are not transmitted.
The proposed model of joints tries to simulate at least some of the complex phenomena that occur there. The adjacent slabs interact due to their mutual contact, due to the material in joints, and also due to stress transmitted through the other layers of the structure.
Reliability Analysis Techniques
The simulation technique Updated Latin Hypercube Sampling Florian (1992), Florian (2005) with 20 simulations is used for the reliability analysis. It is an improved variant of Latin Hypercube Sampling McKay et al. (1979). The method keeps the methodology of Latin Hypercube Sampling, but uses an improved strategy of generating input samples based on specially modifi ed tables of random permutations of rank numbers. The modifi ed tables consist of random permutations that are mutually statistically independent. The use of Updated Latin Hypercube Sampling generally results in a further increase in accuracy, quality and reliability of the results obtained from the reliability analysis. The detailed description of Updated Latin 2: Details of FE model
variability of the output (principal stresses in 106 points in concrete slabs), the sensitivity coeffi cient based on the Spearman rank correlation coeffi cient is proposed Florian and Navrátil (1993). It is not limited to the linear relationship like the Pearson correlation coeffi cient. The sensitivity coeffi cient is defi ned as
2 6 1
( 1)( 1)
i i s
d r
N N N
, (1)
where rs is the sensitivity coeffi cient among the k-th
input variable and the output, di is the diff erence
between the rank numbers of the k-th input variable and the rank numbers of the output, and N is the number of simulation.
The sensitivity coeffi cient ranges within interval −1 to +1. The higher is the coeffi cient (in absolute value), the higher is the sensitivity of the output on the appropriate input variable. The sign of the coeffi cient indicates positive or negative infl uence. The sensitivity coeffi cient lower than 0.30 (in absolute value) can be explained as practically no infl uence, higher than 0.30 as a low infl uence, higher than 0.50 as a moderate infl uence, higher than 0.70 as a high infl uence, and the sensitivity coeffi cient higher than 0.90 as a dominant infl uence.
Input Random Variables
Total of 17 variables are considered to be random input variables, see Tab. I (units in MPa, mm, ºC).
and the corresponding standards.
The infl uence of the current level of construction process and technological discipline is also taken into account. To derive appropriate statistical parameters of input variables (with the exception of Young modulus of recycled concrete used in base layer of the pavement), the following procedure is utilized. At fi rst, the limits are specifi ed (minimum, maximum and mean value) in which input variables will occur with a high probability, see Tab. I. Then, based on the assumption that values smaller than the minimum value and higher than the maximum value can occur only with a low probability, and choosing the appropriate probability distribution function (N – normal, LN – three-parametric lognormal, TN – truncated normal), the other required statistical parameters are determined – coeffi cient of variation (COV) and skewness. The normal and truncated normal CDF are used for symmetrically distributed variables, the three-parametric lognormal CDF for the other case. Statistical parameters of Young modulus of recycled concrete are based on the statistical evaluation of data obtained from laboratory tests Florian
et al. (2015). For simplicity, the mutual statistical independence of input variables is considered with the following exception – the temperatures of the upper and the lower surface of the slabs are supposed to be fully statistically dependent.
The derived statistical parameters of input variables used in the presented study take into account uncertainties due to their random
I: Statistical parameters of input variables
No. Layer Input Variable Mean Min Max PDF COV Skewness
X1
Concrete Slab
Thickness 220 180 250 LN 0.09 −0.6
X2 Young modulus 37500 30000 45000 N 0.12 0.0
X3 Poisson’s coeffi cient 0.20 0.19 0.21 N 0.02 0.0
X4
Base
Thickness 200 150 250 N 0.15 0.0
X5 Young modulus 150 - - N 0.40 0.0
X6 Poisson’s coeffi cient 0.30 0.25 0.35 N 0.08 0.0
X7
Sub-base
Thickness 250 150 650 LN 0.24 1.0
X8 Young modulus 120 80 200 LN 0.18 0.9
X9 Poisson’s coeffi cient 0.30 0.25 0.35 N 0.07 0.0
X10
Subgrade Young modulus 80 30 150 LN 0.32 0.5
X11 Poisson’s coeffi cient 0.35 0.30 0.45 LN 0.075 0.9
X12
Joints
Width transversal 20 15 25 N 0.15 0.0
X13 Width longitudinal 1.5 0 3 TN 0.75 2*
X14 Young modulus 150 50 1000 LN 0.39 1.0
X15 Coeffi cient of friction 0.5 0.1 0.9 N 0.34 0.0
X16
Temperature Upper surface 11 −10 40 LN 0.95 0.5
X17 Lower surface 10 5 20 LN 0.25 0.9
nature and also the uncertainties due to our incomplete knowledge of the structure, insuffi cient experimental research, modeling errors, vagueness of input data etc.
RESULTS OF STATISTICAL ANALYSIS
The statistical analysis provides us with the following statistics of principal stresses in individual points on concrete slabs:
• mean (MPa),
• standard deviation (MPa),
• coeffi cient of variation (dimensionless), • skewness (dimensionless),
• minimum and maximum value (MPa),
• suitable type of probability distribution function (PDF).
The mean value describes the average tendency of stresses, the standard deviation and the coeffi cient of variation describe their variability, skewness indicates the asymmetry of their population under and above the mean value, and fi nally the minimum and maximum values describe the possible interval within the stresses can occur. In addition, the deterministic analysis (DA) with input variables set to their nominal (mean) values is performed.
The suitable type of probability distribution is chosen with help of the comparative tests from
a set of competing distributions Florian and Novák (1988). In our study this set includes normal (N), three-parametric lognormal (LN), truncated normal (TN), parametric Weibull (W) and three-parametric Pearson III (P3) probability distribution. Based on the chosen distribution, the 1, 5, 95 and 99% quantiles are determined, which are usually the most important ones in civil engineering practice. Quantiles allow making probabilistic conclusions. E.g. for 1% quantile, the 1% probability exists that the value is less than the quantile, while the 99% probability exists that the value is larger than the quantile.
Principal Stress σ1
Illustrative results of statistical analysis of principal stress σ1 (maximal tensile stress) in some important points on the lower surface of concrete slabs are shown in Tab. II. In Tab. III and Tab. IV, the 1, 5, 95 and 99% quantiles in some important points on the upper and lower surface are presented.
Nominal values of stress obtained from deterministic analysis (DA) on the lower surface have the character of tensile stress in all points, while on the upper surface there are both tensile and compressive stresses as well. Nominal values are within the interval 0.3 to 1.6 MPa on the lower surface and within the interval −0.05 to 1.1 MPa
II: Statics of principal stress σ1 in points on lower surface (MPa)
Point Mean DA Standard Deviation Skewness Minimal Value Maximal Value PDF
11 0.7370 0.5813 0.3382 1.00 0.3421 1.5845 W
13 0.5061 0.3325 0.5541 0.48 0.0000 1.4701 TN
16 0.6369 0.5030 0.3148 0.70 0.2463 1.3530 W
17 0.6724 0.5115 0.3216 0.66 0.2704 1.3913 W
20 0.5092 0.3397 0.5567 0.47 −0.0002 1.4795 TN
23 0.9142 0.3274 0.7751 1.49 0.2189 2.9583 W
24 0.7045 0.3630 0.8385 0.76 −0.0247 2.3967 W
25 1.5225 1.2201 1.1264 0.96 0.2825 3.9933 W
27 1.9464 1.5362 1.0752 1.21 0.8909 4.5842 W
29 1.5940 1.1856 1.0623 1.25 0.4106 4.2867 W
30 1.0685 0.5631 0.8921 1.22 0.2395 3.2154 W
32 0.6980 0.3818 0.8218 0.70 −0.0267 2.3163 W
33 0.9134 0.3274 0.7735 1.49 0.2191 2.9505 W
34 1.2611 0.5362 0.9877 2.12 0.3847 4.6728 P3
36 0.8097 0.3389 0.9592 1.24 −0.0023 3.2137 W
39 1.2062 0.5400 1.0671 2.31 0.3844 4.9698 P3
40 1.2682 0.5678 1.1120 2.41 0.4303 5.2694 P3
43 0.8098 0.3478 0.9598 1.22 −0.0703 3.1888 W
45 1.2592 0.5362 0.9867 2.12 0.3844 4.6630 P3
48 1.1950 0.4924 1.0666 2.30 0.3529 4.9539 P3
49 1.2164 0.4862 1.1135 2.37 0.3546 5.1952 P3
51 1.2578 0.5433 0.9794 2.12 0.3897 4.6386 P3
58 0.4931 0.5258 0.5774 0.00 −0.7656 1.6383 N
on the upper surface. In both cases, the nominal values are close to the minimum values obtained from statistical analysis. Mean values of stress on both surfaces in all points have the character of tensile stress and are generally always greater than the nominal values. They are within the interval 0.4 to 2.0 MPa on the lower surface and within the interval 0.2 to 1.4 MPa on the upper surface. The largest nominal as well as mean values reach their maximum at points near the external load application.
The interval in which principal stress σ1 may occur is considerable high – see the interval between the minimum and maximum values in Tab. II. Larger tensile stresses and thus higher probability of tensile cracks occurring arise on the lower surface of concrete slabs. In the case of the lower surface, the maximum values are up to 5.3 MPa, in the case of upper surface they are up to 3.3 MPa. The largest tensile stresses on the lower surface arise in points near the external load application (points 25–29), in points on all slabs near the longitudinal joint (points 33–51) and especially in the corners of slabs (points 34, 39, 40, 45, 46, 48, 49, 51). The largest tensile stresses on the upper surface arise in points near the external load application (points 26, 30) and in points on the transverse axis of symmetry of all slabs (points 13, 14, 20, 24, 36, 37, 43, 47, 50, 53, 56, 59, 62). The stresses in all points show considerable variability and also nonzero skewness. Skewness has (with some exception) a positive sign and in some points is quite large. As a result of signifi cant positive skewness, the o en used normal probability distribution (a priori assuming zero skewness) is not suitable to describe the random variability of principal stress σ1. Weibull probability distribution seems to be the most appropriate.
The stresses in some points on the upper but especially on the lower surface reach magnitude where the creation of tensile cracks is highly probable. Taken into account the tensile strength of
standard quality concrete, there is at least probability of 1% of tensile crack creation on the upper surface, see Tab. III, and at least probability of 5% of tensile crack creation on the lower surface, see Tab. IV.
Principal Stress σ3
Illustrative results of statistical analysis of principal stress σ3 (maximal compressive stress) in some important points on the upper surface of concrete slabs are shown in Tab. V. The nominal values of stress obtained from deterministic analysis (DA) on the upper surface have the character of compressive stress in all points, while on the lower surface there are also minimal tensile stresses in points near the external load application (points 28, 30). Nominal values are within the interval −0.1 to −2.2 MPa on the upper surface and within the interval 0.1 to −0.5 MPa on the lower surface. In both cases, the nominal values are close to the minimum values obtained from statistical analysis. Mean values of stresses on both surfaces have the same character as nominal values but they are generally greater. They are within the interval −0.7 to −2.8 MPa on the upper surface and within the interval 0.1 to −1.0 MPa on the lower surface.
The interval in which principal stresses σ3 may occur is considerably high – see the interval between the minimum and maximum values in Tab. V. Larger compressive stresses arise on the upper surface of concrete slabs. In this case, the maximum values are up to −7.3 MPa, in the case of lower surface they are up to −4.9 MPa. The largest compressive stresses on the upper surface arise in points on the transverse axis of symmetry of all slabs and in points close the contact of all slabs (points 13, 20, 24, 32, 38, 41, 47, 50, 53, 56, 59, 62). On the lower surface the largest compressive stresses arise in some corners of slabs (points 11, 22, 58, 60, 61, 63).
The stresses in all points show considerable variability and also nonzero skewness. Skewness in points on the upper surface has (with some 20 −0.6764 −0.4849 2.1508 2.9288
24 −0.7451 −0.5654 2.9138 4.1053 32 −0.7391 −0.5495 2.6938 3.7477 36 −0.7971 −0.6184 2.8331 4.0139 37 −0.6756 −0.5263 2.3422 3.3214 43 −0.7975 −0.6100 2.6885 3.7735 47 −0.8048 −0.6156 2.7387 3.8455 50 −0.7981 −0.6089 2.6800 3.7563 53 −0.7395 −0.5508 2.6987 3.7577 56 −0.7383 −0.5498 2.6916 3.7473 59 −0.6698 −0.4870 2.1672 2.9699 62 −0.6711 −0.4881 2.1730 2.9784
exception) the negative sign and in some points is quite large. Weibull probability distribution seems to be the most appropriate to describe random variability of principal stress σ3.
RESULTS OF SENSITIVITY ANALYSIS
Principal Stress σ1
Sensitivity analysis of principal stress σ1 (maximal tensile stress) is performed in all points on the upper and lower surface of concrete slabs. Stresses on the both surfaces are generally aff ected by random variability of the input variables diff erently. Illustrative results are presented for some important points on the lower surface only, see Tab. VI.
Some points on the lower surface are infl uenced only by the minimum number of input variables. The stress in points near the external load application, the centers of slabs and the longitudinal edge of slabs (points 12–14, 20, 24–29, 32, 37, 38, 53, 56, 58, 63) are infl uenced only by two or three variables. The largest number of input variables – eight – has an infl uence in the outer corners of the loaded slab as well as the adjacent slab (points 11, 16, 22).
Most points on the lower surface are infl uenced by the temperature fi eld acting on the upper (X16) and lower (X17) surface of the concrete slabs. Infl uence
of these variables can be considered as dominant. Infl uence of the modulus of elasticity of the joints material (X14), Poisson coeffi cient for sub-base layer (X9), and the width of transverse joints (X12) can be generally considered as moderate, in the case of the modulus of elasticity and the joint width in some points as high. Low infl uence show the modulus of elasticity of subgrade layer (X10), the thickness, the modulus of elasticity and Poisson coeffi cient of concrete slabs (X1, X2, X3), the thickness of base layer (X4), and the coeffi cient of friction in joints (X15).
Principal Stress σ3
Sensitivity analysis of principal stress σ3 (maximal compressive stress) is performed in all points on the upper and lower surface of concrete slabs. Stresses on the both surfaces are generally aff ected diff erently by random variability of the input variables. Illustrative results are presented for some important points on the lower surface only, see Tab. VII.
In the points on the upper surface the infl uence of temperature fi eld acting on the upper (X16) and lower (X17) surface of the concrete slabs are dominant. Infl uence of other variables can be considered as minimal or negligible.
V: Statics of principal stress σ3 in points on upper surface (MPa)
Point Mean DA Standard Deviation Skewness Minimal Value Maximal Value PDF
13 −1.1498 −0.1085 1.8849 −1.90 −7.0537 0.0006 W
14 −1.0367 −0.1303 1.7250 −1.94 −6.4393 −0.0004 W
15 −0.8540 −0.0709 1.6205 −2.19 −6.2834 0.0361 N
18 −0.8531 −0.0948 1.6029 −2.18 −6.2052 0.0377 P3
19 −1.0084 −0.1006 1.6986 −1.95 −6.3279 0.0008 W
20 −1.1538 −0.1115 1.8875 −1.90 −7.0586 0.0009 W
24 −1.2252 −0.3183 1.8835 −1.72 −6.7689 −0.0010 W
25 −1.3254 −1.0120 1.5899 −1.49 −6.1474 0.3362 W
26 −2.7713 −2.2155 0.9942 −2.14 −6.0725 −2.1881 P3
27 −1.5332 −1.2314 1.0052 −1.07 −3.9730 −0.5648 W
28 −1.3070 −1.0131 1.2482 −1.46 −5.0746 −0.0603 W
29 −1.2657 −1.0134 1.3311 −1.26 −5.0886 0.1848 W
32 −1.2302 −0.3129 1.8858 −1.71 −6.7494 −0.0010 W
36 −1.1521 −0.1188 1.8827 −1.70 −6.5366 0.1294 W
37 −1.0582 −0.1822 1.7849 −1.88 −6.5716 0.1092 W
38 −0.9452 −0.1694 1.8066 −2.33 −7.2465 0.1411 P3
39 −0.8460 −0.1127 1.5618 −2.51 −6.4681 −0.0002 N
40 −0.8791 −0.1501 1.5636 −2.46 −6.4586 −0.0372 N
41 −0.9365 −0.1826 1.7701 −2.31 −7.0709 0.1203 P3
42 −1.0284 −0.1471 1.7414 −1.86 −6.3358 0.1091 W
43 −1.1512 −0.1240 1.8731 −1.68 −6.4679 0.1265 W
47 −1.1749 −0.1196 1.9291 −1.71 −6.7266 0.1285 W
48 −0.8307 −0.0707 1.5352 −2.49 −6.3252 −0.0362 N
On the lower surface the infl uence of temperature fi eld (X16, X17) is still dominant, but the infl uence of other variables is no longer negligible. The infl uence of the width of transverse joint (X12), as well as the mechanical properties of concrete slabs (X2, X3), the thickness of base layer (X4), and the modulus of elasticity of sub-base layer (X8) may be mentioned.
DISCUSSION
Using combination of the accurate computational models (e.g. based on non-linear FEM) and the eff ective simulation techniques it is possible to analyze the behavior of structures with respect to the uncertainties in input variables. Reliability
analysis allows to obtain more realistic view of the behavior of structures, allows designing structure for a predetermined reliability level, enables setting of limits (extremes) in which the structure will behave, and fi nally allows to supplement or even replace the experimental research.
The presented reliability analysis of principal stresses in concrete slabs of rigid pavement shows that the stresses are of positive as well as negative sign, i.e. tensile and compressive stresses occur despite the fact that dynamic loading is not considered. This is caused by the thermal loading due to the temperature diff erence between the upper and the lower surface of concrete slabs.
The principal stresses are infl uenced by random variability of input variables in a diff erent way.
16 0.10 0.24 0.00 0.35 0.08 0.16 0.15 0.17 0.24 0.21 0.00 0.51 0.00 0.44 0.03 0.42 0.42
17 0.16 0.21 0.01 0.28 0.08 0.18 0.18 0.20 0.20 0.18 0.03 0.57 0.03 0.44 0.10 0.39 0.39
22 0.10 0.20 0.00 0.43 0.02 0.09 0.20 0.26 0.24 0.22 0.13 0.41 0.06 0.41 0.00 0.46 0.46
23 0.14 0.06 0.04 0.17 0.02 0.03 0.12 0.10 0.34 0.24 0.02 0.29 0.05 0.23 0.05 0.69 0.69
24 0.09 0.14 0.01 0.06 0.08 0.01 0.04 0.04 0.02 0.02 0.01 0.04 0.06 0.04 0.02 0.99 0.99
26 0.31 0.06 0.08 0.09 0.11 0.11 0.04 0.02 0.07 0.00 0.05 0.11 0.00 0.03 0.00 0.93 0.93
28 0.22 0.03 0.08 0.13 0.04 0.13 0.02 0.05 0.06 0.09 0.06 0.13 0.03 0.07 0.01 0.93 0.93
32 0.11 0.14 0.02 0.06 0.11 0.01 0.04 0.06 0.03 0.01 0.04 0.03 0.06 0.04 0.03 0.99 0.99
33 0.14 0.06 0.04 0.17 0.02 0.03 0.12 0.10 0.34 0.24 0.02 0.29 0.05 0.23 0.05 0.69 0.69
34 0.13 0.09 0.13 0.13 0.02 0.00 0.19 0.20 0.18 0.12 0.01 0.51 0.03 0.54 0.16 0.42 0.42
39 0.15 0.10 0.12 0.18 0.01 0.01 0.15 0.11 0.17 0.11 0.03 0.43 0.05 0.55 0.14 0.53 0.53
40 0.16 0.12 0.10 0.16 0.00 0.02 0.14 0.14 0.17 0.13 0.02 0.43 0.04 0.56 0.10 0.52 0.52
45 0.13 0.09 0.13 0.13 0.02 0.00 0.19 0.20 0.18 0.12 0.01 0.51 0.03 0.54 0.16 0.42 0.42
46 0.12 0.09 0.14 0.14 0.03 0.00 0.19 0.20 0.16 0.10 0.03 0.51 0.02 0.55 0.18 0.42 0.42
48 0.15 0.09 0.18 0.15 0.03 0.03 0.20 0.18 0.17 0.09 0.03 0.47 0.06 0.53 0.22 0.45 0.45
49 0.15 0.09 0.16 0.16 0.01 0.03 0.18 0.15 0.18 0.07 0.06 0.44 0.07 0.54 0.21 0.48 0.48
51 0.12 0.09 0.14 0.14 0.03 0.00 0.19 0.20 0.16 0.10 0.03 0.51 0.02 0.55 0.18 0.42 0.42
63 0.06 0.03 0.14 0.14 0.20 0.01 0.07 0.06 0.02 0.04 0.08 0.07 0.06 0.24 0.01 0.93 0.93
VII: Sensitivity coeffi cients of principal stress σ3, lower surface
Point Input Variable
X1 X2 X3 X4 X5 X6 X7 X8 X9 X10 X11 X12 X13 X14 X15 X16 X17
1603 0.09 0.15 0.14 0.10 0.11 0.20 0.04 0.15 0.28 0.31 0.06 0.22 0.11 0.06 0.07 0.71 0.71
2403 0.16 0.21 0.01 0.08 0.09 0.11 0.07 0.09 0.20 0.01 0.06 0.26 0.13 0.00 0.05 0.91 0.91
2503 0.02 0.18 0.09 0.07 0.17 0.18 0.23 0.34 0.07 0.23 0.01 0.62 0.17 0.06 0.13 0.52 0.52
2603 0.29 0.54 0.05 0.07 0.24 0.11 0.17 0.11 0.16 0.11 0.23 0.28 0.00 0.05 0.25 0.40 0.40
2703 0.12 0.03 0.03 0.18 0.29 0.02 0.17 0.06 0.05 0.11 0.03 0.15 0.20 0.12 0.21 0.87 0.87
3003 0.05 0.28 0.16 0.11 0.10 0.27 0.07 0.14 0.06 0.07 0.05 0.57 0.25 0.18 0.21 0.58 0.58
3203 0.16 0.21 0.01 0.08 0.09 0.11 0.07 0.09 0.20 0.01 0.06 0.26 0.13 0.00 0.05 0.91 0.91
3903 0.02 0.34 0.22 0.40 0.02 0.17 0.17 0.30 0.06 0.18 0.06 0.37 0.13 0.04 0.11 0.55 0.55
4003 0.10 0.43 0.21 0.31 0.07 0.13 0.13 0.37 0.08 0.10 0.06 0.42 0.12 0.07 0.10 0.49 0.49
That is, random variability infl uences diff erently principal stress σ1 and principal stress σ3, diff erently principal stresses on the upper and lower surface of concrete slabs and diff erently in individual points in which sensitivity coeffi cients are calculated. The dominant infl uence shows the random variability of temperature fi eld acting on the upper and the lower surface of the concrete slabs.
In some points of the lower (but also of the upper) surface of slabs large tensile stresses occur, that
reach a maximum value of about 5.3 MPa. Especially on the lower surface in the points near the external load application and in all corners of the slabs the creation of tensile cracks is highly probable. The presented study also shows that the standard deterministic analysis with the input variables set to their nominal (mean) values generally does not provide information about the average behavior of the structure.
CONCLUSION
Rheological properties of materials, cracking, joints, contact of concrete slabs in joints, contact of slab and the subsequent material layer, temperature changes, non-homogenity of pavement base, water regime in the subgrade, environmental changes etc. infl uence behavior of the rigid pavements in a decisive way. Moreover, the problem is complicated by the fact that the input data are generally random variables. The combination of the proper analytical model and modern simulation techniques seems to be an eff ective tool for the solution of the problem.
The behavior of the older type of rigid pavement formerly used in the Czech Republic is analyzed. The structure is loaded by the self-weight of concrete slabs, by the thermal loading due to the temperature diff erence between the upper and lower surface of the slab, and by the external load of intensity 50kN. Contrary to the original former design, the base layer is supposed to be made from a recycled material instead of a natural one in this study.
The computational model is based on the nonlinear fi nite element method. Four concrete slabs, all other layers and longitudinal and transverse joints are modeled as 3D space. Attention is paid to modeling of concrete slab contact with subsequent material layer and interaction of adjacent slabs in joints. In these areas the so-called contact problem occurs, in which tensile stresses cannot be transmitted. This is the case of structural nonlinearity and the pavement modeling therefore becomes nonlinear.
The infl uence of uncertainties in input variables on the behavior of the pavement is respected in the analysis using Updated Latin Hypercube Sampling Method with 20 simulations. Total 17 basic random input variables describing layer thicknesses, mechanical properties of materials, characteristics of joints and temperature on both surfaces of concrete slabs are taken into account in the study. Their statistical parameters are carefully evaluated taking into account the data obtained from in-situ measurements, experimental tests, data from technological handbooks and scientifi c publications and the corresponding standards. The infl uence of the current level of construction process and technological discipline is also taken into account. The normal and truncated normal CDF are used for symmetrically distributed variables, the three-parametric lognormal CDF for the other case. The statistical and sensitivity analysis of principal stresses σ1 and σ3 in concrete slabs is performed. The stresses are evaluated in 53 points on the upper and lower surface (106 points total) of concrete slabs. Principal stress σ1 represents an extreme value of tensile stress in the given point of the structure, while σ3 is an extreme value of compressive stress, that arise due to the spatial state of stress. The nominal values of principal stresses σ1 obtained from deterministic analysis are within the interval 0.3 to 1.6 MPa on the lower surface and within the interval −0.05 to 1.1 MPa on the upper surface. Mean values of stresses on both surfaces in all points have the character of tensile stress and are generally always greater than the nominal values. They are within the interval 0.4 to 2.0 MPa on the lower surface and within the interval 0.2 to 1.4 MPa on the upper surface. The largest nominal as well as mean values reach their maximum at points near the external load application.
The interval in which principal stresses σ1 may occur is considerable high. Larger tensile stresses and thus higher probability of tensile cracks occurring arise on the lower surface of concrete slabs. In the case of lower surface, the maximum values are up to 5.3 MPa, in the case of upper surface they are up to 3.3 MPa.
The principal stresses σ1 in some points on the upper but especially on the lower surface reach magnitude where the creation of tensile cracks is highly probable. Taken into account the tensile strength of standard quality concrete, there is at least probability of 1% of tensile crack creation on the upper surface and at least probability of 5% of tensile crack creation on the lower surface.
The principal stress σ1 in most points on the lower surface is infl uenced by the temperature fi eld acting on the upper and lower surface of the concrete slabs. Infl uence of these variables can be considered as dominant.
arise on the upper surface of concrete slabs. In this case, the maximum values are up to −7.3 MPa, in the case of lower surface they are up to −4.9 MPa. The largest compressive stresses on the upper surface arise in points on the transverse axis of symmetry of all slabs and in points close the contact of all slabs. On the lower surface the largest compressive stresses arise in some corners of slabs.
The principal stresses σ3 on the both surfaces are aff ected by random variability of the input variables diff erently. In the points on the upper surface the infl uence of temperature fi eld acting on the upper and lower surface of the concrete slabs are dominant. Infl uence of other variables can be considered as minimal or negligible. On the lower surface the infl uence of temperature fi eld is still dominant, but the infl uence of other variables is no longer negligible. The infl uence of the width of transverse joint, as well as the mechanical properties of concrete slabs, the thickness of the base layer, and the modulus of elasticity of the sub-base layer may be mentioned.
Acknowledgement
The research was supported by the project TA010226 “Optimization of design and realization of low capacity road pavements” of the Technology Agency of Czech Republic.
REFERENCES
FLORIAN, A. and, NOVÁK, D. 1988. The Statistical Model Selection for Random Variables. Engineering Workstations Journal, 4(3): 158–162.
FLORIAN, A. 1992. An Effi cient Sampling Scheme: Updated Latin Hypercube Sampling. Journal Probabilistic Engineering Mechanics, 7(2): 123–130. FLORIAN, A. and NAVRÁTIL J. 1993. Reliability
Analysis of the Cable Stayed Bridge in Construction and Service Stages. In: Proceedings. of the ICOSSAR’93. Innsbruck, Austria, 869–877. FLORIAN, A. 2005. Optimization of parametric
studies using Updated Latin Hypercube Sampling. In: Proceedings of the ICOSSAR 2005. Rome, Italy, 2319–2323.
FLORIAN, A., ŠEVELOVÁ, L. and HELA, R. 2011. Reliability Analysis of Defl ections of Concrete Pavement. In IBRACON 2011: proceedings of the 2nd International Conference on Best Practices for Concrete
Pavements. Brazil: Florianopolis, 1–10.
FLORIAN, A., ŠEVELOVÁ, L. and ŽÁK, J. 2015. Infl uence of Environmental Humidity on
Mechanical Properties of Natural and Recycled Unbound Materials. Acta Universitatis Agriculturae et Silviculturae Mendelianae Brunensis, 63(2): 405–409.
LEE, S. W., JEONG, J. H. and CHON, B. J. 2010. Probabilistic Modelling of Pavement Joint Opening. Proc. of the Institution of Civ. Eng. Transport, 163(1): 9–17.
LEONOVICH, I., MELNIKOVA, I. and PUODŽIUKAS, V. 2013. Estimation of the cracking probability in road structures by modeling of external infl uences. The Baltic Journal of Road and Bridge Engineerin, 8(4): 240–249.
McKAY, M., BECKMAN, R. J. and CONOVER, W. J. 1979. A Comparison of Three Methods for Selecting Values of Input Variables in the Analysis of Output from a Computer Code. Technometrics, 2: 239–245.
WOJTKIEWICZ, S. F., KHAZANOVICH, L., GAURAV, G. et al. 2010. Probabilistic Numerical Simulation of Pavement Performance using MEPDG. Road Materials and Pavement Design, 11(2): 291–306.
Contact information Aleš Florian: [email protected]