“
In silico study of SARS-CoV-2 Nucleocapsid Protein-Protein Interactions and Potential Candidates for their Stabilization ”
Fernández, J.F. and Lavecchia, M. J.Supplementary Information
Additional Information about the Methodology
1
Interface Preparation
1
Molecular Docking Studies
1
Molecular Dynamics (MD) Simulations
1
Interaction energy calculations
2
Bibliography
3
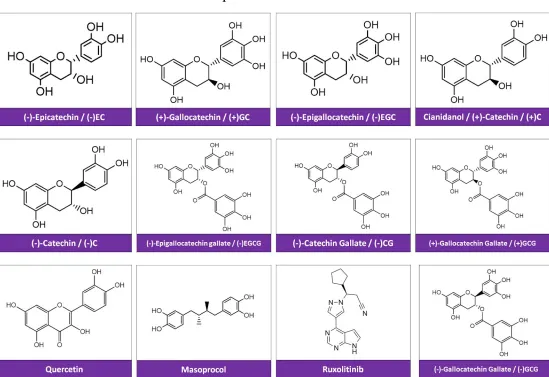
Compounds Structures
4
Docking
5
Docking Results
5
Correlation with previously reported activities
7
Molecular Dynamics
8
Ligand-Free Interfaces
8
Additional Information about the Methodology
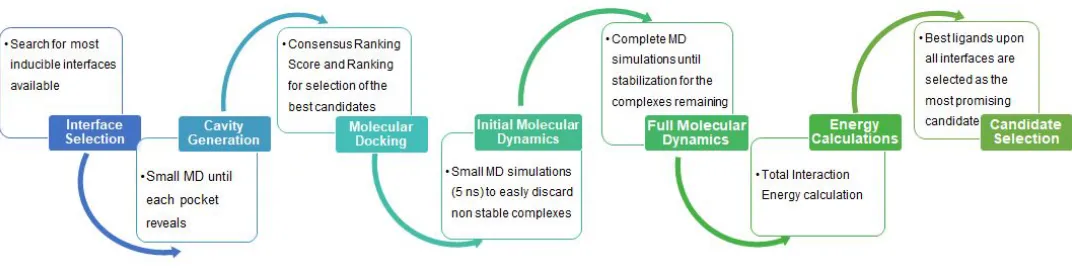
Figure S1. General scheme of the protocol developed for this research.
Interface Preparation
Dimers were subjected to a minimization, heating and NPT equilibration process in order to generate
small cavities, where it is possible to locate a ligand that stabilizes. Thus, three dimers interfaces were obtained,
which monomers are formed with residues 44-180 of the NTD N protein.
Molecular Docking Studies
Compounds from the DrugBank 5.1.16 database were screened against dimer interfaces. The
protonation state of each ligand at pH 7.4 was based on analysis using FixpKa, included in QUACPAC 2.0.2.2
(QUACPAC 2.0.2.2: OpenEye Scientific Software, Santa Fe, NM.
http://www.eyesopen.com
) and its
conformers were generated using Omega
(
Hawkins PCD
et al.
2010)
. Molecular docking was performed to find
and score binding poses on interfaces by means of FRED software. Using Make Receptor tool, include in the
OEDocking 3.4.0.2 suite, OpenEye (OEDOCKING 3.4.0.2: OpenEye Scientific Software, Santa Fe, NM.
http://www.eyesopen.com
.) a docking region was selected to include the dimer interface. Parameters were kept
to their default value.
Based on the results, the Phenol-Explorer database (Neveu V.
et al.
2010) was included to be treated
with this same docking protoco
l.
Consensus
Docking Score (CDS)
was calculated with the following equation:
DS
C
=
ScoreIF−1AverageScoreIF−1
+
AverageScoreScoreIF−2IF−2+
AverageScoreScoreIF−3IF−3+
AverageScoreScoreRNARNAMolecular Dynamics (MD) Simulations
neutralized complexes were immersed in a box of TIP3P waters which extended up to 15 Å from the complex.
Dimers were described using the Amber14SB force field (Maier J.
et al.
2015). Ligands were described using
the Generalized Amber Force Field (GAFF) (Wang J.
et al.
2004) with charges derived from RESP, which were
calculated with Antechamber module and Gaussian03 (XX ). Leap and Antechamber (Wang W.
et al.
2006) are
included in the package AmberTools 19.0 (D.A. Case
et. al.
2019)
All MD simulations were run using the NAMD 2.13 software (Philips J.
et al.
2005). The van der Waals
interaction cutoff distances were set at 12 Å and long-range electrostatic forces were computed using the
particle mesh Ewald summation method with a grid size set to 1.0 Å. The 1-4 contributions were multiplied by
a factor of 0.83 to match the AMBER force field requirements. The complexes were submitted to a series of
minimization stages (including hydrogens, waters, residue side chains and the complete system) of 100,000
maximum steps each, and heating from 0 to 310K. For equilibration/production simulations, constant
temperature (310 K) was maintained using Langevin dynamics with a damping coefficient of 5 ps
-1, while
pressure was kept constant at 1 atm through the Nosé-Hoover Langevin piston method with a decay period of
200 fs and a damping time constant of 100 fs. A time step of 1 fs was used along molecular mechanics. Bonds
involving H atoms of waters were constrained using the SHAKE algorithm. Cationic Dummy Atom method
(Pang Y. 2001) was used when the Zn
2+cation is included in the system.
Interaction energy calculations
Bibliography
D.A. Case, K. Belfon, I.Y. Ben-Shalom, S.R. Brozell, D.S. Cerutti, T.E. Cheatham, III, V.W.D. Cruzeiro, T.A. Darden,
R.E. Duke, G. Giambasu, M.K. Gilson, H. Gohlke, A.W. Goetz, R. Harris, S. Izadi, S.A. Izmailov, K. Kasavajhala,
A. Kovalenko, R. Krasny, T. Kurtzman, T.S. Lee, S. LeGrand, P. Li, C. Lin, J. Liu, T. Luchko, R. Luo, V. Man,
K.M. Merz, Y. Miao, O. Mikhailovskii, G. Monard, H. Nguyen, A. Onufriev, F.Pan, S. Pantano, R. Qi, D.R. Roe,
A. Roitberg, C. Sagui, S. Schott-Verdugo, J. Shen, C.L. Simmerling, N.R.Skrynnikov, J. Smith, J. Swails, R.C.
Walker, J. Wang, L. Wilson, R.M. Wolf, X. Wu, Y. Xiong, Y. Xue, D.M. York and P.A. Kollman (2019), AMBER
2019, University of California, San Francisco.
Gohlke H, Kiel C, Case DA. Insights into Protein–Protein Binding by Binding Free Energy Calculation and Free Energy
Decomposition for the Ras–Raf and Ras–RalGDS Complexes.
Journal of Molecular Biology
2003;
330
:891–913.
Hawkins PCD, Skillman AG, Warren GL
et al.
Conformer Generation with OMEGA: Algorithm and Validation Using
High Quality Structures from the Protein Databank and Cambridge Structural Database.
Journal of Chemical
Information and Modeling
2010;
50
:572–84.
Maier JA, Martinez C, Kasavajhala K
et al.
ff14SB: Improving the Accuracy of Protein Side Chain and Backbone
Parameters from ff99SB.
Journal of Chemical Theory and Computation
2015;
11
:3696–713.
Miller BR, Mcgee TD, Swails JM
et al.
MMPBSA.py: An Efficient Program for End-State Free Energy Calculations.
Journal of Chemical Theory and Computation
2012;
8
:3314–21.
Neveu V, Perez-Jimenez J, Vos F
et al.
Phenol-Explorer: an online comprehensive database on polyphenol contents in
foods.
Database
2010;
2010
, DOI: 10.1093/database/bap024.
Pang Y-P. Successful molecular dynamics simulation of two zinc complexes bridged by a hydroxide in phosphotriesterase
using the cationic dummy atom method.
Proteins: Structure, Function, and Genetics
2001;
45
:183–9.
Phillips JC, Braun R, Wang W
et al.
Scalable molecular dynamics with NAMD.
Journal of Computational Chemistry
2005;
26
:1781–802.
Roe DR, Cheatham TE. PTRAJ and CPPTRAJ: Software for Processing and Analysis of Molecular Dynamics Trajectory
Data.
Journal of Chemical Theory and Computation
2013;
9
:3084–95.
Wang J, Wang W, Kollman PA
et al.
Automatic atom type and bond type perception in molecular mechanical
calculations.
Journal of Molecular Graphics and Modelling
2006;
25
:247–60.
Wang J, Wolf RM, Caldwell JW
et al.
Development and testing of a general amber force field.
Journal of Computational
Chemistry
2004;
25
:1157–74.
Wishart DS. DrugBank: a comprehensive resource for in silico drug discovery and exploration.
Nucleic Acids Research
Compounds Structures
Docking
Docking Results
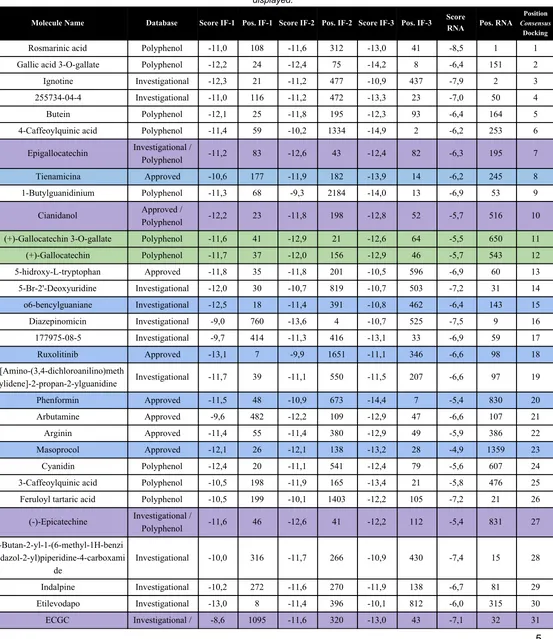
Table S1. Summary of Docking Results. Compounds with the best consensus docking score of all three docked interfaces are displayed.
Molecule Name Database Score IF-1 Pos. IF-1 Score IF-2 Pos. IF-2 Score IF-3 Pos. IF-3 Score
RNA Pos. RNA
Position
Consensus
Docking
Rosmarinic acid Polyphenol -11,0 108 -11,6 312 -13,0 41 -8,5 1 1
Gallic acid 3-O-gallate Polyphenol -12,2 24 -12,4 75 -14,2 8 -6,4 151 2
Ignotine Investigational -12,3 21 -11,2 477 -10,9 437 -7,9 2 3
255734-04-4 Investigational -11,0 116 -11,2 472 -13,3 23 -7,0 50 4
Butein Polyphenol -12,1 25 -11,8 195 -12,3 93 -6,4 164 5
4-Caffeoylquinic acid Polyphenol -11,4 59 -10,2 1334 -14,9 2 -6,2 253 6
Epigallocatechin Investigational /
Polyphenol -11,2 83 -12,6 43 -12,4 82 -6,3 195 7
Tienamicina Approved -10,6 177 -11,9 182 -13,9 14 -6,2 245 8
1-Butylguanidinium Polyphenol -11,3 68 -9,3 2184 -14,0 13 -6,9 53 9
Cianidanol Approved /
Polyphenol -12,2 23 -11,8 198 -12,8 52 -5,7 516 10
(+)-Gallocatechin 3-O-gallate Polyphenol -11,6 41 -12,9 21 -12,6 64 -5,5 650 11
(+)-Gallocatechin Polyphenol -11,7 37 -12,0 156 -12,9 46 -5,7 543 12
5-hidroxy-L-tryptophan Approved -11,8 35 -11,8 201 -10,5 596 -6,9 60 13
5-Br-2'-Deoxyuridine Investigational -12,0 30 -10,7 819 -10,7 503 -7,2 31 14
o6-bencylguaniane Investigational -12,5 18 -11,4 391 -10,8 462 -6,4 143 15
Diazepinomicin Investigational -9,0 760 -13,6 4 -10,7 525 -7,5 9 16
177975-08-5 Investigational -9,7 414 -11,3 416 -13,1 33 -6,9 59 17
Ruxolitinib Approved -13,1 7 -9,9 1651 -11,1 346 -6,6 98 18
1-[Amino-(3,4-dichloroanilino)meth
ylidene]-2-propan-2-ylguanidine Investigational -11,7 39 -11,1 550 -11,5 207 -6,6 97 19
Phenformin Approved -11,5 48 -10,9 673 -14,4 7 -5,4 830 20
Arbutamine Approved -9,6 482 -12,2 109 -12,9 47 -6,6 107 21
Arginin Approved -11,4 55 -11,4 380 -12,9 49 -5,9 386 22
Masoprocol Approved -12,1 26 -12,1 138 -13,2 28 -4,9 1359 23
Cyanidin Polyphenol -12,4 20 -11,1 541 -12,4 79 -5,6 607 24
3-Caffeoylquinic acid Polyphenol -10,5 198 -11,9 165 -13,4 21 -5,8 476 25
Feruloyl tartaric acid Polyphenol -10,5 199 -10,1 1403 -12,2 105 -7,2 21 26
(-)-Epicatechine Investigational /
Polyphenol -11,6 46 -12,6 41 -12,2 112 -5,4 831 27
N-Butan-2-yl-1-(6-methyl-1H-benzi midazol-2-yl)piperidine-4-carboxami
de
Investigational -10,0 316 -11,7 266 -10,9 430 -7,4 15 28
Indalpine Investigational -10,2 272 -11,6 270 -11,9 138 -6,7 81 29
Polyphenol
(-)-Catechin Gallate Polyphenol -8,9 798 -13,2 10 -12,4 83 -6,4 162 32
Caffeoyl tartaric acid Investigational -11,1 101 -11,0 619 -12,3 99 -6,1 259 33
Sedemetan Investigational -9,4 549 -11,3 454 -11,4 249 -7,4 13 34
Ceforanide Approved -10,3 245 -11,7 245 -10,3 731 -7,3 20 35
Vipadenant Investigational -10,0 339 -11,1 534 -11,6 195 -7,0 44 36
Valomaciclovir Investigational -11,3 70 -11,8 222 -13,1 29 -5,1 1090 37
Phloretin Polyphenol -10,2 269 -12,0 153 -10,8 460 -6,8 69 38
Solabegron Investigational -11,3 67 -11,3 421 -12,3 97 -5,7 509 39
Pexidartinib Approved -10,8 133 -10,5 984 -11,6 194 -6,7 82 40
Guanosina Investigational -11,5 47 -10,9 685 -10,2 795 -6,8 66 41
Vyvanse Approved -9,8 388 -12,2 107 -13,3 25 -5,6 569 42
Bendazac Investigational -11,2 89 -11,6 299 -9,7 1129 -6,9 54 43
5-Caffeoylquinic acid Polyphenol -10,0 323 -11,8 213 -11,5 223 -6,6 108 43
Debio-1347 Investigational -9,7 445 -12,7 36 -11,2 296 -6,5 135 44
Procaterol Investigational -11,2 87 -11,8 214 -8,7 1957 -7,3 17 45
(-)-Catechin Polyphenol -11,2 75 -11,7 235 -12,2 108 -5,5 709 46
Triprolidine Investigational -10,6 179 -12,1 140 -10,5 592 -6,5 119 47
Polydatin Approved -8,7 1022 -12,2 113 -14,9 3 -5,4 787 48
Resveratrol 5-O-glucoside Polyphenol -8,7 1023 -12,2 114 -14,9 4 -5,4 788 49
Zolmitriptan Approved -10,8 139 -13,3 6 -11,7 185 -5,2 1000 51
(-)-Gallocatechin Gallate Polyphenol -7,4 2223 -13,2 11 -13,1 36 -6,3 131 55
Quercetina Investigational -10,9 124 -12,4 63 -11,2 310 -5,5 673 59
Brivudine Approved -13,8 1 -10,7 846 -9,9 1011 -5,1 1075 74
Trifluridine Approved -13,3 4 -10,1 1429 -11,4 241 -4,1 2262 165
Compounds selected for MD prior to Polyphenol database addition
Catechins selected for MD prior to Polyphenol database addition
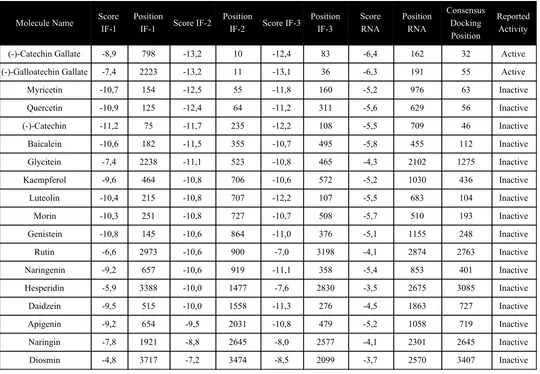
Correlation with previously reported activities
Table S2. Docking results of compounds included in Roh’s work, where “Reported activity” classifies compounds according to their reported outcome.
Molecule Name Score IF-1
Position
IF-1 Score IF-2
Position
IF-2 Score IF-3
Position IF-3 Score RNA Position RNA Consensus Docking Position Reported Activity
(-)-Catechin Gallate -8,9 798 -13,2 10 -12,4 83 -6,4 162 32 Active
(-)-Galloatechin Gallate -7,4 2223 -13,2 11 -13,1 36 -6,3 191 55 Active
Myricetin -10,7 154 -12,5 55 -11,8 160 -5,2 976 63 Inactive
Quercetin -10,9 125 -12,4 64 -11,2 311 -5,6 629 56 Inactive
(-)-Catechin -11,2 75 -11,7 235 -12,2 108 -5,5 709 46 Inactive
Baicalein -10,6 182 -11,5 355 -10,7 495 -5,8 455 112 Inactive
Glycitein -7,4 2238 -11,1 523 -10,8 465 -4,3 2102 1275 Inactive
Kaempferol -9,6 464 -10,8 706 -10,6 572 -5,2 1030 436 Inactive
Luteolin -10,4 215 -10,8 707 -12,2 107 -5,5 683 104 Inactive
Morin -10,3 251 -10,8 727 -10,7 508 -5,7 510 193 Inactive
Genistein -10,8 145 -10,6 864 -11,0 376 -5,1 1155 248 Inactive
Rutin -6,6 2973 -10,6 900 -7,0 3198 -4,1 2874 2763 Inactive
Naringenin -9,2 657 -10,6 919 -11,1 358 -5,4 853 401 Inactive
Hesperidin -5,9 3388 -10,0 1477 -7,6 2830 -3,5 2675 3085 Inactive
Daidzein -9,5 515 -10,0 1558 -11,3 276 -4,5 1863 727 Inactive
Apigenin -9,2 654 -9,5 2031 -10,8 479 -5,2 1058 719 Inactive
Naringin -7,8 1921 -8,8 2645 -8,0 2577 -4,1 2301 2645 Inactive
Molecular Dynamics
Ligand-Free Interfaces
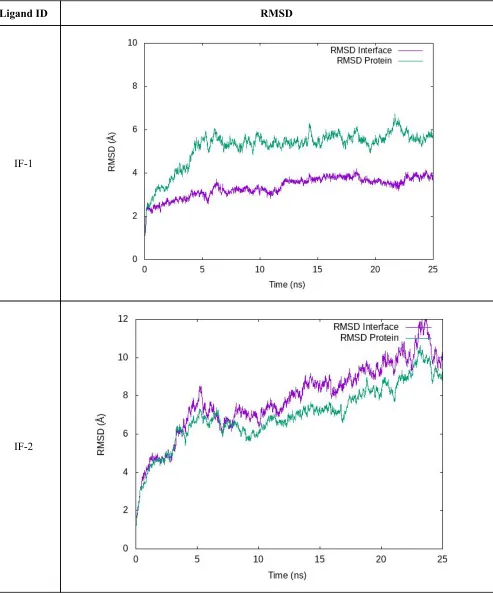
Table S3. RMSD profiles of the equilibration/production stage is shown for ligand-free interfaces. “RMSD Protein” was measured considering all residues in the complex aligned using the protein backbone. “RMSD Interface” were calculated aligning by the
interface-forming residues and then measured using those same residues.
Ligand ID
RMSD
Interfaces and their Interaction with Zn
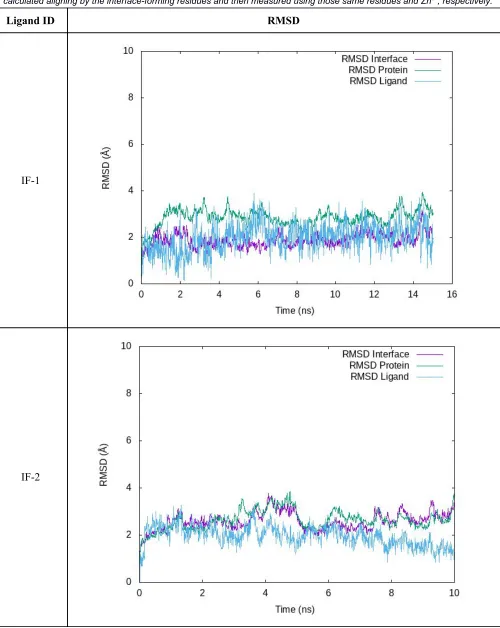
Table S4. RMSD profiles of the equilibration/production stage is shown for IF-1 and IF-2 interacting with Zn. “RMSD Protein” was measured considering all residues in the complex aligned using the protein backbone. “RMSD Interface” and “RMSD Ligand” were
calculated aligning by the interface-forming residues and then measured using those same residues and Zn2+, respectively.
Ligand ID
RMSD
IF-1
IF-1
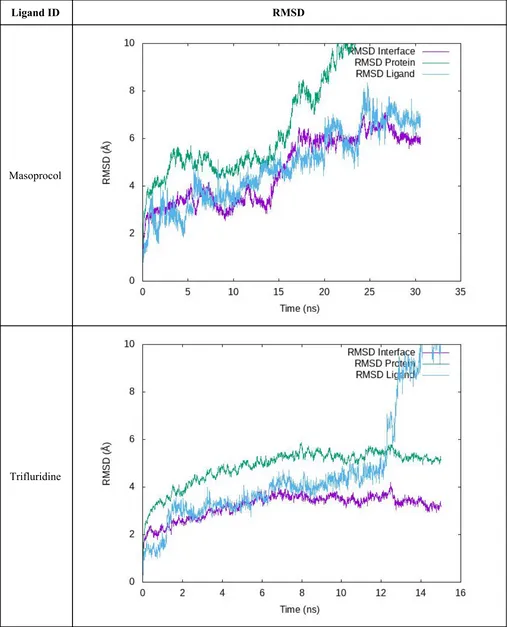
Table S5. RMSD profiles of the equilibration/production stage is shown for each compound in IF-1. “RMSD Protein” was measured considering all residues in the complex aligned using the protein backbone. “RMSD Interface” and “RMSD Ligand” were calculated
aligning by the interface-forming residues and then measured using those same residues and the ligand, respectively.
Ligand ID
RMSD
Masoprocol
Brivudine
Quercetin
(-)EC
Cianidanol
(+)GC
(-)C
(-)GCG
IF-2
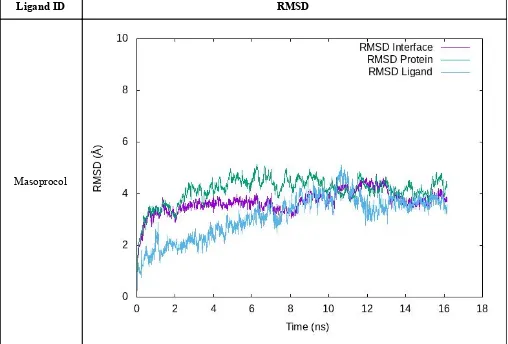
Table S6. RMSD profiles of the equilibration/production stage is shown for each compound in IF-2. “RMSD Protein” was measured considering all residues in the complex aligned using the protein backbone. “RMSD Interface” and “RMSD Ligand” were calculated
aligning by the interface-forming residues and then measured using those same residues and the ligand, respectively.
Phenformin
(-)EGC
Ruxolitinib
(-)EC
Cianidanol
(+)GC
(-)C
IF-3
Table S7. RMSD profiles of the equilibration/production stage is shown for each compound in IF-3. “RMSD Protein” was measured considering all residues in the complex aligned using the protein backbone. “RMSD Interface” and “RMSD Ligand” were calculated
aligning by the interface-forming residues and then measured using those same residues and the ligand respectively.
Ligand ID
RMSD
Phenformin
(-)EGC
Ruxolitinib
(-)EC
Cianidanol
(+)GC
(-)C
MMPBSA/MMGBSA Energy Calculations
Ligand Free Interfaces and Zn
2+-Dimer Interaction
Table S8. Energy estimations for the isolated homodimers and their Interaction with Zn2+. Standard deviations are shown between
parentheses.
Interface
Zn
2+-Protein Interaction
(kcal/mol)
Interaction (kcal/mol)
Monomer-Monomer
Total Interaction (kcal/mol)
IF-1
-
-37 (5)
-37 (5)
IF-2
-
-14 (5)
-14 (5)
IF-3
-
-17 (4)
-17 (4)
IF-1 + Zn
2+-101 (4)
-57 (4)
-158 (6)
IF-2 + Zn
2+-101 (5)
-41 (6)
-142 (7)
Ligand-Dimer Energy Calculations
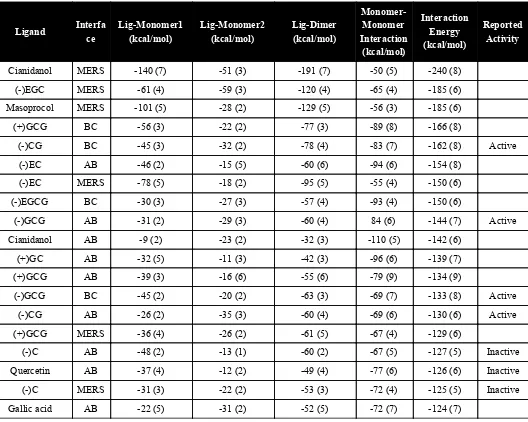
Table S9. Interaction Energy calculations for each compound. Reported biological activity is mentioned, when available. Standard deviations are shown between parentheses.
Ligand
Interfa
ce
Lig-Monomer1
(kcal/mol)
Lig-Monomer2
(kcal/mol)
Lig-Dimer
(kcal/mol)
Monomer-
Monomer
Interaction
(kcal/mol)
Interaction
Energy
(kcal/mol)
Reported
Activity
Cianidanol
MERS
-140 (7)
-51 (3)
-191 (7)
-50 (5)
-240 (8)
(-)EGC
MERS
-61 (4)
-59 (3)
-120 (4)
-65 (4)
-185 (6)
Masoprocol
MERS
-101 (5)
-28 (2)
-129 (5)
-56 (3)
-185 (6)
(+)GCG
BC
-56 (3)
-22 (2)
-77 (3)
-89 (8)
-166 (8)
(-)CG
BC
-45 (3)
-32 (2)
-78 (4)
-83 (7)
-162 (8)
Active
(-)EC
AB
-46 (2)
-15 (5)
-60 (6)
-94 (6)
-154 (8)
(-)EC
MERS
-78 (5)
-18 (2)
-95 (5)
-55 (4)
-150 (6)
(-)EGCG
BC
-30 (3)
-27 (3)
-57 (4)
-93 (4)
-150 (6)
3-O-gallate
(+)GC
BC
-31 (3)
-19 (2)
-50 (3)
-70 (4)
-120 (5)
(-)EGCG
AB
-36 (4)
-37 (4)
-73 (6)
-45 (5)
-118 (7)
(-)EGCG
MERS
-49 (2)
-20 (3)
-69 (3)
-47 (4)
-116 (5)
Ruxolitinib
BC
-15 (1)
-30 (2)
-44 (2)
-70 (5)
-114 (5)
(+)GC
MERS
-42 (5)
-16 (4)
-58 (5)
-55 (4)
-113 (6)
(-)CG
MERS
-35 (3)
-25 (2)
-60 (3)
-53 (4)
-113 (5)
Active
(-)EC
BC
-30 (5)
-9 (2)
-37 (3)
-74 (5)
-110 (6)
(-)EGC
BC
-37 (4)
-11 (3)
-48 (4)
-55 (6)
-103 (7)
(-)C
BC
-22 (3)
-22 (2)
-44 (5)
-56 (6)
-100 (7)
Inactive
Scopletin
AB
-26 (1)
-4 (1)
-30 (1)
-69 (6)
-98 (6)
(-)EGC
AB
-17 (2)
-28 (3)
-45 (4)
-52 (4)
-97 (6)
Quercetin
BC
-25 (2)
-16 (1)
-38 (2)
-50 (4)
-88 (5)
Inactive
Cianidanol
BC
-18 (4)
-16 (2)
-34 (5)
-51 (4)
-84 (6)
Ruxolitinib
AB
-15 (1)
-15 (2)
-30 (2)
-51 (4)
-81 (5)
Masoprocol
BC
-18 (2)
-15 (2)
-33 (2)
-43 (4)
-76 (5)
Scopletin
MERS
-14 (1)
-14 (3)
-28 (4)
-42 (4)
-70 (5)
Scopletin
BC
-2 (2)
-17 (2)
-19 (3)
-7 (6)
-26 (7)
2-iminobiotin
BC
Complex Not Stabilized
Brivudine
AB
Complex Not Stabilized
Dexlansoprazole
MERS
Complex Not Stabilized
Gallic acid
3-O-gallate
MERS
Complex Not Stabilized
Masoprocol
AB
Complex Not Stabilized
(-)GCG
MERS
Complex Not Stabilized
Active
o6-bencylguaniane
BC
Complex Not Stabilized
Phenformin
BC
Complex Not Stabilized
Phenformin
MERS
Complex Not Stabilized
Polydatin
MERS
Complex Not Stabilized
Quercetin
MERS
Complex Not Stabilized
Inactive
Ruxolitinib
MERS
Complex Not Stabilized
Ligand-Dimer Interaction Visualization of the Most Stable Complexes
Figure S5. (-)-Gallocatechin Gallate in IF-1
Figure S9. (-)-Epigallocatechin in IF-3