Control of hepatic fatty acid oxidation in suckling rats
Karen Jayne New
A thesis submitted for the degree of Doctor of Philosophy (PhD); August 2000
Department of Paediatric Surgery, The Institute of Child Health and Great Ormond Street Hospital for Sick Children NHS Trust
ProQuest Number: U 145535
All rights reserved
INFORMATION TO ALL USERS
The quality of this reproduction is dependent upon the quality of the copy submitted. In the unlikely event that the author did not send a complete manuscript
and there are missing pages, these will be noted. Also, if material had to be removed, a note will indicate the deletion.
uest.
ProQuest U 145535
Published by ProQuest LLC(2015). Copyright of the Dissertation is held by the Author. All rights reserved.
This work is protected against unauthorized copying under Title 17, United States Code. Microform Edition © ProQuest LLC.
ProQuest LLC
789 East Eisenhower Parkway P.O. Box 1346
___________________________________________________________________________ Abstract
Abstract
In this thesis, I use metabolic control analysis to investigate quantitatively, the control of neonatal hepatic fatty acid oxidation and ketogenesis. Specifically, I model, report and discuss the control of hepatic fatty acid oxidation, Krebs cycle and ketogenic fluxes by mitochondrial outer membrane carnitine palmitoyltransferase I (CRT I), in hepatocytes or mitochondria isolated from suckling rats, under physiological and (patho)physiological conditions, mimicking healthy and diseased states.
My work has:
(a) provided the first quantitative assessment of the control exerted by CRT I over carbon fluxes from palmitate, octanoate and palmitate:octanoate mixtures, in hepatocytes isolated from suckling rats;
(b) provided a quantitative assessment of the control exerted by CRT I over ketogenesis and total carbon flux from palmitate, in a re-defined system, in mitochondria isolated from suckling or adult rats (Krauss, et al., 1996);
(c) shown that the numerical value of the flux control coefficient for CRT I over ketogenesis changes with developmental stage and is lower in suckling rats than in adult rats in both hepatocyte and mitochondrial systems;
(d) demonstrated that the numerical value of the flux control coefficient for CRT I over ketogenesis changes in response to different substrates;
(e) indicated that whilst in adult rats, CRT I exerts a high level of control over ketogenesis in neonatal rats, CRT I is not ‘rate-limiting’ over ketogenesis, under physiological conditions;
(f) provided the first quantitative assessment of the control exerted by CRT I over carbon fluxes from palmitate in an in vitro model of neonatal sepsis;
(g) demonstrated that the potential of CRT I to control ketogenesis increases under certain (patho)physiological conditions;
Publications arising from this work
Publications arising from this work
New KJ, Eaton S, Elliott KRF, Spitz L and Quant PA. (accepted for publication, J Paed Sung)
Effect of lipopolysaccharide and cytokines on oxidative metabolism in neonatal hepatocytes.
New KJ, Eaton 8, Spitz L, Elliott KRF and Quant PA. Eur J Med Res. 5, 46-47.
2000.
Analysis of control exerted by CPT I over ketogenic flux in in vitro hepatocyte models designed to mimic the early stages of neonatal sepsis.
New KJ, Spitz L, Elliott KRF, Eaton S and Quant PA. (Poster/Abstract, Biochemical Society, Cork Meeting) 1999.
In vitro models of early stages of neonatal sepsis.
New KJ, Elliott KRF and Quant PA. Eur J Biochem. 259, 684-691. 1999.
Comparisons of flux control exerted by mitochondrial outer membrane carnitine palmitoyltransferase over ketogenesis in hepatocytes and mitochondria isolated from suckling or adult rats.
New KJ, Eaton S, Elliott KRF and Quant PA. in Advances in experimental medicine and biology: current views of fatty acid oxidation and ketogenesis, from organelles to point mutations. Plenum Press. 227-232.1999.
Is it time to reconsider the role of CPT I in control over ketogenesis?
Eaton S, Bartlett K, Pourfarzam M, Markley MA, New KJ and Quant PA. in Advances in experimental medicine and biology: current views of fatty acid oxidation and ketogenesis, from organelles to point mutations. Plenum Press. 155-160. 1999. Production and export of acyl-camitine esters by neonatal rat hepatocytes.
New KJ. The Biochemist, October Issue. 50. 1999. Communicating communication.
Quant PA, Lascelles CV, New KJ, Patil KK, Azzouzi N, Eaton S and Elliott KRF.
Biochem Soc Trans. 26,125-130. 1998. Impaired neonatal hepatic ketogenesis.
New KJ, Eaton S, Elliott KRF and Quant PA. in BioThermoKinetics in the Post Genomic Era, Proceedings of the 8®* International meeting on BioThermoKinetics
113-116. 1998.
CPT I: a reassessment of its role in control over ketogenic flux.
New KJ, Elliott KRF and Quant PA. Biochem Soc Trans. 26, S88. 1998.
Flux control exerted by mitochondrial outer membrane carnitine palmitoyltransferase over ketogenic flux in hepatocytes isolated from suckling rats.
New KJ, Elliott KRF and Quant PA. Biochem Soc Trans. 2 5 ,418S. 1997.
Acknowledgements
Acknowledgements
The research presented in this dissertation was performed in the Departments of Paediatric Surgery and Biochemistry, at the Institute of Child Health in London. My research was made possible by the financial support of the Sir Hailey Stewart Trust, and Professor Spitz, within the Department of Paediatric Surgery, for which I remain and will always be grateful.
I would like to thank my supervisors. Dr P A Quant, Dr K R F Elliott, Dr S Eaton and Dr D Muller, for their support and guidance during these studies. Their patience and suggestions were truly appreciated.
My grateful thanks are also extended to my family, friends and colleagues, who have provided encouragement and entertainment, both inside and outside the laboratory.
Especially, Chris Newman, who provided support, love and Cherry Coke. Thank you.
This dissertation is the result of my own work and includes nothing which is the outcome of work done in collaboration, unless acknowledged in the text. No part of this thesis has been, or is currently being submitted to any other Board for any other purposes.
Table of contents
Table of Contents
Title page... 1
Abstract... 2
Publications arising from this work... 3
Acknowledgements...4
Table of contents... 5
List of tables I List of schemes...10
List of figures... 11
List of abbreviations... 13
List of enzymes... 14
Chapter 1 Literature Review and Aims 1.1 Introduction... 15
1.2 Biochemical perspectives on hepatic fatty acid oxidation, the Krebs cycle and ketogenesis... 15
1.2.1 Plasma free fatty acids and their entry into hepatocytes... 15
1.2.2 Formation of acyl-CoA esters...17
1.2.3 Site of p-oxidation: mitochondria versus peroxisomes... 18
1.2.4 Entry into mitochondria...19
1.2.5 The reactions of mitochondrial p-oxidation... 27
1.2.6 Transestérification... 30
1.2.7 The reactions of the Krebs cycle...30
1.2.8 The reactions of the 3-hydroxy-3-methylglutaryl-CoA cycle...31
1.2.9 Ketone body utilization...33
1.2.10 Control distribution over the pathways of hepatic fatty acid oxidation and ketogenesis... 35
1.3 Physiological and clinical significance of the pathways of fatty acid oxidation and ketogenesis... 36
1.3.1 The role of ketone bodies...36
1.3.2 Fluctuation in ketone body concentrations...37
1.4 Metabolic control analysis (M C A )... 39
1.4.1 General introduction... 39
1.4.2 Flux control coefficients... 40
1.4.3 The summation theorem... 43
1.4.4 Elasticity coefficients... 45
1.4.5 The connectivity theorem...46
1.4.6 Bottom-up control analysis (BUC A)... 47
1.4.7 Top-down control analysis (TDC A)...47
1.4.8 Assumptions underlying the application of M C A ...48
1.5 Overall Aims... 49
Table of contents
1.5.2 Aims and objectives of Chapter 4: Application of top-down control analysis in hepatoc^es to investigate the distribution of control over carbon fluxes in the pathways of fatty
acid oxidation, ketogenesis and the Krebs cycle... 50
1.5.3 Aims and objectives of Chapter 5: Analysing the role of CPT I in control of carbon flux from medium-chain fatty acids and mixtures of long- and medium-chain fatty acids...50
1.5.4 Aims and objectives of Chapter 6: Analysing the role of CPT I in control of ketogenic flux in in vitro models of neonatal sepsis...51
1.5.5 Aims and objectives of Chapter 7; Effects of lipopolysaccharide and/or cytokines on neonatal oxidative liver metabolism...52
Chapter 2 Materials and methods 2.1 Materials... 53
2.1.1 Chemicals...53
2.1.2 Animals... 53
2.2 Methods... 53
2.2.1 Isolation of hepatocytes... 53
2.2.2 Incubation of hepatocytes for the measurement of ^“^C-ketone body production and ^'*C02 release... 56
2.2.3 Assay of ^^C02 release in hepatocytes...57
2.2.4 Assay of ^'*C-ketone body production in hepatocytes...57
2.2.5 Permeabilization of hepatocytes and assay of mitochondrial outer membrane carnitine palmitoyltransferase (CPT I) activity... 58
2.2.6 Hepatocyte oxygen consumption... 60
2.2.7 Electron microscopy of hepatocytes... 61
2.2.8 Statistical analysis...62
Chapter 3 Analysing the role of hepatic mitochondrial outer-membrane carnitine palmitoyltransferase in the control of carbon flux from palmitate 3.1 Introduction...63
3.1.1 Historical perspectives in the control of hepatic fatty acid oxidation and ketogenesis...63
3.1.2 Control analysis of hepatic fatty acid oxidation and ketogenesis...65
3.1.3 Aims of this section...67
3.2 Theory and approaches...67
3.2.1 Application of bottom-up control analysis in hepatocytes isolated from suckling rats...67
3.2.2 Application of bottom-up control analysis in mitochondrial systems...70
3.3 Results...74
3.3.1 Bottom-up control analysis in hepatocyte systems...74
3.3.2 Bottom-up control analysis in mitochondrial systems...81
3.4 Discussion...86
3.4.1 Validation of techniques...86
3.4.2 Tangents to inhibitor curves (where inhibitor tends to zero)...87
3.4.3 Application of bottom-up control analysis in hepatocytes isolated from suckling rats...87
Table of contents
3.4.4 Application of bottom-up control analysis in mitochondria... 91
3.4.5 Interpretation of bottom-up control analysis results...92
3.4.6 Factors effecting the values for flux control coefficients for CPT I over carbon fluxes... 93
3.4.7 Conclusions... 94
Chapter 4 Application of top-down control analysis in hepatocytes to investigate the distribution of control over carbon fluxes in the pathways of fatty acid oxidation, ketogenesis and the Krebs cycle 4.1 Introduction and aim s...95
4.2 Theory and approaches... 95
4.2.1 Application of top-down control analysis in hepatocytes... 95
4.3 Results...99
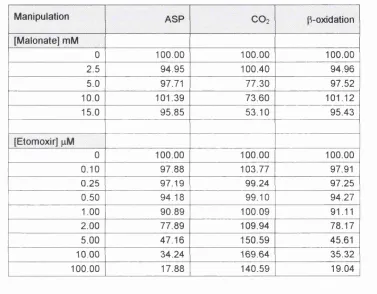
4.3.1 Effects of manipulation of the Krebs block...99
4.3.2 Effects of manipulation of the p-oxidation block... 99
4.3.3 Flux data from two independent manipulation experiments... 104
4.3.4 Calculation of group flux control coefficients... 105
4.4 Discussion and conclusions...106
Chapter 5 Analysing the role of mitochondrial outer membrane carnitine palmitoyltranserase in control of carbon flux from medium-chain fatty acids and mixtures of long- and medium-chain fatty acids 5.1 Introduction... 107
5.1.1 In utero nutrition... 107
5.1.2 Immediate post-partum nutrition... 108
5.1.3 Neonatal nutrition... 109
5.1.4 Metabolic fate of the fatty acid components of milk... 110
5.1.5 Aims of this section... 112
5.2 Theory and approaches... 112
5.2.1 Application of bottom-up control analysis in hepatocytes...112
5.3 Results... 114
5.3.1 Bottom-up control analysis in hepatocytes (octanoate as substrate)... 114
5.3.2 Bottom-up control analysis in hepatocytes ([1-‘'^C]octanoate:unlabelled palmitate as substrate)... 114
5.3.3 Bottom-up control analysis in hepatocytes ([l-^'^CJpalmitateiunlabelled octanoate as substrate)...117
5.3.4 Bottom-up control analysis in hepatocytes ([1-''^C]octanoate:[1-^^C]palmitate as substrate)... 117
5.4 Discussion... 120
5.4.1 Control exerted by CPT I over flux from octanoate to ketone bodies...120
5.4.2 Control exerted by CPT I over flux from singly labelled mixed fats to ketone bodies...123
5.4.3 Control exerted by CPT I over flux to ketone bodies, where both substrates have been labelled...123
5.4.4 Potential implications for inborn errors of metabolism... 125
5.4.5 Diet related changes in the ability of CPT I to control carbon fluxes... 126
Table of contents
Chapter 6
Analysing the role of hepatic mitochondrial outer-membrane carnitine palmitoyltransferase in control of ketogenic flux in in vitro models of neonatal sepsis
6.1 Introduction...128
6.1.1 Sepsis... 128
6.1.2 Common causes of sepsis... 129
6.1.3 Agents involved in the sepsis response...130
6.1.4 Fatty acid oxidation and ketogenesis during sepsis...134
6.1.5 Control of ketogenesis during sepsis: the role of CPT I ...137
6.1.6 Aims of this section...140
6.2 Theory and approaches...141
6.2.1 Isolation of hepatocytes in the presence of lipopolysaccharide (LPS) and/or tumour necrosis factor (TNFa), interleukin 6(1 L6)... 141
6.2.2 Application of bottom-up control analysis in control and treated hepatocytes...142
6.3 Results...143
6.3.1 Effect on cell yield and viability of addition of LPS, TNFa and/or IL6 during the hepatocyte isolation procedure... 143
6.3.2 Effect of addition of LPS+TNFa on hepatocyte gross morphology... 146
6.3.3 Effect of addition of LPS+TNFa+IL6 on hepatocyte gross morphology... 147
6.3.4 Effect of LPS, TNFa and/or IL6 on ketone body production... 148
6.3.5 Effect of combinations of LPS, TNFa and/or IL6 on the role of CPT I in control of carbon flux from palmitate...150
6.4 Discussion...160
6.4.1 The addition of agents during the cell isolation procedure...160
6.4.2 Ketone body production in hepatocytes exposed to LPS and/or cytokines during isolation...162
6.4.3 Bottom-up control analysis of LPS+TNFa or LPS+TNFa+IL6 treated hepatocytes isolated from suckling rats...164
6.4.4 Factors affecting the capacity of CPT I to control flux in response to cytokines and L P S ...166
6.4.5 Conclusions... 167
Chapter 7 Effects of lipopolysaccharide and/or cytokines on neonatal oxidative liver metabolism 7.1 Introduction... 169
7.1.1 Mitochondrial oxygen consumption... 170
7.1.2 Non-mitochondrial oxygen consumption... 174
7.1.3 Total cellular oxygen consumption... 176
7.1.4 Oxygen consumption during sepsis... 177
7.1.5 Reye’s Syndrome... 179
7.1.6 Aims of this section... 179
7.2 Results... 180
7.2.1 Effect of LPS on hepatocyte respiration...180
Table of contents
7.2.3 Effect of LPS+TNFa on hepatocyte respiration... 183
7.2.4 Effect of half dose LPS+TNFa on hepatocyte respiration... 184
7.2.5 Effect of LPS+TNFa+IL6 on hepatocyte respiration... 184
7.2.6 Effect of half dose LPS+TNFa+IL6 on hepatocyte respiration... 186
7.2.7 Effect of salicylic acid on total endogenous hepatocyte respiration in control and in LPS+TNFa+IL6 exposed hepatocytes...186
7.3 Discussion...189
7.3.1 The effect of LPS or individual cytokines on hepatocyte respiration... 189
7.3.2 The effect of combinations of LPS and cytokines on hepatocyte respiration...190
7.3.3 Comparison of the effects of the different models of neonatal sepsis on oxygen consumption... 194
7.3.4 Investigating the effects of salicylic acid on hepatocyte respiration in the LPS+TNFa+IL6 in vitro model of neonatal sepsis... 197
7.3.5 Conclusions... 198
Chapter 8 Conclusions and future research 8.1 The effects of development, substrate or clinical condition on the potential of CPT I to control carbon fluxes... 199
8.2 Development and use of in vitro neonatal model of sepsis... 201
Appendix Derivation of generalised and specific forms of the equations used in the TDCA in Chapter 4 A l l Introduction...204
A1.2 Consideration of sign convention... 204
A1.3 Derivation of generalised equations using the sign convention set out by Brand (1996)...206
A1.4 Derivation of generalised equations for the calculation of group flux control coefficients as a function of fluxes alone... 208
A1.5 Specific equations for the calculation of the first series of group flux control coefficients as a function of fluxes alone...210
A 1.6 Calculation of relative elasticities... 211
A 1.7 Calculation of the remaining series of group flux control coefficients . . . 214
A1.8 Summary of key equations used for the calculation of each group flux control coefficient... 215
List of tables / schemes
List of tables
Table 3.1 Individual flux control coefficients for CPT I over rates of formation of ketone bodies (ASP), carbon dioxide or total carbon products (TCP)
from palmitate in isolated fiepatocytes ...81
Table 4.1 Full series of flux control coefficients in fiepatocyte TDCA system described in Section 4 .1 ... 97
Table 4.2 Data from each experimental manipulation expressed in terms of percent change in flux... 104
Table 6.1 In vitro model of neonatal sepsis: agents added during cell preparation ...141
Table 6.2 Absolute cell yields following addition of LPS and/or cytokines during hepatocyte isolation procedure...144
Table 6.3 Effect of addition of LPS and/or cytokines during hepatocyte isolation procedure on hepatocyte yield and viability...145
Table 6.4 Individual flux control coefficients for CPT I over rates of formation of ketone bodies (ASP) from palmitate in untreated control and treated hepatocytes... 160
Table 7.1 Effect of LPS and/or various cytokines on hepatocyte respiration expressed in terms of cell num ber 181 Table 7.2 Effect of LPS and/or various cytokines on hepatocyte respiration expressed in terms of dry mass... 182
Table 7.3 Absolute rates of total oxygen consumption in the absence or presence of sodium salicylate... 187
Table 7.4 Possible factors resulting in increased total oxygen consumption... 192
Table A1.1 Full series of generalised flux control coefficients in hepatocyte TDCA system... 205
Table A1.2 (a) Equations used for series 1 flux control coefficients... 215
Table A1.2 (b) Equations used for series 2 flux control coefficients... 216
Table A1.2 (c) Equations used for series 3 flux control coefficients...216
List of schemes Scheme 1.1 Long-chain fatty acid activation... 17
Scheme 1.2 Formation of acyl-camitine esters...20
Scheme 1.3 Reactions of p-oxidation...28
Scheme 1.4 Reactions of the 3-hydroxy-3-methylglutaryl-CoA cycle... 32
Scheme 1.5 General linear pathway...41
Scheme 1.6 General branched pathway...44
Scheme 3.1 Hepatocyte BUCA system... 68
Scheme 3.2 Original TDCA mitcochondrial system...71
Scheme 3.3 Re-defined BUCA mitochondrial system... 71
Scheme 4.1 Conceptually simplified system used for TDCA in hepatocytes ...96
Scheme 5.1 Hepatocyte BUCA system... 112
Scheme 6.1 Hepatocyte BUCA system... 142
___________________________________________________________________ List of figures
List of figures
Figure 1.1 Schematic representation of long-chain fatty
acid activation, transport and oxidation...23
Figure 1.2 Summary of reactions of ketone body utilization in extrahepatic tissues ... 34
Figure 3.1 Schematic grid for calculation of individual flux control coefficients for CPT I over ketogenesis and total carbon flux in isolated mitochondria...73
Figure 3.2 Effect of etomoxir on CPT I activity...75
Figure 3.3 Effect of etomoxir on CPT I activity and ketogenic flux...76
Figure 3.4 Scatter of points from individual data s e ts ... 77
Figure 3.5 Effect of etomoxir on CPT I activity and flux to carbon dioxide 79 Figure 3.6 Effects of etomoxir on CPT I activity and total carbon flu x ... 80
Figure 3.7 Effect of malonyl-CoA concentration and respiratory rate on external palmitoyl-camitine levels and carbon fluxes from palmitoyl-CoA in mitochondria isolated from adult rats...83
Figure 3.8 Effect of malonyl-CoA concentration and respiratory rate on external palmitoyl-camitine levels and carbon fluxes from palmitoyl-CoA in mitochondria isolated from suckling rats 84 Figure 3.9 Effect of malonyl-CoA concentration on flux control coefficients for CPT I over carbon fluxes from palmitoyl-CoA in mitochondria isolated from (a) adult or (b) suckling rats... 85
Figure 3.10 Comparison of distribution of control exerted by CPT I over ketogenic flux in (a) adult and (b) suckling rats... 88
Figure 3.11 Comparison of distribution of control exerted by CPT I over flux to CO2 in adults and suckling rats...89
Figure 3.12 Comparison of distribution of control over total carbon flux observed in (a) adult and (b) suckling rats ...90
Figure 4.1 Effects of malonate on flux through the Krebs cycle block of reactions... 100
Figure 4.2 Effects of malonate on flux through the KB and pox blocks of reactions... 101
Figure 4.3 Effect of etomoxir on flux through the pox block of reactions... 102
Figure 4.4 Effect of etomoxir on flux through the KB and Krebs cycle blocks of reactions...103
Figure 5.1 Effect of etomoxir on CPT I activity and ketogenic flux in the presence of octanoate as substrate... 115
Figure 5.2 Effect of etomoxir on CPT I activity and ketogenic flux in the presence of ([1-^^C]octanoate:unlabelled palmitate... 116
Figure 5.3 Effect of etomoxir on CPT I activity and ketogenic flux in the presence of ([1-^^C]palmitate:unlabelled octanoate... 118
Figure 5.4 Effect of etomoxir on CPT I activity and ketogenic flux in the presence of ([1 -^^C]palmitate:[1 -^^C]octanoate... 119
Figure 5.5 Ketogenic flux as a function of CPT I inhibition...120
Figure 5.6 Comparison of flux control coefficients from adult rats and from suckling rats ... 122
List of figures
List of figures (continued)
Figure 6.1 Schematic representation detailing the time
course of cytokine appearance in plasma ... 132
Figure 6.2 Effect of addition of LPS+TNFa during hepatocyte isolation on the ultrastructure of isolated heptocytes... 146
Figure 6.3 Effect of addition of LPS+TNFa+IL6 during hepatocyte isolation on the ultrastructure of isolated heptocytes... 147
Figure 6.4 Formation of f ^C]ASP over tim e...149
Figure 6.5 Effect of etomoxir on CPT I activity in control and LPS+TNFa treated groups...151
Figure 6.6 Effect of etomoxir on ketogenic flux in control and LPS+TNFa treated groups...152
Figure 6.7 Data used for the calculation of individual flux control coefficients for CPT I over ketogenic flux in control groups... 153
Figure 6.8 Data used for the calculation of individual flux control coefficients for CPT I over ketogenic flux in LPS+TNFa treated groups...154
Figure 6.9 Effect of etomoxir on CPT I activity in control and LPS+TNFa+IL6 treated groups...156
Figure 6.10 Effect of etomoxir on ketogenic flux in control and LPS+TNFa+IL6 treated groups...157
Figure 6.11 Data used for the calculation of individual flux control coefficients for CPT I over ketogenic flux in control groups... 158
Figure 6.12 Data used for the calculation of individual flux control coefficients for CPT I over ketogenic flux in LPS+TNFa+IL6 treated groups... 159
Figure 6.13 Comparison of flux control coefficients for CPT I over ketogenesis in untreated control, LPS+TNFa- or LPS+TN Fa+1 L6-treated hepatocytes isolated from suckling rats... 165
Figure 7.1 Schematic arrangement of the ATPase, the complexes of the respiratory chain and association of proton pumping... 171
Figure 7.2 Hydroxylation by cytochrome P4 5 0... 175
Figure 7.3 Schematic representation of peroxisomal respiration... 176
Figure 7.4 Summary of total oxygen consumption... 177
Figure 7.5 Total endogenous, non-mitochondrial and/or mitochondrial respiration of isolated hepatocytes from control and LPS+TNFa+1L6 treated groups... 185
Figure 7.6 Total oxygen consumption: Control or LPS+TN Fa+1 L6-exposed cells in absence or presence of salicylic a c id ... 188
Figure 7.7 Comparison of the distribution of oxygen consumption in isolated hepatocytes from (a) control and (b) LPS+TNFa+1L6 treated groups...193
Figure 7.8 Percentage change in total endogenous respiration in hepatocytes...194
Figure 7.9 Changes in the contribution of the non-mitochondrial fraction to total oxygen consumption... 196
Figure 7.10 Comparison of total oxygen consumption in control and LPS+TN Fa+1L6 exposed hepatocytes in response to two different doses of salicylic acid...197
List of abbreviations
List of abbreviations
ACBP acyl-CoA binding protein
APP acute phase proteins
ASP acid soluble products
BSA bovine serum albumin
BUCA bottom-up control analysis
C i or*Ci^ individual or group flux control coefficients respectively
CLP caecal ligation and puncture
<
generalised elasticity coefficient for the effector, X on ETCenzyme/step a
electron transport chain / mitochondrial respiratory chain
ex-pc external palmitoylcamitine
FAD flavin adenine dinucleotide (oxidized form) FADHz flavin adenine dinucleotide (reduced form)
FAT fatty acid translocase
FATP fatty acid transport protein
FABP fatty acid binding protein
FCCP p-trifluoromethoxyphenylhydrazone
i l l interleukin-1
IL6 interleukin-6
J^SP carbon flux to acid soluble products « ketogenic flux in Jt c p
isolated hepatocytes
total carbon flux in isolated hepatocytes
^C02 Krebs cycle flux in isolated hepatocytes
p-oxidation flux in isolated hepatocytes
^ketogenesis carbon flux to ketone bodies (acetoacetate and '/carbon
p-hydroxybutate in isolated mitochondria)
total carbon flux (J a s p + J c o 2) in isolated mitochondria
KRB Krebs Ringer bicarbonate
KRP Krebs Ringer phosphate
LPS lipopolysaccharide
L-CPTI liver isoform CPT 1
M-CPTI muscle isoform CPT 1
MCA metabolic control analysis
MCoA malonyl-CoA
MYX myxothiazol
NEFA non-esterified fatty acids
PCA perchloric acid
P-CoA palmitoyl-CoA
PMF proton motive force
K
generalised response coefficient for effector X on flux JROS reactive oxygen species
RS Reye’s Syndrome
SIDS Sudden Infant Death Syndrome
SIRS systemic inflammatory response syndrome
SGA small-for-gestational-age
TCP total carbon products
TDCA top-down control analysis
TNFa tumour necrosis factor alpha
List of enzymes
List of enzymes
acetoacetyl-CoA thiolase, (E C. 2.3.1.9) acetoacetyl-CoA synthase
acetyl-CoA carboxylase, (E C. 6.4.1.2) acyl-CoA synthases, (E C. 6.2.1.3) carnitine acetyltransferase, (E C. 2.3.1.7) Clostridopeptidase A, type IV, (E.C.3.4.24.3) DNAasel, (E.C.3.1.21.1)
mitochondrial outer membrane carnitine palmitoyltransferase, (E.C.2.3.1.21) mitochondrial inner membrane carnitine
palmitoyltransferase, (E.C.2.3.1.21) 2-enoyl-CoA hydratases, (E C. 4.2.1.17)
3-hydroxybutyrate dehydrogenase, (E C. 1.1.1.30) 3-hydroxyacyl-CoA dehydrogenases, (E C. 1.1.1.35) 3-hydroxy-3-methylglutaryl-CoA synthase, (E.C.4.1.3.5) 3-hydroxy-3-methylglutaryl-CoA lyase, (E C. 4.1.3.4) 3-oxoacid-CoA transferase, (E C. 2.8.3 5)
3-oxoacyl-CoA thiolases, (E C. 2.3.1.9 and E C. 2.3.1.16) Short-; medium-; long- very-long- chain acyl-CoA
dehydrogenases, (E C. 1.3.99.2 and E C. 1.3.99.3) succinate dehydrogenase, (E C. 1.3.5.1)
ACC ACS CAT
collagenase
CPT I CPT II
HMG-CoA synthase HMG-CoA lyase
SDH
Chapter 1 : Literature review and aims
Chapter 1
Literature review and aims
1.1 Introduction
Although the pathways involved in the metabolism of fatty acids are well mapped, the regulation and control of hepatic fatty acid oxidation fluxes under different physiological/clinical situations are poorly understood. In this study, I have investigated control over hepatic fatty acid oxidation and ketogenesis in the suckling rat, in response to different substrates and the clinical condition of sepsis, using the approaches of metabolic control analysis (MCA). In this introduction, I shall briefly consider hepatic fatty acid metabolism, the role of ketone bodies and introduce the central themes of MCA.
1.2 Biochemical perspectives on hepatic fatty acid oxidation, the Krebs cycle and ketogenesis
1.2.1 Plasma free fatty acids and their entry into hepatocytes
Fatty acids may be defined as monocarboxylic acids and are named on the basis of the number of carbon atoms and locus of double bonds. For example, the Cie saturated fatty acid has a systematic name of n-hexadecanoate, since its parent hydrocarbon is hexadecane. The Cie fatty acid with a double bond is known as
cis-A^-hexadecenoate, where the c/s-A® indicates the presence of a double bond between carbons 9 and 10. Fatty acids in paediatric nutrition have been reviewed by Girard (1992) and Giovannini (1995) and are discussed in more detail in relation to neonatal diet in later chapters of this thesis. In summary, in the neonate, medium-chain fatty acids (chain length C e - C i o ) and long-chain fatty acids (chain length C 1 2 - C 2 2 ) are present in variable proportions as the acyl chains of the triacylglycerols in maternal milk. Short-chain (chain length < C 4 ) fatty acids are derived mainly from anaerobic bacterial fermentation of undigested lactose. In addition to providing energy following oxidation, fatty acids (and their derivatives) have many physiological roles. These include, for example, components of phospholipids, lipophilic modifiers of proteins, in the control of cell proliferation and transmembrane signalling. The follovring sections, however, will consider their oxidation as metabolic fuels during the neonatal period.
Chapter 1 : Literature review and aims
is due to increased hydrolysis of triacylglycerol derived either from white adipose tissue or from the absorption of triacylglycerols from maternal milk (Novak et al.,
1964, Persson eta!., 1966; Blazquez ef a/., 1974; Ferré at a!., 1978; Pégorier ef a/., 1981). NEFA are transported between organs as unesterified fatty acids complexed with serum albumin (Spector, 1975) or in the form of triacylglycerols associated with lipoproteins.
Situated in the right upper quadrant of the abdominal cavity and receiving blood from the hepatic portal vein, the liver is the first organ to be exposed to blood from the digestive system. It encounters a wide variety of nutrients, including the fatty acid-serum complexes, in addition to xenobiotics, toxins and gut-derived micro organisms. The liver is involved in a large number of metabolic activities, from the anabolism and catabolism of fats, proteins, carbohydrates and vitamins, to detoxification processes and metabolism of hormones. The work reported here is concerned with the role of the liver in the oxidation of fatty acids and in particular, focuses on fatty acid oxidation in hepatocytes. In its broadest sense, the term hepatocyte refers to all resident liver cells but is most commonly used to refer to liver parenchymal cells and this is the convention used throughout this thesis. Hepatocytes represent approximately 60-65% of all liver cells by number but, owing to their large size, they occupy approximately 80-90% of the volume of the organ (reviewed in Berry, 1991). The non-parenchymal cells consist of 25-30% Kupffer cells, 10% endothelial cells, while the fat storing cells form less than 5% of the remaining liver cells.
Circulating triacylglycerols are hydrolysed outside cells by lipoprotein lipase bound to the capillary endothelium to yield free fatty acids. The mechanisms involved in the transport of long-chain fatty acids (LCFA) across biological membranes are still poorly understood, however, at low concentrations, LCFA enter cells by a carrier mechanism (Weisiger ef a/., 1981; O ckneref a/., 1983). Relatively recently, several fatty acid transport proteins (FATPs) and a fatty acid translocase (FAT) have been identified (reviewed in Memon at a i, 1999). At higher concentrations, LCFA may cross the plasma membrane by direct diffusion (Zammit, 1984; Schulz, 1991; Guzman at a!., 1993). Once inside cells, LCFA can be bound to fatty acid binding proteins (FABP) within the cytosol (Glatz at a i, 1985; Clarke at a i, 1989). These small soluble proteins, between 14-16kDa (Færgeman at a i, 1997) facilitate the diffusion of fatty acids through the aqueous medium of the cytosol to membrane-bound enzymes (acyl-CoA binding proteins). This is believed to help protect the cell
Chapter 1 : Literature review and aims
from the adverse detergent effects of fatty acids (Ockner et al., 1992). During the fetal-neonatal transition, both the expression and content of liver FABP Increase markedly (Gordon eta!., 1985; Paulussen eta!., 1986,1989).
1.2.2 Formation of acyl-CoA esters
Inside the cell, LCFA (e.g. C#, Cie and Cie) are converted to their corresponding CoA-esters by long-chain acyl-CoA synthases (Ic-ACS, EC 6.2.1.3). Mitochondria, microsomes, endoplasmic reticulum and peroxisomes all contain membrane bound ATP-dependent Ic-ACS activity (Shindo at a!., 1978; Krisans at a!., 1980; Singh at a!., 1985). The mitochondrial enzyme forms an integral part of the outer membrane, with its CoA-binding site exposed to the cytosol (Hesler at a!., 1990). The activity of Ic-ACS increases following birth (Warshaw at a!., 1972; Foster at a!., 1976; Chalk at a!., 1983).
The long-chain fatty acid activation process occurs in two-steps (Scheme 1.1): (i) the first step (Scheme 1.1(a)) involves the reaction of the fatty acid with ATP
forming an acyl adenylate and releasing pyrophosphate,
/
Î
R C + ATP ^ R— C AMP + PPi
\ .
O
fatty a c id acyl a d e n y la te
Scheme 1.1 (a)
(ii) in the second step (Scheme 1.1(b)), the sulfhydryl group of CoA reacts with the acyl adenylate to form acyl-CoA and AMP.
o
o
R — C --- AMP + H S ---CoA - R— C — S --- CoA + AMP
acyl adenylate acyl-CoA
Chapter 1 : Literature review and aims
Whilst these partial reactions are readily reversible, the reaction is pulled forward since pyrophosphate is rapidly hydrolysed in a reaction catalysed by a pyrophosphatase.
The accumulation of acyl-CoA esters would have deleterious effects on cellular structures, for example, due to interactions with mitochondrial membranes (Shug et al., 1971). This build up is prevented by the action of acyl-CoA binding protein (ACBP), which is present in concentrations near-equimolar with those of acyl-CoA within the liver cytosol (Rasmussen at a!., 1993). ACBP binds medium- and long-chain acyl-CoA esters with very high affinity, but shows only low affinity for CoA and does not bind fatty acids, acyl-camitines or cholesterol (Færgeman et al., 1997). Since this protein sequesters long-chain acyl-CoA esters, it also has the effect of removing product inhibition of the Ic-ACS synthases (Pande, 1973). Additionally, Bhuiyan et al., (1994) has shown that acyl-CoA esters are also able to bind with FABP.
Following activation, there are several possible fates for the fatty acids, which can for example, be incorporated into phospholipids and triacylglycerols or undergo desaturation and chain elongation in the endoplasmic reticulum. Alternatively, activated long-chain fatty acids may undergo the reactions of /9-oxidation within peroxisomes or mitochondria (reviewed in Bremer ef a/., 1984).
1.2.3 Site of /9-oxidation: mitochondria versus peroxisomes
Fatty acid oxidation occurs within mitochondria and peroxisomes (Lazarow et al.,
1976). The studies reported and discussed in this thesis, were concerned primarily with mitochondrial-based processes. There are several justifications for this, firstly, despite an increase in the number of peroxisomes and in the activities of specific enzymes during the fetal/neonatal transition, the non-mitochondrial contribution to overall /9-oxidation is less than 15% in both neonatal and adult rats (Mannaerts et al., 1979; Krahling et al., 1979; Horie et al., 1981; Duée et al., 1985). Secondly, although the volume of individual mitochondria decreases by 30-50% in the early neonatal period (Rohr et al., 1971; Valcarce et al., 1988), there is a substantial increase in the number of mitochondria per hepatocyte (Rohr et al., 1971; Herzfeld
Chapter 1 ; Literature review and aims
during the first hours of extra-uterine life, pre-existing mitochondria demonstrate an increase in functional capacity brought about, at least in part, by an increase in the concentration of FrATPase, which is needed for efficient coupling between respiration and oxidative phosphorylation (Valcarce et al., 1988). Finally, mitochondria are the primary site of oxidation of short-, medium- and long-chain fatty acids. Very-long chain fatty acids (>0 2 2) and frans-fatty acids are preferentially
oxidized in hepatic peroxisomes (Vandenbosch at a!., 1992; Guzman eta!., 1999). Thus the major physiological substrates, such as Ci6:o are oxidized mainly in mitochondria, both in the absence and in the presence of peroxisome proliferation (Skorin eta!., 1992).
In addition to their role in the breakdown of very-long chain fatty acids, peroxisomes can degrade a variety of other lipophilic carboxylates and physiological substrates include polyunsaturated fatty acids, dicarboxylic fatty acids, pristanic acid, bile acid intermediates and certain xenobiotics (van Veldhoven at a!., 1999). It has also been established that peroxisomes are involved in the biosynthesis of cholesterol and other isoprenoids (Wanders, 1999).
1.2.4 Entry into mitochondria
The mitochondrial membranes act as a barrier to long-chain CoA-esters, which are transported across the membranes in a three-step system comprising:
(i) mitochondrial outer membrane carnitine palmitoyltransferase (CPT I); (ii) acyl-carnitine/camitine translocase; and
(iii) mitochondrial inner membrane carnitine palmitoyltransferase (CPT II). Medium- and short-chain fatty acids (<Cio) are thought to be metabolised independently of this three-step system, crossing the mitochondrial membranes independently of CPT I (Smith at a!., 1968; McGarry at a!., 1980; Bremer at a!.,
1984). They are activated to CoA esters by medium- or short-chain acyl-CoA synthases located in the mitochondrial matrix (Killenberg at a i, 1971).
Historically, there has been some controversy regarding the topographical, functional and regulatory relationships between the different components of the long-chain fatty acid transport system. However, many of the questions on this transport system have now been resolved, (recently reviewed in McGarry at a i,
Chapter 1 : Literature review and aims
(i) The initial step in this transport system, which is catalysed by CPT I (E.G. 2.3.1.21), generates free CoA and extra-mitochondrial acyl-camitines (Scheme 1.2). The formation of the acyl-camitines is the first committed step of mitochondrial
p-oxidation.
O ÇH3 H o
II
L
I
R— C — S ---CoA 4" HgC N CHg C CHg C^^
O
C H3 OH
acyl-C oA carnitine
Ç H3 H o
I.
I
H S C o A + H3C N C H o C C H ., C
I
I
I I O
CH3 o
c = o
R
acyl-carnitine
Scheme 1.2 Formation of acyl-camitine esters
It has recently been found that CPT I also recognises acyl-CoA-ACBP complexes and acyl-CoA substrates bound to FABP, rather than only the free acyl-CoAs as their substrate (Bhuiyan eta!., 1994; Abo-Hashema et a i, 1999).
Chapter 1 : Literature review and aims
mitochondrial membranes are brought into close proximity. Zammit (1999) suggests that the increase in density of CPT I at contact sites may reflect the importance of acyl-camitine transfer in the energetics of mitochondria.
Different isoforms of CPT I have been identified in the rat. The L isoform (L-CPT I) is the major form expressed in liver, kidney, pancreatic islets, ovary, spleen, intestine and brain (McGarry et al., 1997), whilst the M isoform (M-CPT I) is expressed in cardiac and skeletal muscle and adipose tissue (Yamazaki et a!.,
1995), although there may be some inter-species variation (Kolodziej et a!., 1992; McGarry et a!., 1997; Zammit, 1999). Additionally, tissue distribution of isoforms may change with development. For example, whilst both L-CPT I and M-CPT I are present in neonatal and adult rat heart mitochondria, in the late fetal/neonatal period, L-CPT I levels are higher than at later stages of development (McGarry et a!., 1997). This is potentially important, since although the two CPT I isoforms catalyse identical reactions, they differ in their Michaelis constant for the substrate carnitine (y^hydroxy-y-trimethylaminobutyric acid) and in sensitivity to malonyl-CoA (McGarry et a!., 1997). A change in the ratios of the different isoforms, therefore, provides a potential means of regulation of the system at different stages of development.
Carnitine, a zwitterionic compound, can be synthesised in human liver and kidney from trimethyllysine derived from the essential amino acids lysine and methionine (Rebouche et a!., 1980). Neonates and particularly preterm infants, however, have low synthetic capabilities and are dependent on exogenous sources, such as maternal milk (Linz et a!., 1995). In the liver of suckling rats, the concentration of carnitine increases rapidly after birth (Ferré eta!., 1978) due to increased transfer of carnitine from the mothers milk to the pups (Robles-Valdes et a!., 1976). After 20 days of lactation, milk still provides almost half of the total camitine in neonatal rats (Davis, 1989). The apparent for camitine is dependent on the palmitoyl-CoA concentration, since, as well as being a substrate, palmitoyl-CoA acts as a competitive inhibitor to camitine, the second substrate for CPT I (Bremer et a!.,
1967(a)(b)).
Chapter 1 : Literature review and aims
whereas (3-gene products (encoding M-CPT I) predominate in skeletal muscle, adipose tissue, heart and testis (Yu et al., 1998). In addition, there are also splice variants for M-CPT I (Yu eta!., 1998).
It is now known that L-CPT I consists of a single polypeptide of Mr 88,150 (Esser at a!., 1993(a)(b)) containing both the catalytic and regulatory domains and adopts a “hair-pin” topology within the mitochondrial outer membrane (Kolodziej at a!., 1993; Fraser at a i, 1997). Both the short (%47-residue) N-terminal domain and the longer («650-residue) C-domain are exposed on the cytosolic side of the membrane (Frazer at a!., 1997). Two transmembrane domains “anchor” the molecule within the membrane, whilst a linker region between the transmembrane domains protrudes into the inner membrane space (Jackson at a!., 1999). This topology is illustrated in Figure 1.1, which also summarises the components of the three-step long-chain fatty acid transport system. Interestingly, one of the products from the splice variants mentioned previously, is predicted to have radically different membrane topology (Zammit, 1999) and altered malonyl-CoA regulatory domains (Yu at a!.,
1998). Potentially, therefore, proteins translated from the splice variants may provide further regulation and control of the system, although the physiological significance is yet to be established.
Both the catalytic and malonyl-CoA binding sites are believed to reside in the C-domain of CPT I (Zammit at a i, 1997). However, since both the N- and C-domains are exposed on the outer face of the outer mitochondrial membrane (Fraser at a i,
1997), in addition to interacting with the cytosolic pool of long-chain acyl-CoA/ACBP and malonyl-CoA (Van der Leij at a i, 1999), the two domains are also able to interact with each other (Zammit at a i, 1997) subject to the constraints imposed by the linker region and transmembrane domains. The two transmembrane domains are themselves able to interact (Shai at a i, 1995).
The N-terminal domain in particular, is essential for the maintenance of an optimal conformation for both catalytic function and malonyl-CoA sensitivity and binding (Cohen at a i, 1998; Shi at a i, 1998). Furthermore, Swanson at a i, (1998) have proposed that the differences in the kinetics of the two isoforms of CPT I are determined by the nature of the interaction between the N- and C-terminal regions. Additionally, it has recently been demonstrated that the N-terminal residues critical for activity and malonyl-CoA sensitivity in M-CPT I are different from those of L-CPT I (Shi at a i, 2000)
(a)
A C B Pfatty acyl-C o A C P T I
cytoplasm
C o A S H
fatty acid
acyl-C o A synthase outer mitochondrial membrane inter membrane space
B acyl-carnitine
acetyl-carnitine carnitine
translocase
inner mitochondrial membrane
C A ‘ C P T
p-oxidation acetyl-C oA
-4-Krebs c y c l^
HM G -C oA cycle
Co A S H acyl-C oA
C O . ketone bodies
mitochondrial matrix
(b )
O M M
T M D 2 TMD1
Figure 1.1 (b) Key:
O M M (outer mitochondrial m em brane) N (N-term inal domain, N H2)
C (C-term inal domain, C O O ) TM D 1 (transm em brane dom ain 1) T M D 2 (transm em brane dom ain 2) L (linker region protruding into interm em brane space)
Figure 1.1 Schematic representation of long-chain fatty acid activation, transport and oxidation
Figure (a) A; long-chain fatty acids are activated by long-chain acyl-CoA synthases located in the outer mitochondrial m em brane. B: transport of the resulting CoA -esters across mitochondrial m em branes occurs via the three-step system, comprising C P T I (1), the acyl-carnitine/carnitine exchange carrier (2) and C P T II (3). C: fatty acid oxidation, Krebs cycle and H M G -C o A cycle. Carnitine acyltransferase (C A T ), which acts with acetyl-CoA as substrate, is also shown on this figure.
Figure (b) T he “hair-pin” topology of C P T I (discussed in the main text) is emphasised in this scheme.
Chapter 1 : Literature review and aims
As already noted, malonyi-CoA, the product of the reaction catalysed by acetyl-CoA carboxylase (ACC, EC 6.4.1.2) which commits cytosolic acetyl-CoA to the synthesis of fatty acids, interacts with CPT I. Malonyl-CoA is a potent, physiological reversible inhibitor of CPT I (McGarry et a i, 1977; Saggerson et a i, 1981(a),(b),(c)). However, the malonyl-CoA/CPT I interaction is complex, since both the inhibitory effects of malonyl-CoA (Kashfi et a i, 1988; Kolodziej et a i, 1990) and sensitivity of CPT I to this inhibitor (Cook et a i, 1980; Robinson et a i, 1982; Zammit et a i, 1984; Herbin et a i, 1987) may be altered in response to certain (patho)physiological conditions. Zammit and co-workers (1990, 1998) have suggested that alterations in malonyl-CoA sensitivity may arise through changes in the interaction of the transmembrane domains with the membrane lipids as well as between the domains themselves.
Cook et a i, (1980) proposed that variations in the concentration of malonyl-CoA provide a potential method of co-ordinating the opposing pathways of fatty acid synthesis and fatty acid oxidation and prevent the potential futile cycling of oxidation of newly synthesised fatty acids. For example, during episodes of high carbohydrate feeding, circulating glucose levels are high, while non-esterified fatty acid levels are low. Under such conditions, i.e. high insulin to glucagon ratios and higher citrate efflux, mechanisms exist which raise the tissue concentration of malonyl-CoA. Citrate, for example, is cleaved by ATP-citrate lyase, forming acetyl-CoA, which may be used to form malonyl-CoA. Additionally, citrate is an allosteric activator of ACC, which would also result in raised concentration of malonyl-CoA. Under such conditions, CPT I itself becomes more sensitive to malonyl-CoA inhibition (Ontko et a i, 1980). Thus, under conditions where glucose is readily available, CPT I is inhibited, the rate of fatty acid oxidation is lowered and the liver switches to fatty acid biosynthesis. It is interesting, however, to consider this within the context of metabolic control analysis (MCA, Section 1.4) and specifically top down regulation analysis, which can be used to derive response coefficients that quantify the response of a system to an effector. The mechanism described here assumes a large and negative response coefficient for malonyl-CoA over fatty acid oxidation, — ^mcLi ■ Since response coefficients may be defined as the product of
a flux control coefficient and an elasticity, this in turn would imply a large value for the flux control coefficient for CPT I over fatty acid oxidation, , and a large
cpn
and negative elasticity for malonyl-CoA over CPT I, — ^mcoa ■ As discussed in later sections of this introduction, large flux control coefficients are rare.
Chapter 1 ; Literature review and aims
In states of low insulin to glucagon ratios, such as during starvation or uncontrolled diabetes, gluconeogenesis has been shown to be stimulated in perfused liver (Heimberg et al., 1969) and in isolated hepatocytes (Christiansen, 1977). Under such conditions, ACC is phosphorylated by AMP-dependent kinase to its inactive form (Hardie et al., 1992). ACC, which is located in the cytoplasm, also requires a hydroxytricarboxylic acid activator such as citrate or isocitrate for its catalytic activity (Matsuhashi et a i, 1962,1964). Thus, the concentration of malonyl-CoA falls due to both slower efflux of citrate from the mitochondrion and to the inactivation of ACC. Additionally, CRT I is desensitised to the inhibitor, fatty acids are oxidized and there is an acceleration in ketone body production (McGarry et a i, 1989). The rise in glucagon also de-inhibits mitochondrial 3-hydroxy-3-methylglutaryl-CoA (mHMG-CoA) synthase and increases the expression of enzymes involved in the HMG-CoA cycle. This also results in an increase in ketone body production. Again, considered in the context of control analysis, this suggests that there are multiple steps involved in the control of ketogenic flux, rather than a single step/enzyme.
The activity of CRT I can also be inhibited through interaction with CoA esters of synthetic substrate analogues that contain a 2-oxirane ring moiety, for example, etomoxir (ethyl-2-[6-(4-chlorophenoxy)hexyl]oxirane-2-carboxylate), which binds to the C-domain in both L- and M-isoforms (Swanson et a i, 1998). This agent has been used to manipulate CRT I activity in the studies reported and discussed in this thesis. Etomoxir is converted in situ to etomoxir-CoA, an irreversible inhibitor of CRT I and it has been demonstrated that the R-enantiomer of etomoxir is esterified to its CoA-ester more readily than the S-enantiomer (Agius et a i, 1991(a)). Inhibition of CRT I is enantiomer specific, with only the R-enantiomer of etomoxir, a potent hypoglycaemic compound, inhibiting fatty acid oxidation in hepatocytes (Agius et a i, 1991(b)).
(ii) The second step in the transport of CoA esters across mitochondrial membranes involves an acyl-camitine/camitine translocase, situated in the inner mitochondrial membrane (Ramsay et a i, 1975; Rande, 1975; Indiveri et a i, 1990; Sherratt et a i, 1994, Ramsay et a i, 1994). The relationship of this translocase with the other steps in the transport system is illustrated in Figure 1.1. This translocase returns carnitine to the cytosolic side, in exchange for an incoming acyl-camitine. In addition to its translocase activity, the carnitine acyl-camitine translocase also has the capacity for slow unidirectional carnitine transport (Ramsay et a i, 1976; Rande
Chapter 1 : Literature review and aims
The Km for external carnitine is approximately 0.5-1.5mM, the same range as the concentration of carnitine in the tissue, and is lower for acyl-camitines (Idell-Wenger, 1981) indicating that acyl-camitines are preferentially transported into mitochondria. In addition, the Km decreases with the chain-length of the fatty acid. The rate of exchange depends on the intramitochondrial concentration of carnitine (reviewed in Bremer et al., 1984). However, chain-shortened carnitine esters can accumulate extramitochondrially (Eaton eta!., 1999(a)).
The acyl-camitine/camitine exchange carrier is similar, both in size (apparent molecular mass of 32.5kDa, Indiveri at a!., 1990) and in sequence, to other mitochondrial carrier proteins that transfer substrates between the cytosol and the mitochondrial matrix (Palmier! at a!., 1996). It is enriched within the contact sites of mitochondria, although to a lesser extent than CRT I and CRT II (Fraser at a!.,
1998). The exchange activity of the translocase is strongly influenced by cardiolipin, a phospholipid specific to the mitochondrial membrane (Noel at a!., 1986; Indiveri at a!., 1991).
(iii) The final step in the CoA-ester transport system involves CRT II, which is loosely associated with the inner face of the inner membrane (Woeltje at a!., 1987) and particularly the contact sites between inner membrane cristae and outer membranes in liver mitochondria (Fraser at a!., 1998). In this final step, acyl-camitines are reconverted back to acyl-CoA esters by CRT II. These acyl-CoA esters may then undergo /9-oxidation, the camitine being retumed as described previously. Since the mitochondrial CoA pool is limited (approximately 3-5mM) depletion of free CoASH will inhibit CRT II and it has been suggested that /9-oxidation flux may be partially controlled by either lack of intramitochondrial CoASH or an elevated [acetyl-CoA]/[CoA] ratio (reviewed in Eaton at a!., 1999(b)).
The relationship of CRT II to the other components of this transport system is illustrated in Figure 1.1. Since its active site faces the matrix space (McGarry at a!.,
1992), CRT II is not accessible to cytosolic acyl-CoA esters in intact mitochondria (Fraser at a!., 1998). It is also insensitive to malonyl-CoA (McGarry at a!., 1978; Declercq at a!., 1987). CRT II has a Mr of approximately 69,000 (Kolodziej at a i,
Chapter 1 : Literature review and aims
immunlogically indistinguishable product, which implies that, unlike OPT I, OPT II appears not to have tissue specific isoforms (Woeltje et al., 1990; McGarry et al.,
1991). Others, however, have found evidence which suggests that although OPT II in all rat tissues may be of approximately the same Mr there may actually be immunologically distinct isoforms in different tissues (Kolodziej et a i, 1992).
Defects have been reported for each of the stages of transport of fatty acids into mitochondria, recently reviewed by Bonnefont et a i, (1999) and Brivet et a i, (1999). In brief, for OPT I deficiencies, only defects of L-CPT I have been documented. These are characterized by recurrent episodes of Reye’s-like Syndrome (considered in more detail in Chapter 7). Severe muscular and cardiac problems are associated with episodes of fasting hypoglycaemia in defects of camitine transport and translocase. OPT II deficiency has several clinical presentations. In adults, OPT II deficiency presents as exercise intolerance, whilst the infantile-type OPT II deficiency presents as severe attacks of hypoketotic hypoglycemia, occasionally associated with cardiac damage commonly responsible for sudden death before one year of age (Bonnefont et a i, 1996; Wieser et a i, 1999). Brain and kidney dysorganogenesis are frequently seen in the neonatal-onset OPT II deficiency and are usually fatal early in life.
1.2.5 The reactions of mitochondrial /^oxidation
Acyl-CoA molecules are progressively degraded by the reactions of the y3-oxidation spiral. Each turn through the spiral produces two-carbon fragments of acetyl-CoA, while the parent acyl-CoAs are progressively shortened and undergo further /9-oxidation (Knoop, 1905). The series of four types of enzyme-catalysed reactions, with multiple enzymes, each specific for different fatty acid chain-lengths, for each of the steps, is summarised in Scheme 1.3.
The first reaction in each round of degradation is the oxidation of acyl-CoA. This step is catalysed by short-; medium-; long- and very-long-chain acyl-CoA dehydrogenases (EC 1.3.99.2 and EC 1.3.99.3), which are active with fatty acids of chain lengths C4 and Ce; C4 to C12; Ce to C20 and C12 to C22 respectively. The