3607
The Use Of Geostatistics In Setting The Spread Of
Claystone In Coal Mines
Irfan Marwanza, Masagus Ahmad Azizi, Chairul Nas, Claudia Intan Permatasari, Wiwik Dahani, Subandrio
Abstract: One impotant factor of the mine slope landslide in coal mines is rock mass characteristics, such as cohesion value (c) and inner friction angle (ϕ). These parameters play an important role in the slope stability design and the technical design of a mine pit. This study therefore aimed to estimate the distribution of claystone characteristics towards coal mining plan pits, in accordance with decision-making of slope stability and technical design of rock openings. Data were analyzed using the geostatistical with the variogram and kriging method. The estimation method for claystone dispersion characteristics was carried out by analyzing the cohesion (c) and the inner friction angle (ϕ) using scanline. However, the non-sample or non-scanline claystone is estimated by geostatistics method. Furthermore, the cohesion (c) and friction angles (ϕ) of claystone mass were estimated from the color gradient in the contour map. This map is considered when determining the right location to make a valid geotechnical cross-section. Based on the estimation, claystone in low wall part has a greater cohesion value (c) and inner friction angle (ϕ) than the high wall.
Index Terms: Geotechnical cross-section, claystone, cohesion, friction angle, geostatistics, variogram, kriging
————————————————————
1.
INTRODUCTION
Coal mines in Indonesia are generally used open-pit techniqique, often experience slope landslides therefore, it is essential to determine its stability. In the analysis, several variables affect slope stability, such as rock mass characterization in the form of cohesion values (c) and the inner friction angle (ϕ). The use of both models as a retaining force, this means that the greater their values, the higher the resistive force on the slope [1], [2], [3]. One of the most widely used criteria for estimating rock mass properties was proposed by Hoek and Brown (1997). Cohesion values (c) and inner friction angle (ϕ) are obtained from rock mass characterization by taking into account the heterogeneous technical properties of the discontinuity. Discontinuity has heterogeneous and uneven distribution which produce differences cohesion values (c) and deep friction angles (ϕ) in mining area. In connection with these differences, it is necessary to determine the overall distribution both values, which are the basis for pit design. The right estimation technique is needed to produce an interpretation of their distribution. Regarding the difference in the value of each mine, this study uses the geostatistical method as an estimation technique. The geostatistical approach is increasingly being used in geotechnical projects, and analyzed in accordance with the risk and security [ 4 ] . Geostatistics is one of the estimated methods capable of spatial modeling by correlating non-sampled and sampled variables. Furthermore, it has the ability to identify and estimate the spread of relationships between rocks”[5], [6]”. The kriging method is often used in geotechnical engineering, especially in modeling spatial variability of rock properties [7], [8], [9], [10], [11], [12], [13]. However, the geotechnical cross-section is located in the slope stability analysis process is based on estimates and the data distribution of cohesion (c) and friction angle (ϕ). The mapping of rock properties therefore requires geostatistical analysis such as variogram and kriging to facilitate the placement of geotechnical cross-sections. This study therefore aims to describe the function of the kriging technique in determining the distribution of claystone masses.
Rock Mass
Rock Mass consists of blocks and fragments separated by discontinuity, with each identified as an interdependent unit [14]. According to Bieniawski (1973), a discontinuity plays an
important role in determining the rock mass classification. Therefore, its conditions need to be known correctly through the rock mass characterization. Classification is generally carried out through the mechanical and physical properties. It is used to represent the characteristics (strength) and degree of weathering. However, its characteristic is related to joint geometry and scanline. Direct observation in discontinuity fields includes:
a. Joint orientation, which is divided into two parts, namely, dips direction and dip.
b. Joint space which is the perpendicular distance between joints along the measurement line (scanline). c. Joint conditions are obtained through direct
observation. It consists of continuity, the width of joint opening, fill material, weathering level, and discharge of groundwater at the joint.
Slope stability
In open-pit activities, stability is one of the determinants of production and security. Slope stability is influenced by retaining and driving forces. A slope is called a safe or stable assuming its retaining force is greater than the driving force, which consists of dynamic load force, slope gravity, pore pressure, and other disturbances. Conversely, retaining force consists of cohesion (c) and inner friction angle (ϕ). Force diagram acting on the system as shown in figure 1 below. (See figure 1.1)
Figure 1.1 Simple security factors [15]
probability of an avalanche on the slope. Cohesion (c) is a tensile strength between rocks particles expressed in units of weight per area. Inner friction angle (ϕ) is a value that describes the strength of friction between rock-forming particles. The cohesion value (c) of rock is directly proportional to the inner friction angle (ϕ) and the greater their values, the stronger the rock in accepting the load or force.
Geostatistics
Spatial statistics consists of quantitative analysis such as statistical dependencies, accuracy, and uncertainty. While geostatistics is a combination of math and statistics developed in mining and geology. In general, it is used in the processing and analyzing spatial data in accordance with the interpolation of spatially distributed data. Geostatistical methods are generally used to analyze the characteristics of mineral deposits using spatial statistics, which is the development of descriptive statistical theories applied in mining/geotechnics and classical [16]. Geotechnical engineering is the same as estimated reserves with heterogeneous and point-to-point rock mass properties [ 17 ]. To determine the spatial relationship among points, the structural function that is reflected by the semivariogram model is must be known. Geostatistical calculations are started with the use of semivariogram and kriging calculations.
Experimental Variogram
Experimental Variogram is the result of spatial statistical analysis obtained from observations or measurements based on the following calculations:
ϒ (h) = (1)
Description:
ϒ (h) = Variogram value with gap h N = Number of pairs
h = Gap between data I = Data sequence
In general, there are several basic variogram models used in modeling experimental variogram results [18], such as:
Model of Nugget Effect
(2)
Model of Spherical
(3)
Model of Exponential
(4)
Model of Gaussian
(5)
The figure 1.2 below shows an experimental variogram with a variogram model fitted to it.
Figure 1. 2 Variogram Model[19]
The variogram or semivariogram model produces three parameters (Nugget Effect, Sill, range) used in kriging, such as Nugget Effect, a non-continuous center variogram for vertical lines that jump to the value 0 with the smallest distance separation. Sill is a stable period of variogram which reaches a range, where the variation does not increase. Range is the distance between the variogram and the sill value [ 20 ], [ 21 ] (See figure 1.2 and 1.3) These three parameters can be practically seen in the following figure 1.3.
Figure 1.3 Sill, Range dan Nugget Effect [19]
Kriging
Kriging is synonymous with optimal predictions. This method was developed in the 60s/70s and has been recognized as a good spatial interpolator. [22]. It has an interpolator that 1) is linear and not biased, 2) contains minimal estimation errors, and 3) is right and gives an evaluation of uncertainty for the interpolated values[23]. This method is widely used in the fields of mining, geochemistry, remote sensing, etc. In general, kriging estimates and interpolates non-sampled data points while taking into account the spatial relationship between the data points by minimizing the value of estimated results [24], [25], [26], [27], [28], [29]. Geoff Bohling (2005) defined the kriging estimator as a linear regression Ź (u) as follows:
Ź (u) – m (u) = (6)
Description:
U = estimation location vector
uα = one of the adjacent data locations
m(u) = Expectation of value from Z(u) m(uα) = Expectation of value from Z(uα) 𝜆α(u) = Weighting in determining distance
3609 n = Amount of estimated data
2.
RESEARCH
AND
METHODOLOGY
2.1 Research design
This is a qualitative study that utilizes a geostatistical approach to obtain the spread of claystone in coal mines. Quantitative study refers to a set of processes by which numerical data is analyzed.
2.2. Subject Characteristic
Rock samples used in this study are claystone (overburden) with the location selected in the coal mine of PT. Bukit Asam, South Sumatra. Coordinates of the research area103o 45’ 00’’ BT – 103o
50’ 10’’ BT dan 3o
42’ 30’’ LS – 3o
47’ 30’’ LS. Methodology for spatial statistics is typically found in probability theory, stochastic, and mathematical statistics as well as in information science [30], [31].
2.3 Types and Data Collection Proscess
This paper presents a methodology developed to model the geomechanical parameters (cohession and friction angle) of claystone rock masses. The methodology starts with a probabilistic technique and a geostatistical simulation. The research data is secondary data from rock mass characterization carried out by other researchers at Pit 3 East Banko Barat PT. Bukit Asam, Tbk. To apply this methodology it is necessary, in a first step, to collate all available geotechnical data, such as cohesion values (c) and the inner friction angle (ϕ) of claystone mass.
2.4 Data Processing
Data processing is carried out through two stages, namely, the first stage is carried out statistical analysis and in the second stage spatial analysis is carried out. Statistical analysis was conducted to determine the nature of the characteristics of the data used, while spatial analysis was conducted to see the relationship between research data based on the distance between the research data. In this study, both stages were aided by MATLAB software and surfer software. MATLAB can be used to perform basic statistical tasks. When working with descriptive statistics, mathematics quantitatively describes the characteristics of data collection, such as the largest and smallest values, variance skewness, coefficients of variation and averages. This form of statistics is usually used to summarize data, making it easier to understand[ 32 ]. Geostatistical Simulation Prior to simulation, it is important to model the spatial correlation structure of the data through a variogram.[4]. Some parameters measured in continuous or discrete scales using the following steps:
1. Primarily, the data are analysed and basic statistics are calculated
2. For each variable of interest, the data are transformed into data with a standard Gaussian distribution
3. The experimental variograms are computed, including the isotropy and anisotropy, of the transformed parameters is determined. This stage is followed by model fitting.
4. Kriging analysis
The main idea in this method is to create a kriging model to approach the deterministic numerical model, and then evaluate the probability of failure based on the kriging model.
2.5 Data interpretation and Analysis
Data interpretation refers to the implementation of processes through which data is reviewed for the purpose of arriving at an informed conclusion. Analysis refers to the study of relationships between various parts of the whole and the overall analysis method, including analysis of the results of descriptive statistical tests, analysis of the results of the variogram model and analysis of the results of kriging. Furthermore, analysis of the spread of claystone in map.
3.
RESULTS
AND
DISCUSSION
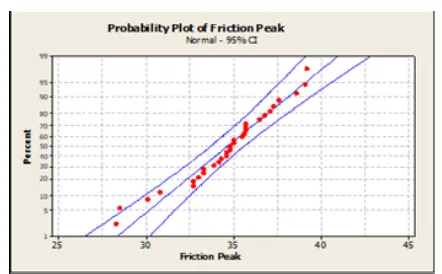
3.1 Normality Test and Analysis of Descriptive Statistics The normality test is carried out to determine the data test on the probability plot graph by looking at the spread against the normal diagonal line. [33], [34].The probability plot results of cohesion values (c) and inner friction angle (ϕ) of claystone masses show that visually, the two data sets are considered normally distributed. Figure 3.1 and 3.2 below shows that a normal probability plot of the Sepal Length variable.
Figure 3.1: Probability Results of Claystone Cohesion Plot
(c)
Figure 3.2: Probability Plot of Inner friction angle (ϕ) of Claystone
TABLE 3.1 ESSENTIAL NUMERACY RESULTS IN CLAYSTONE COHESION (C)
COHESION (Kpa)
FRICTION (Deg)
DISTRIBUTION Lognormal Normal
RANGE 102.7 10.9
MEAN 45.81 34.65
VARIANS 695.388 7.32
SKEWNESS 0.66 -0.16
STD 26.370 1.706
COV (%) 57.56 7.8
The results of the essential cohesion (c) and inner friction angle (ϕ) claystone mass indicate that the two data are not normally distributed. This can be seen from the skewness value, which indicates a bias in each data. The cohesion value (c) is bias towards a small set of values due to its positive skewness value, while the inner friction angle (ϕ) is biased towards large values because it has a negative skewness value. In addition, the essential numeracy results also show that the variability of the cohesion value (c) is higher than the value of the inner friction angle (ϕ). This is seen from the coefficient of variation produced.
3.2 Experimental Variogram
Based on the direction of data distribution, several parameters used in forming the experimental variogram for each data are as follows:
1. Max Lag Distance : 700 2. Number of Lag : 70
3. Lag : 10
4. Direction : 135 5. Tolerance : 45
Experimental Variograms Claystone Cohesion (c) shown in Figures 3.3.
Figure 3.3 Experimental Variogram and Variogram Model for
Claystone Cohesion (c)
The above parameters apply to cohesion values (c) and inner friction angle (ϕ) claystone masses. Based on the above parameters, the experimental variogram and model used for cohesion (c) and inner friction angle (ϕ) claystone masses are as follows:
1. Sill (C0) : 650 (C0 + C) 2. Range ( C ) : 350
3. Nugget Effect (NE): 50
The results of the experimental variogram model fitting for cohesion (c) and inner friction angle (ϕ) claystone values above show that the Gaussian is the right model for both data. (See figure 3.4). The ordinary kriging is most widely used and often success [35], [36]. The experimental Variograms for Claystone friction angle (ϕ) shown in Figures 3.3.
Figure 3.4 Experimental Variogram and Variogram Model for
friction angle (ϕ)
3.3 Estimation by ordinary kriging method
The estimation results of the pit mining area of the Pit 3 East Banko West plan are described in the form of a contour map, where the value is obtained from the color gradient. Purple denotes the lowest estimated value, while white denotes the highest. Based on the parameters of the variogram model, the highest estimated cohesion value (c) of the claystone is 120 Kpa, while the lowest is 10 Kpa. In addition, the highest estimated value for the inner friction angle (ϕ) claystone is 37 deg, while the lowest is 31.4 deg. Figures 3.5 and 3.6 below are contour estimation maps of the cohesion value (c) and friction angle (ϕ) of the claystone mass of the kriging analysis.
3611 Figure 3.6 Estimation of Claystone Inner friction angle (ϕ) of
Kriging Block
The estimated results of the distributed cohesion values (c) and inner friction angle (ϕ) of the claystone shows that the cohesion between the low wall section and inner friction angle values are relatively greater than the value of the high wall section. The shear strength of cohesion (c) and the inner friction angle (ϕ) are directly proportional to the mass. This means that the greater the cohesion (c) and inner friction angle (ϕ), the greater the strength of the rock mass. Based on the spread values of the two rock layers, it is known that the claystone is relatively stronger than the high wall.
4.
CONCLUSION
The results of the estimated analysis of the distribution of cohesion values (c) and inner friction angle (ϕ) claystone layers at Pit 3 East Banko Barat, and PT. Bukit Asam coal, were carried out using the kriging method. It shows that the mass strength of the high wall is lower than the claystone as seen from the greater value of the cohesion (c) and inner friction angle (ϕ) of the low wall.
ACKNOWLEDGMENTS
This research was supported by the Mining Engineering Department, Faculty of Earth and Energy Technology, Universitas Trisakti, Jakarta, Indonesia Thanks are expressed to PT. Bukit Asam, Persero, TBK for provision of the coal samples and other data and for permission to conduct the investigation. Thanks also to the International Conference of Science, Education and Humanities (ICSEH) 2019 and IJSTR so that this paper can be published.
REFERENCES
[1] Mandal Sujit. , 2015. Cohesion, Friction Angle and Slope Instability in the Shivkhola Watershed of Darjiling Himalaya. International Research Journal of Earth Sciences. ISSN 2321–2527Vol. 3(8), Int. Res. J. Earth Sci. International Science Congress
Association Assessing.
http://www.isca.in/EARTH_SCI/Archive/v3/i8/1.ISCA -IRJES-2015-033.php
[2] Fabio Vittorio De Blasio, Friction, Cohesion, and Slope Stability., 2011. Book Chapter published in Introduction to the Physics of Landslides, on pages
23 to 52
https://doi.org/10.1007/978-94-007-1122-8_2 [3] Hoek, E. and Brown, E.T., 1997. Practical estimates
or rock mass strength. Int. J. Rock Mech. & Mining Sci. & Geomechanics Abstracts. 34(8), 1165-1186 [4] Pinheiro, M.; Emery, X.; Miranda, T.; Lamas, L.;
Espada, M. , 2018. Modelling Geotechnical
Heterogeneities Using Geostatistical Simulation and Finite Differences Analysis. Minerals 2018, 8, 52.. https://doi.org/10.3390/min8020052
[5] Soares, A. Narciso, J.; Araújo, C.P.; Azevedo, L.; Nunes, R.; Costa, J.F., 2019. A Geostatistical Simulation of a Mineral Deposit using Uncertain Experimental Data. Minerals 2019, 9, 247.
[6] Ozturk. C.A., and E. Simdi., 2014. Geostatistical Investigation Of Geotechnical And Constructional Properties In Kadikoy–Kartal Subway, Turkey, Tunn Undergr Space Tech. 41 35–45
[7] Brom. A and Natonik. Adrianna, 2017. Estimation of geotechnical parameters on the basis of geophysical methods and geostatistics. Volume 6:
Issue 2, p. 70–79 DOI:
https://doi.org/10.1515/ctg-2017-0006
[8] Fang. Xing, 2018. Quantitative analysis of spatial variability of geotechnical parameters. AIP Conference Proceedings 1955, 020027 (2018); https://doi.org/10.1063/1.5033599
[9] Fisonga ,Marsheal, Wang, Fei and Mutambo, Victor , 2017. The estimation of sampling density in improving geostatistical prediction for geotechnical characterization.
https://doi.org/10.1080/19386362.2018.1526484 [10]Jaksa, M. B., Brooker, P. I. and Kaggwa, W. S.,
1997. Inaccuracies associated with estimating random measurement errors, Journal of Geotechnical and Geoenvironmental Engineering, ASCE, 123(5), 393–401
[11]Uzielli, M., Vannuchi, G. and Phoon, K. K. ,2005. Random ˆeld characterization of stress-normalized cone penetration testing parameters, Geotechnique, 55(1), 3–20.
[12]Baker, J. W., and Faber, M. H. , 2008. Liquefaction risk assessment using geostatistics to account for soil spatial variability, Journal of Geotechnical and Geoenvironmental Engineering, ASCE, 134(1), 14–23.
[13]Zhang, L. M., and Dasaka, S. M. , 2010. Uncertainties in geologic proˆles vs. variability in pile founding depth, Journal of Geotechnical and Geoenvironmental Engineering, ASCE, 136(11), 1475–1488.
[14]Bieniawski, Z.T., 1989, Engineering Rock Mass Classifications, John Wiley, New York
[15]Romana, M., Seron, J.B., & Montalar, E., 2003, SMR Geomechanics classification: Application, experience and validation, ISRM 2003–Technology roadmap for rock mechanics, South African Institute of Mining and Metallurgy, 2003. p. 1-4
[16]Matheron, G, 1970. La Théorie Des Variables Régionalisées Et Ses Applications. Cahiers du Centre de Morphologie Mathématique de Fontainebleau. Ecole des Mines de Paris
[17]Nebojša Davidović, Verka Prolović, Dragoslav Stojić., 2010. Modeling Of Soil Parameters Spatial Uncertainty By Geostatistics. Facta Universitatisseries: Architecture And Civil Engineering Vol. 8, No 1, 2010, Pp. 111 - 118 DOI: 10.2298/Fuace1001111d
University Press: New York
[19]Bohling, G., 2005:.Introduction To Geostatistics And Variogram Analysis, Earth, 1-20.
[20]Clayton Deutsch, Julián M. Ortiz., 2002. Calculation of Uncertainty in the Variogram. Mathematical
Geology 34(2):169-183 DOI:
10.1023/A:1014412218427
[21]Deutsch, J.L., Szymanski, J. and Deutsch, C.V., 2014. Checks and measures of performance for kriging estimates, Journal of the Southern African Institute of Mining and Metallurgy, 114:3, 223-230. [22]Cressie, N.A.C., 2015. Statistics for Spatial Data,
Revised Edition. Published by Wiley Classics Library, John Wiley, 2015. Total number of pages: 928. ISBN: 978-1-119-11518-2. DOI: 10.1111/jtsa.12168
[23]Elkadi A.S. and M. Huisman., 2002. 3D-GSIS geotechnical modeling of tunnel intersection in soft ground: the Second Heinenoord Tunnel, Netherlands, Tunn Undergr Space Tech. 17(4) 363–369.
[24]Pijush Samui, Thallak G. Sitharam., 2011. Application of Geostatistical Models for Estimating Spatial Variability of Rock Depth.Copyright © 2011 SciRes. ENG Engineering, 2011, 3, 886-894. DOI:10.4236/eng.2011.39108
[25]Delhomme J. P.. 1979, Spatial Variability and Uncertainty in Groundwater Flow Parameters: A Geostatistical Approach. Water Resources Research, Vol. 15, No. 2, 1979, pp. 269-280. doi:10.1029/WR015i002p00269
[26]Galhano. C. ,F. Rocha and Gomes. C., 2018. Geostatistical analysis of the influence of textural, mineralogical and geochemical parameters on the geotechnical behaviour of the ‘Argilas de Aveiro’
Formation (Portugal). DOI:
https://doi.org/10.1180/000985599545966Published online by Cambridge University Press
[27]Ferrari, F.; Apuani, T.; Giani, G.P., 2014. Rock Mass Rating spatial estimation by geostatistical analysis. International Journal of Rock Mechanics and Mining Sciences, Volume 70. International Journal of Rock Mechanics and Mining Sciences. Elsevier. ISSN:
1365-1609. http:
//dx.doi.org/10.1016/j.ijrmms.2014.04.016
[28]Kulatilake P. H. S. W. and A. Ghosh, 1988. An Investigation into Accuracy of Spatial Variation Estimation Using Static Cone Penetrometer Data. Proceedings of the First International Symposium on Penetration Testing, Orlando, 1988, pp. 815-821. [29]Kulatilake P. H. S. W. 1989., Probabilistic
Potentiometric Surface Mapping, Journal of Geotechnical & Geoenvironmental Engineering, Vol. 115, No. 11, 1989, pp. 1569-1587. DOI:10.1061/(ASCE)0733-9410(1989)115:11(1569) [30]Boisvert J, Manchuk J, Deutsch C.,2009.
Kriging in the presence of locally varying anisotropy usingnon-Euclidean distances. Math
Geosci 41:585–601.
DOI:10.1007/s11004-009-9229-1
[31]Marwanza. I., Nas. C., Hamdani. Helman. A., Haryanto. I ., 2016. Coal Reosurces Classification Using Variogram To Describe The Spatial Variability.
Natural and Social Sciences (IMPACT: IJRANSS) ISSN(P): 2347-4580; ISSN(E): 2321-8851. Vol. 4, Issue 10, p. 151-158
[32]Jim Sizemore, John Paul Mueller, 2015. MATLAB For Dummies 2nd Edition, Kindle Edition. ISBN-13: 978-1118820100, ISBN-10: 111882010X. Published by John Wiley & Son
[33]Asghar Ghasemi, Saleh Zahediasl., 2012. Normality Tests for Statistical Analysis: A Guide for Non-Statisticians. not J Endocrinol Metab. 2012;10(2):486-489. DOI: 10.5812/ijem.3505 [34]Elliott AC, Woodward WA., 2007.
Statistical analysis quick reference guidebook with SPSS examples. 1st ed. London: Sage Publications [35]Martin, J. D., and Simpson, T. W., 2005. Use of
kriging models to approximate deterministic computer models, AIAA Journal, 43(4), 853–863 [36]Kleijnen, J. P. C.,2007. Kriging metamodeling in
simulation: a review, European Journal of Operational Research, 192(3), 707–716. DOI: 10.1016/j.ejor.2007.10.013
![Figure 1.1 Simple security factors [15]](https://thumb-us.123doks.com/thumbv2/123dok_us/8628539.1418247/1.612.371.524.561.679/figure-simple-security-factors.webp)
![Figure 1. 2 Variogram Model[19]](https://thumb-us.123doks.com/thumbv2/123dok_us/8628539.1418247/2.612.365.526.60.171/figure-variogram-model.webp)