TESTING NEUTRALITY IN SUBDIVIDED POPULATIONS
MONTGOMERY SLATKIN
Department of Zoology, NJ-15, University of Washington, Seattle, Washington 98195 Manuscript received October 14, 1980
Revised copy accepted December 22, 1981
ABSTRACT
Statistical tests of the neutrality hypothesis that are based on the sam- pling theory of EWENS (1972) require the assumption of panmixia. I t is pro- posed that for a population comprising numerous local populations with weak gene flow among them, tests based on EWENS’ theory can be applied separately to samples from each local population. At low levels of gene flow, migration acts primarily like mutation, introducing new alleles to each local population. It is shown with simulation results that, a t low levels of migration, correlations in allele frequencies among demes are sufficiently small that the results from the application of EWENS’ theory to each deme are statistically independent. It is also shown that, by combining the results of the tests in different demes, some statistical power to detect deviations from neutrality is gained. The method is illustrated with the application to data on a salamander species. At low levels of gene flow, population sub- division must be taken account of in testing neutrality and the proposed test provides one way to do so.
INCE the discovery of large amounts of genetic variability in natural popu- lations, a controversy has existed between those who argue that most of the variability is due to the combined effects of mutation pressure and genetic drift-the “neutralists”-and those who claim that most of the variation is maintained by some form of natural selection-the “selectionists”. While this controversy has not been resolved, it has led both to the development of new biochemical techniques for estimating actual levels of variability and to the development of new statistical theories of population genetic processes.
The statistical theories have been directed primarily to testing whether the neutral mutation theory of
KIMURA
(1968), which assumes that all alleles are selectively neutral, accounts for observations. Commonly used tests of neutrali- ty have been based on EWENS’ (1972) sampling theory of neutral alleles in a panmictic population. The assumption of panmixia is due partly to a lack of theory applicable to subdivided populations and partly to the simulation re- sults of EWENS and GILLESPIE (1974), which show that some population subdivision does not invalidate the use of EWENS’ theory.In this paper, I will show that ignoring population subdivision can strongly bias a test of neutrality and will show how and under what conditions EWENS’ sampling theory can be applied to subdivided populations. The extent of popu- lation subdivision discussed here is much greater than that considered by
534 M. SLATKIN
EWENS and GILLESPIE (1974) and the results do not contradict theirs. How- ever, as the data analyzed elsewhere indicate (SLATKIN 1981), there are species that apparently have little gene flow among local populations.
EWENS’ SAMPLING THEORY
The theory developed by EWENS (1972) and KARLIN and MCGREGOR (1972) has been subject to extensive mathematical analysis by KINGRIAS (1977), WATTERSON (1977, 1978), GRIFFITHS (1979), and others. EWENS’ sampling theory applies to a panmictic population of effective size N of a diploid species. Mutations are assumed to occur at a rate p with each mutant being different from all other alleles. This is the “infinite alleles” model of KIMURA and CROW
(1964). If a sample of n alleles is drawn from this population, EWEKS (1972) and KARLIN and MCGREGOR (1972) showed that the number of distinct alleles, k , found in the sample is a sufficient statistic for estimating 0 = 4Np. That result is true in the limit as N becomes large and p small but with n and 8
fixed.
EWENS (1972) also showed that, given 8, the distribution of the allele frequencies in the sample of size n is completely determined by k. Therefore, if k is used to estimate 0, the distribution of allele frequencies can be used to construct a test statistic to determine whether or not the sample of allele frequencies is consistent with the infinite neutral alleles model. TATTERS SON
(1977, 1978) shows that the homozygosity,
i=l
and where the xi are the allele frequencies in the sample, is a good test statistic, and WATTERSON (1978) provides a table of values of F for different n and
k
and different probability levels under the hypothesis of neutrality. I will call the use of F as a test statistic the EWENS-WATTERSON test.THE M U T A T I O N A L I Z I N G O F M I G R A T I O N
NEUTRALITY IN SUBDIVIDED P O P U L A T I O N S 535 To illustrate this idea, consider the island model of population structure, first analyzed by WRIGHT (1931). WRIGHT assumed an infinite number of local populations and focused attention on one which received immigrants from the rest, but later workers have used the term “island model” to describe a finite collection of local populations randomly exchanging migrants (
MARUYAMA
1970;MAYNARD
SMITH 1970; LATTER 1973). The island model has a particu- larly simple structure because it assumes no geographic relationships among the local populations. Consider a collection of d randomly mating populations of diploid individuals, with each population of effective size N . Assume that generations are discrete and nonoverlapping and that in each generation, a fraction m of the gametes are replaced by gametes chosen randomly from the d-1 other local populations. To simplify the discussion, each local popula- tion will be called a deme and the collection of demes will be called the population. Consider a single locus described by the infinite alleles model with mutation rate p.Many features of the island model can be understood by considering two quantities, F , and F,, the probabilities of identity by descent of two alleles chosen at random from different demes and from the same deme. The results of MARUYAMA (1970) and
MAYNARD
SMITH (1970) can be rewritten to show that, if N and d are large and y. is small, the ratio F B / F W at equilibrium is approximately independent of N :I
=
F d F ,=
Cm/(d-
1)1/[p+
m / ( d-
111 (1)(FELSENSTEIN 1978). As discussed by SPIETH (1974) and more extensively by FELSENSTEIN (1978), the quantity I can be regarded as a measure of the
extent of correlation among demes induced by migration because it indicates the relative probability of finding two alleles identical by descent in two different demes as compared to the probability in the same deme.
In considering each deme separately the equilibrium value of FT,. is ap- proximately:
(2) where I is defined by Equation (1). The expression for F , has the same form
as that for the probability of identity by descent in a single panmictic popula- tion of effective size N : F =
11
(1+
4 N p ) (MALECOT 1948). The only dif- ference is that the mutation rate p is replaced by an effective mutation rateF w
=
1/[1+
4Np+
4
”
(1-
I)]p’
=
p+
m (1- I). (3)These results for the island model illustrate the two points about migration when migration rates are low. The correlation among demes, measured by I,
536 M. SLATKIN
FELSENSTEIN (1978) have noted the similarity of migration and mutation for
the island model.
In this paper, the concern is with devising a test of neutrality that can be applied to a subdivided population. The preceding discussion suggests that, if migration rates are low, it may be possible to apply the EWENS-WATTERSON test in each deme separately. Under the hypothesis of neutrality, the para- meter, 0, governing the distribution of allele frequencies in each deme would depend on the effective population size and the effective mutation rate, p‘, which includes both mutation and migration.
It is clear that if migration rates are low enough, this approach to testing neutrality will be valid. It is certainly so with no migration, because the population becomes a collection of independent panmictic demes. When migra- tion rates are very small, much smaller than the mutation rate, migration should have a negligible effect on the distribution of allele frequencies. The question of interest is how large the migration rates can be and still have this approach to testing neutrality be valid. To answer that question a computer simulation study was necessary. Before discussing the simulation program and results, we must consider models of selection that provide alternative hypotheses.
CANONICAL MODELS O F SELECTION
I n testing the hypothesis of neutrality, which is a null hypothesis, it is reasonable to use for comparison an alternative model of some form of natural selection. There are, of course, an infinite number of such models and any one can be invoked on a n ad hoc basis to explain any set of data. For there to be a convincing demonstration that a particular type of selection is common in natural populations, relatively simple canonical models using very few parameters must provide an explanation of several sets of data that is as good as or better than that provided by the neutral model. Several canonical models have been proposed, but I will consider only a few here.
Selection in favor of heterozygotes will tend to maintain more alleles and more heterozygotes than in the absence of selection. The canonical model, which
I will call the model of “uniform overdominance,” was introduced by KIMURA and CROW (1964). In this model, every homozygote has the same fitness and every heterozygote has the fitness ( 1
+
s) relative to homozygotes. This selec- tion model provides very favorable conditions for the maintenance of heterozy- gosity by overdominance. The equilibrium solution for the infinite alleles model of uniform overdominance was found by LI (1977) and WATTERSON(1978) based on a finite alleles solution of WRIGHT (1949). WATTERSON (1978) develops the sampling theory for this model.
A second type of selection thought to be important is against deleterious alleles. The use of models of deleterious alleles is supported by the evidence that most mutants of measurable effect have been found to be deleterious
NEUTRALITY I N SUBDIVIDED POPULATIONS 537
There are two different models of deleterious alleles. One model, which I will call the “two class” model, assumes that there are two classes of alleles, “normal” and “deleterious”. When a mutation occurs, regardless of the allele that mutates, there is a given probability, y , that the new allele is deleterious and the probability, 1-7, that it is normal. A diploid individual’s fitness is the prod- uct of the fitnesses of the alleles it carries. EWENS (1979) describes this model as the model of “generalized neutrality”.
With the two class selection model, only the relative fitness of the two classes and y need be specified. It is conventional to assign a fitness to the deleterious class of 1
-
s relative to the normal class, but it is completely equivalent to as- sign a fitness of 1/(1 - s) to the normal class relative to the deleterious class. The model is not of only deleterious mutations because some mutations cause deleterious alleles to become normal.The analytic theory of the two class model, and its generalizations to more classes, was developed by LI (1979) and WATTERSON (1978) for the infinite alleles model and by OHTA (1976) for the stepwise-mutation model. WATTER- SON (1978) shows that in samples taken from panmictic populations deviations from the neutrality hypothesis are proportional to ( N s ) when N s is small. The deviations are unchanged if s is replaced by
-
s, so the model can be regarded as a model of advantageous mutations as well, as pointed out above.An alternative model of deleterious mutations, and one for which there is no usable analytic theory, I will call the “steady flux” model. This model, dis- cussed by KING and OHTA (1975) and OHTA (1976) in the context of the stepwise-mutation model, assumes that each mutation causes an incremental change in fitness. Each allele has an associated fitness, w ; and when a mutation occurs, the mutant allele has a fitness
w
(1+
s ).
The fitness of an individual is the product of the fitnesses of the two alleles it carries.KING
and OHTA (1975) and OHTA (1976) use an additive rather than a multiplicative model, but f o r weak selection these two ways of computing an individual’s fitness are nearly equivalent. The multiplicative model eliminates the possibility of negative fitnesses.If s<O, this model represents a steady flux of deleterious alleles and, if s>O, a steady flux of advantageous alleles. Under the assumptions of this model, there is no upper o r lower bound to the average population fitness. That is not a problem, at least for the model, since only relative fitnesses matter and at any time only a small range of possible allelic fitnesses are present. Whether the two class model or the steady flux model is a better representation of the actual properties of deleterious mutations is not clear, and arguments can be made in favor of each.
538 M. SLATKIN SIMULATION RESULTS
The simulation program modeled the combined effects of genetic drift, gene flow, mutation and, if necessary, natural selection. The program is described in more detail elsewhere (SLATKIN 1981). For a single simulation, the follow- ing parameters were specified:
( 1 ) the number of demes, d, and the paths of migration among demes;
( 2 ) migration rate, m, which is the fraction of individuals migrating from each
( 3 ) the effective population size of each deme, N ;
(4) the mutation rate, p ;
( 5 ) the selection model and its parameters.
The simulations were carried out by specifying the initial state of the popu- lation, the number of replicates and the length of each replicate. Two initial states were used: a monomorphic population with one allele fixed through- out, and a completely polymorphic population with each allele being initially unique. Each replicate was started from the same initial state and at the end of each replicate, a sample of 25 individuals was taken from each of 10 demes. The geometric arrangement of demes was defined by specifying which demes could exchange migrants with which other demes. Migrants from a deme were equally likely to go to any other deme with which that deme exchanged migrants.
The hypothesis of neutrality was tested at the end of each replicate by ap- plying the EWENS-WATTERSON test to the sample from each deme. For the sample, the number of distinct alleles, k, and the homozygosity, F , were com- puted. Then, using the information in WATTERSON (1978, Table l ) , the proba- bility of obtaining the value of F or smaller, given the value of k , the sample size ( n
=
50) and the assumption of neutrality, was found. For example, if the sample contained two distinct alleles with F = 0.58, the probability of obtain- ing that value of F or smaller assuming neutrality is between 0.1 and 0.5. Or, if there mere three distinct alleles with F = 0.36, the probability of obtaining that value of F or smaller assuming neutrality is between 0.025 and 0.05. Val- ues of F for values ofk
not in WATTERSON’S (1978) table were found by inter- polation. With the parameter values used in the simulations, it was rare for there to be more than five alleles in a sample from each deme.The small sample size does not provide much power for a test of neutrality in each deme. However, if results from tests performed in different demes are combined, a more powerful test can be obtained. There are several ways to combine the tests from different demes. I defined “bins” to count the number
of tests that resulted in probability values in different ranges. For the parame- ter values I could run, convenient bins were formed for the probability ranges: (0, 0.05), (0.05, O . l j , (0.1, 0.5) and (0.5, l.O), which I will call bins 1, 2, 3, and 4 respectively. With relatively few alleles in each deme, the range (0.5, 1 .O j cannot be subdivided. The EWENS-WATTERSON test in each deme results in a bin number. For the two examples mentioned, the first, with
k
= 2 and F =0.58 would be in bin 3 and the second, with
k
= 3 and F = 0.36, would be in bin 1.NEUTRALITY IN SUBDIVIDED P O P U L A T I O N S 539 In a set of R replicates Bij is the number of tests of neutrality in the jth replicate that produced results in bin
i ( i
=
1, 2 , 3, 4 and j z 1.
.
.
R ) . TheBij are the basic data from the simulations and they contain two kinds of infor-
mation: they indicate whether there are significant correlations in the out- comes of the EWENS-WATTERSON test in different demes in the same replicate; and they indicate whether there are significant differences from the results expected under neutrality.
To test for correlations vvithin a replicate the Bii were tested for heteroge- neity. Only 10 demes were sampled in each replicate and no test for neutrality could be performed if
k
r 1 soZ
Bii5
10. For such data, a simple test for heterogeneity was performed on the 2 X R table obtained by pooling bins 1, 2 and 3 (Bii+
B2i+
B 3 j ) and comparing those values with B4j. The pooling was done to obtain a table with roughly equal expectations. From the 2 X R table a value of 'X could be computed to apply a x 2 test for heterogeneity with R-
1 degrees of freedom. I will denote the value of z2 for the heterogeneity test by C,.To combine the tests for neutrality into a single test, the Bii were added over all replicates to obtain Bi
=
Z
B i j , the total numbers in each bin, andB = Z Bi the total number of tests performed. Under the assumption of neu- trality, the expected values of B, and Bz are B / 2 0 , the expected value of B ,
is 2 B / 5 and of B,, B / 2 . The actual values were compared with the expectation in a 2 x 4 table, yielding a value of x2. I will denote the value of
x2
obtained from this 2 X 4 table by C N . The data from different replicates are necessarilv independent and if the value of CH indicates that there is no significant corre- lation within each replicate, then assuming neutrality Cy should be distributed asx 2
with 3 degrees of freedom (d.f.).
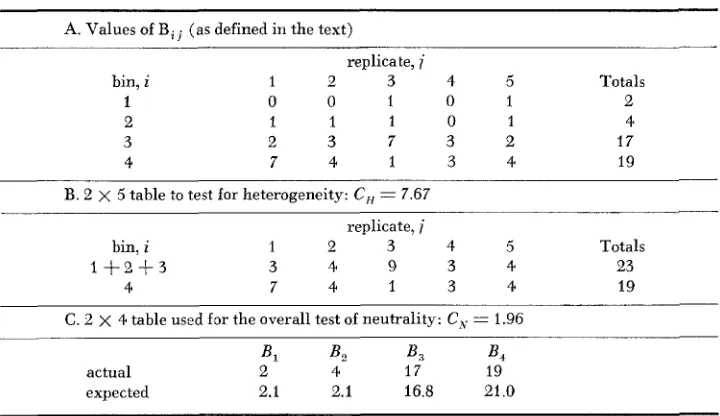
To illustrate how the results were obtained from each set of replicates an example is worked out in Table 1. The value of C, (with 4 d.f.) does not indi- cate significant heterogeneity in the samples and the value of C N (with 3 d.f.)
does not indicate a significant deviation from neutrality in the samples. The results for only five replicates are shown to save space. In general, 10 or 20
replicates were run for each set of parameter values making the expected val- ues of B, and B , greater than 5. LEWONTIN and FELSENSTEIN (1965) show that with small sample size the z2 test of heterogeneity in a 2 X N table is conservative.
The test of the neutrality hypothesis I propose for a subdivided population with low levels of gene flow among demes is based on the value of CY. TOO large a value of
C N
would indicate significant deviations from the neutrality hypothesis. The deviation, if found, could be due t o selection or to some other factor discussed later. Before this test can be applied to data from natural popu- lations, there are two questions that must be answered: (1) Are there biologi- cally reasonable values of the parameters for which the application of this test4
i = l
R
jk1 4
540 M. SLATKIN TABLE 1
Analysis of replicates for significant heterogeneity and deviations from neutrality
A. Values of Bi (as defined in the text)
replicate, i
bin, i 1
e
3 4 5 Totals1 0 0 1 0 1 2
2 1 1 1 0 1 4
3 2 3 7 3 2 17
4 7 4 1 3 4 19
B. 2 x 5 table t o test for heterogeneity: C , = 7.67 replicate, i
bin, i 1 2 3 4 5 Totals
l f 2 f 3 3 4 9 3 4 23
4 7 4 1 3 4 19
C . 2 x 4 table used f o r the overall test of neutrality: C, = 1.96
Bl B2 B , B ,
actual 2 4 17 19
expected 2.1 2.1 16.8 21.0
is statistically valid? (2) Assuming this test is valid, does it have any statistical power?
To answer the first question, I will show that if migration rates are low ( N m < 0 . 5 ) , the value of CH in each set of replicates shows no significant het- erogeneity making it valid to apply this test to data from natural populations, which represent single replicates. Once homogeneity within replicates is estab- lished the value of CAY indicates whether there are deviations from neutrality. The results from different replicates are pooled to gain a larger sample size since no more than 10 demes could be simulated due to limitations of computer size. For this test to be valid, no significant deviations from neutrality should be found when completely neutral alleles are simulated.
The results in Table 2 establish both of these points. Even with the most re- strictive geometry, a linear array of demes, there is no significant correlation within replicates; and there is no tendency to find departures from neutrality when neutral alleles are simulated.
NEUTRALITY I N SUBDIVIDED POPULATIONS
TABLE 2
Simulation results for neutral alleles*
54
1_ _ _ _ _ _ _ _ ~ ~ ~~
I. 5 x 2 Array of Demes
B m B , B , B3 B ,
c,t
CHS0.001 0.001 8 10 83 91 1.04 8.9
0.001 0.00025 9 5 83 95 2.75 11.4
0.00025 0.001 5 4 50 63 1.01 18.4
0.00025 0.00025 2 9 35 44 5.9 20.3
11. 10 X 1 Array of Demes
B m Bl B , B3 B , CA,+ CHS
0.001 0.001 6 8 88 93 3.24 24.4
0.00025 0.001 6 7 37 62 2.37 8.7 * In all cases N = I28 and 20 replicates of 1000 generations each were run for each set of
-f Under the neutrality hypothesis, C, is distributed as x 2 with 3 d.f.
8 Under the hypothesis of homogeneity within replicates C, is distributed as
x*
with 19 d.f. para.meter values. Populations were initially monomorphic.The simulations of neutral alleles also show that ignoring population sub- division can lead to a strong bias in the EWENS-WATTERSON test. At low levels of gene flow in a subdivided population different alleles tend to become the most common alleles in different demes. That does not affect the EWENS- WATTERSON test within each deme but when data from different genes are pooled, the value of F in the pooled sample would tend to be too low for the value of
k.
This bias in the EWENS-WATTERSON test, which is similar to the well-known Wahlund effect, tends to give the appearance of overdominance.In the simulations, the samples of 50 alleles from all 10 demes were pooled at the end of each replicate to produce a single sample of 500 alleles to which the EWENS-WATTERSON test for that sample size could be applied. The result from each replicate was a bin number indicating the probability of obtaining that value of F or smaller given the number of alleles in the sample. Table 4 shows the extent of the bias at low migration rates. For neutral alleles, there is a high probability of obtaining significant deviations from expectations under neutrality, thus making the EWENS-WATTERSON test unsuitable for pooled data from subdivided populations. This result does not contradict those of EWENS and GILLESPIE (1 974) because they assumed much higher levels of gene flow than I have.
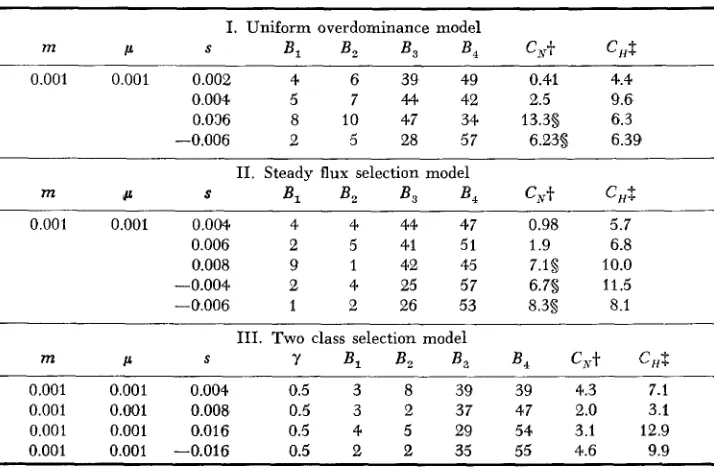
T o answer the second question, about the power of applying the EWENS- WATTERSON test in each deme separately, I ran several sets of simulations with different models of selection. Some results are presented in Table 5 and these show that this test does have some power. For the models of uniform over- dominance and a steady flux of selected mutants, selection intensities of
542 M. SLATKIN
TABLE 3
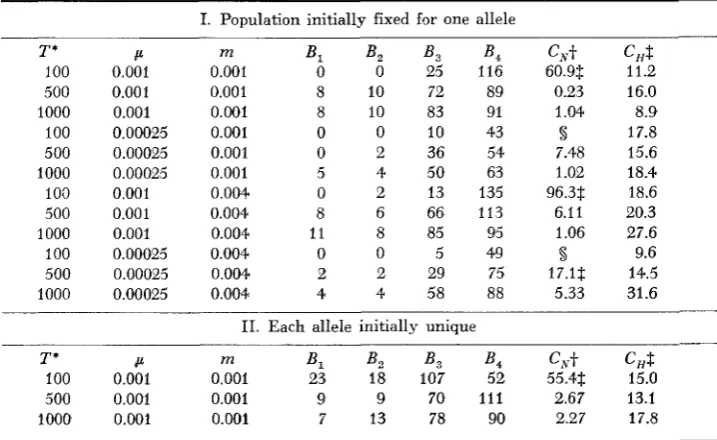
Simulation results for neutral alleles in a 5 x 2 array of demes of size N = 128'
I. Population initially fixed for one allele
T * P m B , B , B , B , C N t C,S
100 0.001 0.001 0 0 25 116 60.9$ 11.2
500 0.001 0.001 8 10 72 89 0.23 16.0
1000 0.001 0.001 8 10 83 91 1.04 8.9
100 0.00025 0.001 0 0 10 43 5 17.8
500 0.00025 0.001 0 2 36 54 7.48 15.6
1000 0.00025 0.001 5 4 50 63 1.02 18.4
100 0.001 0.004 0 2 13 135 96.3s 18.6
500 0.001 0.004 8 6 66 113 6.11 20.3
1000 0.001 0.004 11 8 85 95 1.06 27.6
100 0.00025 0.004 0 0 5 49 8 9.6
500 0.00025 0.004 2 2 29 75 17.1s 14.5
1000 0.00025 0.004 4 4 58 88 5.33 31.6
11. Each allele initially unique
T * B m B l B , B , B ,
c,t
c,s100 0.001 0.001 23 18 107 52 55.43 15.0
500 0.001 0.001 9 9 70 111 2.67 13.1
1000 0.001 0.001 7 13 78 90 2.27 17.8 * T is the number of generations in each replicate and there were 20 replicates run f o r each
-j- See notes in Table 2.
$ Pr
<
0.05.set of parameter values.
Pr
<
0.05 using a binomial test of B , compared t o B ,+
B ,+
B,.no power to detect deviations from neutrality for the two class model. For the parameter values I used, there were not enough distinct alleles to allow detec- tion of deviations from neutrality. These results confirm the expectation that the steady flux model with s
<
0 represents a much stronger form of deleteri- ous mutations than does the two class model.DISCUSSION
To illustrate how the proposed method is used, it was applied to data of
LARSON and HIGHTON (1979) on the salamander Plethodon dorsalis. By ana-
TABLE 4
Simulation results for the EWENS-WATTERSON test applied to data pooled f r o m different demes*
P m
0.001 0.001 4 2 3 I t
0.00025 0.001 8 2 0
w
* In all cases, there was a 5 x 2 array of demes of size N = 128 and 10 replicates of 5000
1. Pr
<
0.05 using a binomial test comparing B , with B ,+
B ,+
B,.NEUTRALITY I N SUBDIVIDED POPULATIONS 543
TABLE 5
Simulation results for selected alleles in a 5
x
2 array of d e w s of size N = 128*~ ~~~ I. Uniform overdominance model
m c S Bl B , B3 B, c x t CHS
0.001 0.001 0.002 4 6 39 49 0.41 4.4
0.004 5 7 44 42 2.5 9.6
0.036 8 10 47 34 13.3s 6.3
-0.006 2 5 28 57 6.23s 6.39
11. Steady flux selection model
m L S Bl B , B , B , CNt CHf
0.001 0.001 0.004. 4 4 44 47 0.98 5.7
0.006 2 5 41 51 1.9 6.8
0.008 9 1 42 45 7.1s 10.0
-0.004 2 4 25 57 6.7s 11.5
-0.006 1 2 26 53 8.3s 8.1
111. TWO class selection model
S
cc 7 B , B , B , B ,
c,t
C,Sm
0.001 0.001 0.004 0.5 3 8 39 39 4.3 7.1
0.001 0.001 0.008 0.5 3 2 37 47 2.0 3.1
0.001 0.001 0.016 0.5 4 5 29 54 3.1 12.9
0.001 0.001 -0.016 0.5 2 2 35 55 4.6 9.9
* In all cases 10 sets of replicates of 1000 generations each were run and the populations were
+
Under neutrality C, is distributed as x 2 with 3 d.f.initially monomorphic.
$. Under homogeneity between replicates C, is distributed as x 2 with 9 d.f. 5 Pr 0.05.
lyzing the geographic distribution of rare alleles, I have shown that there is probably little gene flow among local populations of this species (SLATKIN 1981). Table 6 shows the results of applying the EWENS-WATTERSON test to each sample which contained more than one distinct allele. The esterase locus, which is polymorphic in the most samples, shows evidence of non-neutrality and the data from all loci together differ significantly from the neutrality hy- pothesis (although the pooled data do not if the esterase locus is excluded). The electrophoretic techniques used to obtain these data probably do not distinguish all alleles so we cannot reach any conclusions about the neutral mutation the-
ory, but these data do show how this method can be used. Moreover, if it is found by applying more refined electrophoretic techniques that there are many more alleles at these loci, then these sample sizes are sufficient to yield a rea- sonably strong test of neutrality.
544 M. SLATKIN TABLE 6
Application of EWENS-WATTERSON test of neutrality to datrr of LARSON and HIGHTON:
I , O C U > P r i 0 . 0 5 0.05<Pr<O.l 0 1 <Pr<O.5 I’l>0.5
Alb 1 1 4
Est 2 2 6 31
Got-1 1 1
Idh-1 1
Ldh-l 1
Ldh-2 3
Mdh-1 1
Mdh-2 1
Pep-2 1
P g m 1
6-Pgd 1 1 5 4
Pgi 1
pt. A 1
T f 1 3
Totals 3 5 23 15
_ _ __ _ _ ~. ...
B , B2 B3 BS,
* (1979, Table 2, Locations 4-21 except 7 and 17). Values of k and Ei for each polymorphic locus in each deme were compared with values in Table 1 of WATTERSON (1978) to obtain the probability of that value of F or smaller under neutrality. Sample sizes were from 15 to 39 individuals ( n = 30-78). The results in WATTERSON’S table for n’= 50 were used.
1. P r
<
using sign test of B , against B ,+
B ,+
B,.$ Combining B , and B,, C, / 6.33 (0.95
<
p<
0.975 with 2 d.f.).I thank J. FELSENSTEIN for helpful discussions of this topic and for critical comments on earlier versions of this paper. This research has been supported in part by the National Science Foundation (DEB-7827045).
LITERATURE CITED
EWENS, W. J., 1972 The sampling theory of selectively neutral alleles. Theoret. Pop. Biol.
3: 87-112. -, 1979 Testing the generalized neutrality hypothesis. Theoret. Pop. Biol. 15: 205-216.
Some simulation results for the neutral allele model EWENS, W. J. and J. H. GILLESPIE, 1974
FELSENSTEIN, J., 1978 Theoretical population genetics. University of Washington Lecture
GRIFFITHS, R. C., 1979 On the distribution of allele frequencies in a diffusion model. Theoret.
KARLIN, S . and J. MCGREGOR, 1972 Addendum to a paper of W. J. Ewens. Theoret. Pop.
KIMURA, M., 1968
KIMURA, NI. and J. F. CROW, 1964
KING, J. L. and T. OHTA, 1975 KINGMAN, J. F. C., 1977
with interpretations. Theoret. Pop. Biol. 6: 35-57.
Notes, Seattle, WA.
Pop. Biol. 15: 140-158.
Biol. 3: 113-116.
Evolutionary rate at the molecular level. Nature 217: 624-626.
The number of alleles that can be maintained in a finite population. Genetics 49: 725-738.
Polyallelic mutational equilibria. Genetics 79: 681-691.
N E U T R A L I T Y IN SUBDIVIDED PO PU L A T IO N S 545 LATTER, B. D. H., 1973
LARSON, A. and R. HIGHTON, 1978
The island model of population differentiation: a general solution.
Geographic protein variation and divergence in the sala- manders of the Plethodon welleri group (Amphibia, Plethodontidae). Syst. Zool. 27: 431448.
The robustness of homogeneity tests in 2 x N
Maintenance of heterozygosity under mutation and selection pressures in a finite population. Proc. Natl. Acad. Sci., U.S.A. 74: 2509-2513. - , 1979 Mainte- nance of genetic variability under the pressure of neutral and deleterious mutations in finite populations. Genetics 92 : 647-667.
Genetics 73: 147-157.
LEWONTIN, R. C. and J. FELSENSTEIN, 1965
LI, W.-H., 1977
tables. Biometrics 21 : 19-33.
MALECOT, G., 1948 MARYUAMA, T., 1970
Biol. 1: 273-306. MAYNARD SMITH, J., 1970
evolution. Amer. Natur. 104: 231-237. OHTA, T., 1976
morphism. Theoret. Pop. Biol. 10: 254-275. SIMMONS. M. J. and J. F. CROW, 1977
pp. 49-98. In: Annual Review of Genetics, Vol. 11.
SLATKIN, M., 1981 355.
SPIETH, P. T., 1974
W~TTERSON, G. A., 1977 Heterosis or neutrality? Genetics 85: 789-814. - , 1978 The
Les Mathkmatiques de I'Hkrkdite. Masson, Paris.
Effective number of alleles in a subdivided population. Theoret. Pop.
Population size, polymorphism and the rate of non-Darwinian
Role of very slight deleterious mutations in molecular evolution and poly-
Mutations affecting fitness in Drosophila populations.
Estimating rates of gene flow in natural populations. Genetics 99: 323-
Gene flow and genetic differentiation. Genetics 78: 961-965.
homozygosity test of neutrality. Genetics 88: 405-41 7.
Adaptation and selection. pp. 365-389. In: Genetics, Paleontology and Evolution. Edited by G. L. JEPSON, E. f i n and G. G. SIMPSON. Princeton University Press.
WRIGHT, S., 1931 Evolution in Mendelian populations. Genetics 16: 97-159.