ABSTRACT
FISH, KATHRYN SANDS. Exploring Women’s Perspectives on Motivational Factors toward Job Satisfaction in a High Tech Organization. (Under the direction of Dr. James E. Bartlett, II, Ph.D.).
Companies in the technology sector foster high stress environments, deal with
frequently changing business and products, and face a comparatively high employee turnover
rate. Among these challenges, and prominent in the media today, is a noticeable gender
divide in the industry: only 26% of technology-related positions were held by women in
2012. Despite these statistics, the sector also has immense potential for job growth, with a
projected 1.4 million positions opening up by the year 2020. With increased research on the
positive impact of women on the organizations they work for, it is necessary that technology
companies gain a better understanding of their female employee population in order to
improve recruitment, retention, engagement and professional development efforts for
women. Using Q methodology, this study examines the groups and themes that exist based
on the ranking of 75 motivational factors, how these differ by career stage and how they
impact the female participant’s current job satisfaction. Through data collection and
analysis, this study finds that there are three main groupings of women who share similar
views toward motivating factors: 1) women driven by intrinsic values of work; 2) women
driven by external obligation and validation; and 3) women driven by time management
control. Based on the analysis, there is not a significant difference in job satisfaction rating
© Copyright 2014 Kathryn Sands Fish
Exploring Women’s Perspectives on Motivational Factors toward Job Satisfaction in a High Tech Organization
by
Kathryn Sands Fish
A thesis submitted to the Graduate Faculty of North Carolina State University
in partial fulfillment of the requirements for the Degree of
Master of Science
Human Resources Development
Raleigh, North Carolina
2014
APPROVED BY:
_______________________________ ______________________________
Dr. Michelle Bartlett Dr. Diane Chapman
________________________________ Dr. James E. Bartlett, II, Ph.D.
DEDICATION
BIOGRAPHY
Kathryn Fish, a Virginia native, has lived in North Carolina for the past three years. She
obtained two undergraduate degrees in American Politics and French from the University of
Virginia in 2007. Kathryn was introduced to the concept of adult continuing education in her
role with CFA Institute’s Educational Products Division. She continued her career in legal
Professional Development at Wiley Rein, LLP in Washington, DC, where she also began to
work toward her Master’s in Human Resources Development. Since Kathryn has been in
North Carolina, she has worked in a legal operations capacity at Red Hat, Inc., which is
where she became interested in the topic of this thesis – women in technology. Kathryn lives
TABLE OF CONTENTS
LIST OF TABLES ... vi
Exploring Women’s Perspectives on Motivational Factors toward Job Satisfaction in a High Tech Organization ... 1
Introduction ... 1
Statement of the Problem ... 5
Purpose of the Study ... 7
Theoretical Framework ... 8
Literature Review ... 9
Motivational Factors ... 10
Job Satisfaction ... 13
Research Questions ... 16
Research Design – Methods and Procedures ... 16
Step 1: Define the Concourse ... 18
Step 2: Develop the Q-Set ... 18
Step 3: Select the P-Set ... 19
Step 4: Q-Sorting ... 19
Step 5: Analysis and Interpretation ... 20
Participants ... 21
Sample ... 21
Instrumentation ... 22
Data Collection ... 23
Data Analysis ... 24
Results ... 24
P-Set Demographics ... 25
Correlation Between Sorts ... 29
Factor Analysis and Factor Rotation ... 29
Factor Arrays ... 31
Defining Statements ... 36
Group Interpretation ... 37
Discussion ... 45
Limitations and Delimitations ... 46
Significance of Study ... 47
REFERENCES CITED ... 50
APPENDICES ... 55
Appendix A. Participant Solicitation Email ... 56
Appendix B: Post Card-Sort Questionnaire ... 58
Appendix C: Subject Demographics ... 60
Appendix D: Job Satisfaction Measurement Instrument ... 61
Appendix E: Initial List of Concourse Items and Grouping of Motivational Factors ... 64
Appendix F: Q-Sort Response Tracking Worksheet ... 67
Appendix G: Informed Consent Letter for Research Participants ... 68
LIST OF TABLES
Table 1.1 Breakdown of functional area or department for sampled population ... 26
Table 1.2 Breakdown of whether sampled population holds a leadership role ... 27
Table 1.3 Age of sampled population at time of study ... 27
Table 1.4 Years worked at current technology company compared to length of time working in technology sector ... 28
Table 1.5 Breakdown of marital status for sampled population ... 28
Table 1.6 Breakdown of primary source of income for household by marital status ... 29
Table 2.1 Factor loading of subject responses to motivational factors ... 30
Table 2.2 Descriptive statistics for factors/groups ... 31
Table 3.1 Factor arrays ... 32
Table 4.1 Highest rated statements for each factor ... 36
Exploring Women’s Perspectives on Motivational Factors toward Job Satisfaction in a High Tech Organization
Introduction
A 2012 study conducted by the United States Department of Labor, Bureau of Labor
Statistics found that, while fifty-seven percent of professional occupations in the United
States workforce were held by women, they made up only twenty-six percent of professional
computing occupations. Similar statistics are seen when examining the pipeline of women
who take computer science courses in high school or who receive their undergraduate
degrees in a technology-related field: nineteen percent of AP Computer Science test-takers in
2012 and eighteen percent of 2011 Computer and Information Sciences undergraduate degree
recipients were female (U.S. Department of Labor, 2012). The gender divide in technology
has developed into a prominent issue in 2013 and 2014, from the sheer lack of quantity of
females in these occupations to broader conversations on unequal pay and
underrepresentation in leadership and executive positions. Over the past five years, women
who hold high profile leadership positions in high tech organizations have come under public
scrutiny (Brady, 2013). Their professional career choices and path is scrutinized, as well as
their personal choices and family, but often a combination of the two. Often, there is concern
over how they can or cannot hope to successfully find balance. Some well-known examples
of female leaders in the technology sector are Marissa Mayer, CEO and President of Yahoo!,
Meg Whitman, CEO and President of Hewlett-Packard, and Sheryl Sandberg, Chief
Operating Officer at Facebook. In the words of Sheryl Sandberg in her best-selling book,
still the same…The promise of equality is not the same as true equality” (Sandberg, 2013, p.
7).
In addition to comprising the employee minority, these women are also faced with the
added challenge of working in an industry with a comparatively high turnover rate. Research
shows that technology companies cultivate short career lifespans given the fast-paced and
frequently changing nature of their business and technology. A September 2013 Tech
Republic blogpost on “IT Employment” describes a recent PayScale survey, specifically
noting that “the employee turnover rate among Fortune 500 companies in the IT industry is
the highest among all industries surveyed” (“Tech Companies Have,” 2013). Are women
threatened by these types of work environments? Do high tech organizations fail to offer
compensation and benefits that are attractive and competitive enough for women to stay in
their current role? Do women leave to seek equally or more challenging careers at
organizations in other industries?
Why is having women in technology so important? In addition to the laws of
economics and diversity studies telling us that “if we tapped into the entire pool of human
resources and talent, our collective performance would improve,” previous research
investigates the impact of women in the workforce, specifically with regard to the technology
sector (Sandberg, 2013, p. 7). In a study for the Anita Borg Institute for Women in
Technology, Simard (2007) outlines human resources challenges experienced by technology
organizations and describes how increasing the number of females in the workforce can
contribute to solving some of these issues. Current challenges for high tech organizations
employees, an increase in the demand for high-level high-tech jobs despite the growth of
offshoring positions, organizational need for more experience and a broader skillset in
employees and marketplace competition for these skills, and dealing with high employee
turnover and absenteeism (Simard, 2007). Simard argues that women play a key role in
helping technology companies meet market demands, as well as improving their overall
organizational culture and experience. Women meet the competitive criteria for the new
demands of technical work, including interpersonal skills and business skills. Women are
“paramount to user-driven innovation,” influencing 80% of consumer spending decisions and
with the potential to bring new markets and technological applications to new lines of
business and markets. Technology companies with a diverse workforce tend to promote a
more positive image in the marketplace and lead to better decision making at all
organizational levels. Simard also cites a 2004 study that found a correlation between the
presence of women in higher management and financial performance of the organization
(Simard, 2007).
In a July 2013 report on “Why Diversity Matter,” Catalyst pulled together recent data
to build the business case for diversity consisting of four main pillars: improving financial
performance, leveraging talent, reflecting the marketplace and building reputation, and
increasing innovation and group performance. Their research supports Simard’s writing that
women impact a company’s financial performance. Looking specifically at women in
leadership positions, Catalyst cited a 2007 McKinsey study that found that 89 European
companies that had the highest proportions of women in senior leadership positions and at
with 10 percent higher return on equity, 48 percent higher EBIT, and 1.7 times the stock
price growth” (“Why Diversity Matters,” 2013, p. 2). Catalyst also references a 2013 study
that found that gender diversity is positively associated with increased sales revenue, more
customers, and greater relative profits (“Why Diversity Matters,” 2013, p. 5). The
association of decreased turnover intentions with an employee’s positive perceptions of the
organization’s diversity climate and the increased effectiveness of group problem solving due
to an increase in women are additional pieces of evidence that support Catalyst’s claim that
diversity is essential to the success of organizations (“Why Diversity Matters, 2013, p. 9).
While the gender gap in high tech organizations has garnered a great deal of media
attention, spurring the development of non-profit organizations such as the Anita Borg
Institute and Catalyst, Inc. that are dedicated to “increasing the impact of women in all
aspects of technology and increase the positive impact of technology on the world’s women”
and “expanding opportunities for women and business,” it is also worth exploring as a social
science question through research and the use of a theoretical framework. With limited
research to date, technology companies can only benefit from a further understanding of their
female employees, specifically how their motivations tie to job satisfaction. Through a
mixed methods research approach and various statistical analyses, this study aims to provide
insight into this topic and assist high tech organizations in creating an arsenal of tools they
can use to improve recruitment, retention and the professional development of their female
Statement of the Problem
The need to better understand how motivational factors for women working in high
tech organizations affect their job satisfaction is a key driver for conducting this research.
With a projection of 1.4 million computing-related jobs opening in the United States by the
year 2020, a 16% increase over the previous decade, and one that is faster than the average
for all occupations, it is imperative that technology companies determine what is needed to
recruit and retain top-talent and specifically, top-talent females (U.S. Department of Labor,
2012; Ghazzawi, 2010, p. 2). From an employer’s perspective, this knowledge may
contribute to reducing spend on replacing departed employees, which can equal “150 percent
or more of a worker’s salary, including hiring, retraining, lost productivity and time spent
supervising new employees,” as well as assist in building a diverse organizational culture,
and improve employee engagement (Solnik, 2012). If technology companies have insight
into the motivational factors of their female employee population, they may be able to
modify their current benefits plans, career trajectories, strategic programs and general
policies to better meet women’s needs and increase their job satisfaction. For female
employees, working for a company that is aware of and supports their motivational needs
may result in increased job satisfaction through fulfillment and empowerment, company
loyalty, higher work ethic and positive morale. Technology companies that take advantage
of this knowledge and tailor their recruiting, development and retention programs to their
female employee population will be industry frontrunners of these initiatives. They will also
benefit from satisfied employees, who “help boost the image of their organization by being
Distilling motivational factors for women into categories that can be utilized by an
organization is a valuable exercise. Recurring themes may provide insight into areas where
an organization needs to focus and spend additional resources. Alternatively, research may
shift views and theories currently held by management or highlight areas that may not be
worth funding given that they will not likely affect the broader female population’s job
satisfaction. The concept of categorizing motivational factors and the subsequent effect had
on employment satisfaction is embedded in the theoretical framework of Herzberg’s two
factor theory on motivation. This will be discussed in greater detail in the following sections.
While women who work in technology combat social and gender norms, including
dealing with a male-dominated workplace, facing work-life balance, and keeping pace with a
constantly changing business, increasing their employment numbers in this industry demands
exploration and analysis if these organizations expect to flourish in size, culture and revenue.
According to Catalyst’s report, “an analysis of women’s participation in IT patents found that
mixed-gender teams in the United States produced patents that were cited 26 to 42 percent
more frequently than the average” (“Why Diversity Matters,” 2013, p. 12). Hyde and Kling
state at the outset of their 2001 article for Psychology of Women Quarterly: “Women’s
educational and occupational achievements are crucial to the economic productivity and
prosperity of the nation, as well as to the mental health of women and their families” (Hyde
Purpose of the Study
The purpose of this study is to examine the groups that exist based on how women
who work in a high tech organization view and rank the motivational factors that are
important to them in their current job. Through a Q methodological data collection process,
the study examines how women group and rank a concourse of items concerning
motivational factors. Additionally, the study explores the differences based on length of time
working at the company and length of time working in the technology sector. Do women
rate certain motivational factors higher if they are just beginning their career at the company?
How might these change over the course of their tenure at the organization? In the tech
sector? If they have worked in other industries? Technology organizations are relatively
“young,” with the median age of employees falling between 30 and 35 years old according to
a 2013 Payscale Study (Hardy, 2013). Therefore, it would be beneficial to consider the
motivational variations at different career stages so that companies can adapt, as needed, to
employee needs. Lastly, the study investigates differences in job satisfaction among the
groups of women. How might specific motivational factors fit into these ratings? What can
companies do or provide to their employees to help maintain high job satisfaction levels?
The data for this study is gathered using Q methodology with the goal of identifying
shared views across the population. The population for this study is women who work in a
high tech organization. The sample is a group of women who work in various roles at a
single technology company. While the company has over 5,000 employees worldwide, this
sample is limited specifically to the company’s Raleigh, North Carolina headquarters. The
Theoretical Framework
Several theories attempt to explain motivational factors as they relate to employees.
For purposes of this study, the theoretical framework selected as a basis for developing the
research questions and methods is Herzberg’s two factor theory of motivation. The primary
rationale behind selecting this as the theoretical framework is Herzberg’s association of
employee motivation to employee attitudes. He proposed that an “employee’s motivation to
work is best understood when the respective attitude of that employee is understood” (Tietjen
& Myers, 1998, p. 226). Herzberg’s seminal 1959 study focused on answering three
questions:
1. How can one specify the attitude of any individual toward his or her job? 2. What causes these attitudes?
3. What are the consequences of these attitudes?
Through qualitative investigation and quantitative analysis of the data, Herzberg
came to a conclusion that two sets of factors influenced an employee’s level of satisfaction
with their job. He labeled these two sets of factors “motivators” and “hygiene factors.”
Motivators include recognition, achievement, growth potential, and responsibility, and “refer
to factors intrinsic to the work itself” (Tietjen & Myers, 1998, p. 226). Hygiene factors “are
characterized as extrinsic components of job design” and may include salary, work
relationships, working conditions, and job security (Furnham & Eracleous, 2009, p. 766).
Herzberg theorized that motivators foster positive attitudes toward an employee’s job
because they satisfy the need for self-actualization (Herzberg, 1959). Alternatively, hygiene
Herzberg, the absence of motivators does not cause dissatisfaction, nor does the absence of
hygiene factors result in job satisfaction; “the opposite of job satisfaction is not
dissatisfaction, but rather a simple lack of satisfaction” (Herzberg, 1968; Tietjen & Myers,
1998). Herzberg’s conclusion can help organizations align job structures and their work
environment with the motivators that directly impact job satisfaction.
Because this study seeks to collect and interpret how women view the importance of
various motivational factors and the subsequent effect they have on their job satisfaction,
Herzberg’s two factor theory provides an initial framework for categorizing the most
common factors for interpretation. Through the Q methodological approach, this study
captures the rankings of numerous motivational factors by women and considers the broader
motivator (intrinsic) and hygiene factor (extrinsic) categories during analysis. Through a
supplemental survey, participants rated their current job satisfaction, which will be compared
to the factor groupings. While Herzberg did not include gender as a variable in his research,
this study compares women’s views on motivational factors with their job satisfaction to see
if there is a correlation like Herzberg believed.
Literature Review
The scholarly literature reviewed for this study pertained to employee motivational
factors and job satisfaction, both of which contribute to a comprehensive understanding of
The literature review is a key element to a Q methodology study given that the
concourse items are selected from the breadth of perspectives offered by scholarly writers
and researchers, as well as interviews and popular literature. The material represents
“existing opinions and arguments, things lay people, politicians, representative organisations,
professionals, scientists have to say about the topic; this is the raw material for Q” (van Exel,
2005, p. 4). For this study, the primary goal of the literature review is to collect the most
commonly perceived motivational factors in a professional setting. The concourse item
selection from existing literature will be discussed at greater detail in the following section
on research methods.
The literature was selected through several searches on the North Carolina State
University Library System. The search terms “employee motivation” returned over 146,000
results. “Motivation and job satisfaction” returned over 67,000 search results. “Motivational
factors for women” returned over 38,000 search results. “Workplace motivational factors”
returned over 11,000 results. The string “extrinsic intrinsic motivation women” returned
over 5,000. In addition to incorporating the terms “women” and “female” into the query, to
further narrow down these search results, the researcher mainly focused on publications from
the past twenty years. Because of limited time and resources, a relatively small subset of this
literature was reviewed for this study.
Motivational Factors
The term motivation, as it will be interpreted for this study, is defined as “an internal
research has been conducted on motivational factors in a professional setting, while little to
no research has been conducted on motivational factors relating to female employees in
technology. Resulting studies target a variety of industries or job functions. Raman,
Anantharaman, and Ramanathan (2013) focused their study on differences in motivational
factors on Malaysian women and whether or not these factors, along with environmental and
personality factors, can be predictors of women entrepreneurship. In a 2009 study, Kirkwood
also looked at the effect of motivational factors on entrepreneurship and how they differ for
men and women. Yurstseven (2012) considered how motivational factors affect employee
job satisfaction in the hotel industry. Aarabi, Subramaniam, and Abu Baker Akeel (2013)
focused specifically on the service industry. Hildebrandt and Eom (2011) focused on
motivational factors as they pertain to teaching professionals.
Additional frequently seen variables include gender (Kirkwood, 2009; Humbert &
Drew, 2009), geography (Aworemi, Abdul-Azeez & Durowoju, 2011; Raman,
Anantharaman, & Ramanathan, 2013), and age (Hildebrandt & Eom, 2011). For purposes of
this study, the data analysis will seek to correlate motivational factors and job satisfaction for
women in the high tech industry. The geography will be limited to a United States
perspective. The only consideration of age in the study will be seen in the demographics
segment of the participant survey through questions on participant birth year and the
longevity of the participant in their current position and in the technology industry. From
this information, the researcher will explore how women at various career points share or
concourse items? Do their rankings align with Herzberg’s two factor theory in that there is a
natural distinction between motivators and extrinsic, or hygiene, factors?
Additional research is seen on specific motivational factors and, from these, the
concourse for this study was selected. Pool investigated the values of leadership on work
motivation and, subsequently job satisfaction, in 1997. Studies focused on relationships with
colleagues and with the family as motivating factors (Tsai, Yen, Huang & Huang, 2007),
total compensation packages (Igalens & Roussel, 1999), job characteristics and job
involvement (Lawler & Hall, 1970; Cummings & Bigelow, 1976), pay satisfaction (Chiu,
2000), and personal control on employee job-performance and satisfaction (Orpen, 1994). In
a 2008 study on “Motivational Orientations in Work,” researchers Murtonen, Olkinuora,
Palonen, Hakkarainen, and Lehtinen found that different types of organizational
environments stem different types of motivations in employees. For their research, "the key
finding is that rapidly changing, increasingly complex, and fundamentally networked
organisations are challenging environments for worker motivation" (Murtonen, Olkinuora,
Palonen, Hakkarainen, & Lehtinen, 2008). Some of these organizational environments are
characteristic of technology companies. Raman, Anantharaman, and Ramanathan (2013)
also looked at environmental factors and personality on motivations for entrepreneurship.
Kirkwood’s 2009 study on the gender differences in motivational factors for
entrepreneurship found that men and women are similarly motivated by combination of push
and pull factors. However, there were three gender differences of note: 1) women were more
influenced by desire for independence, 2) women considered their children as motivators
While much of the research focuses on positive motivational factors, it is also
necessary to consider how negative factors may affect employee motivation as seen through
push-pull theory. Pull factors, characterized similarly to Herzberg’s motivators, are those
that draw people to do something. For Kirkwood’s research (2009), pull factors draw
individuals to start a business. Push factors are less prevalent, are characterized by personal
or external factors, and most frequently have a negative connotation (Kirkwood, 2009, p.
346). Examples of push factors include divorce, family obligations, or being overlooked for
a promotion. These opposite factor categories are especially relevant when looking at gender
differences and previous research has suggested that women are more motivated by push
factors than by pull factors (Clain, 2000; Orhan & Scott, 2001). This will be explored in the
Results section of this study.
Through this review, close to one hundred motivational factors were presented and
selected as a basis for the initial concourse items for the Q-methodological study. The
researcher followed the lead of many of the scholars in categorizing or grouping the factors
into overarching themes, loosely based on internal and external characteristics. The
concourse items and categorization rationale will be discussed in the Research Methods
section of this proposal.
Job Satisfaction
Warr (2002) defines job satisfaction as “the extent to which people are satisfied with
their work” (p. 1). This concept is the target of numerous studies (Yurtseven, 2012; Huang
& Van de Vliert, 2004; Thomas & Pekerti, 2003) that investigate the effect of job satisfaction
on the workplace and has recently been of interest as there has been an increase in the
importance of efficiency as “a factor affecting the management of contemporary business in
today’s world” (Yurtseven, 2012, p. 72). Scholars have conducted research on employee job
satisfaction as it relates to cultural variables, including country wealth and welfare programs
(Huang & Van de Vliert, 2003), paternalism (Pellegrini & Scandura, 2006), Protestant work
ethic and collectivism (Firestone, Garza, & Harris, 2005), individualism (Huang & Van de
Vliert, 2004), and the promotion of nationalism (Thomas & Pekerti, 2003).
Several studies have also explored the relationship between job satisfaction and
employee motivational factors, yet there still lacks a universally accepted theory given the
complexities of motivation (Yurtseven, 2007; Tzeng, 2002; Becherer, Morgan & Richard,
1982; Hunt, Head & Sorensen, 1982; Wabha, 1978; Ma & MacMillan, 1999). In a 2011
study, Yurtseven conducted research on the causes of motivational problems related to
employee duties in Turkey, consisting of analyzing twenty-seven factors regarding
employees’ attitudes toward job satisfaction. The research found that employees value
behavioral approaches and that the least importantly rated issues for employees were the lack
of information about company policy and working beyond normal hours (Yurtseven, 2007).
Like the motivational factor studies previously described, many of these joint studies target
specific industries or lines of work. Tzeng (2002) linked work environment to job
satisfaction and good outcomes in the nursing field. Other studies explored job
characteristics, motivation and job satisfaction in industrial sales (Becherer, Morgan &
pharmaceuticals (Hunt, Head, & Sorensen, 1982), motivation, performance and satisfaction
for librarians (Wabha, 1978), and workplace conditions and job satisfaction in teaching (Ma
& MacMillan, 1999).
Self-determination theory contributes to many researchers’ theoretical frameworks for
these studies. According to this theory, “autonomy, relatedness, and competence are three
intrinsic psychological needs that, if fulfilled in the workplace, will lead to greater
satisfaction, performance, and general well-being” (Deci & Ryan, 1985). Some
consequences of job satisfaction include organizational commitment, organizational
citizenship behavior, and employee well-being, while consequences of job dissatisfaction are
absenteeism and turnover (Ghazzawi, 2010, p. 7).
Many job satisfaction instruments have been developed over the past few decades,
but this study uses the Minnesota Satisfaction Questionnaire “MSQ” short form as a basis
because of its simplicity and length. A 2010 study conducted by Ghazzawi on job satisfaction
and gender in U.S. technology professionals utilized the MSQ short form, finding that gender
does not play a role in job satisfaction and that IT professionals tend to be extrinsically
satisfied overall (Ghazzawi, 2010, p. 21). This questionnaire, “one of the most popular and
frequently used instruments for measuring job satisfaction” is comprised of 20 questions
covering intrinsic, extrinsic and general job satisfaction that participants respond to by
selecting their level of satisfaction or dissatisfaction on a five-point scale (Ghazzawi, 2010, p.
15). On this scale: Very dissatisfied = 1; dissatisfied = 2; neither satisfied or dissatisfied = 3;
will be discussed in greater detail in the Research Methods section and can be found in
Appendix D.
Research Questions
As seen in the extensive research that has already been conducted in the area of
employee motivations, there are several different variables that this study could incorporate.
However, to simplify the purpose and limit the scope, this study focuses on answering the
following research questions:
1. What are the viewpoints on motivational factors for women who work in a high tech
organization?
2. For each motivational group, what are the highest and lowest rated motivations?
3. Do women who have worked at technology organizations for different periods of time
share a similar view of motivation?
4. Do women who fall within different motivational groups have different job
satisfaction levels?
Research Design – Methods and Procedures
The following section will discuss the research methods and procedures used for
this study. It was determined that one unique and appropriate approach for obtaining data
relating to motivational factors for women in a high tech organization is through a Q
methodological study as Q is a preferred method for researchers who are studying attitudes
researchers to uncover how and why people think the way they do (DeWeese, 2012, p. 47).
It can be useful in exploring “tastes, preferences, sentiments, motives and goals” (Van Exel
& de Graaf, 2005, p. 2). In this case, the intent is to, not only establish what are the key
common motivational factors on women in technology, but to gain a better understanding of
how these factors relate to a women’s job satisfaction. A greater understanding of this will
help technology companies to provide better opportunities to their female employee base,
tailoring these opportunities to meet the needs of this specific group.
Outcomes of Q methodology may include the identification of important internal and
external constituencies, defining participant perceptions, and providing insight into these
shared or differing perceptions (DeWeese, 2012, p. 48). This approach focuses on the
collection of statements or perspectives on a given area of interest, in this case motivational
factors. The various perspectives are organized into subgroups based on “similarity of
opinion” and are then analyzed to “generate thematic results” (DeWeese, 2012, p. 49). Q
methodology is comprised of five main steps, which will be discussed in greater detail below.
In a brief summary, a sample of statements taken from the literature review, or the Q-set, is
presented to a group of participants. The participants, the P-set, are asked to rank the
statements from their perspectives. In this Q-sort process, “people give subjective meaning
to the statements, and by doing so reveal their subjective viewpoint or personal profile” (Van
Exel & de Graaf, 2005, p. 1). In his basic handbook, Political Subjectivity (1980), Steven
Brown provides the following overview of Q methodology:
Most typically, a person is presented with a set of statements about some topic, and is
to as “Q sorting.” The statements are matters of opinion only (not fact), and the fact
that the Q sorter is ranking the statements from his or her own point of view is what
brings subjectivity into the picture. There is obviously no right or wrong way to
provide “my point of view” about anything… Yet the rankings are subject to factor
analysis, and the resulting factors, inasmuch as they have arisen from individual
subjectivities, indicate segments of subjectivity which exist. And since the interest of
Q methodology is in the nature of the segments and the extent to which they are
similar or dissimilar, the issue of large numbers, so fundamental to most social
research, is rendered relatively unimportant.
Step 1: Define the Concourse
The first step in a Q methodological study is to develop the concourse, or collection
of statements, through a complete review of literature on the subject. The concourse, in other
words, is the “collection of all the possible statements the respondents can make about the
subject at hand” (Van Exel & de Graaf, 2005, p. 4). Once the statements are selected, they
are organized into broad thematic categories. In this study, the researcher collected
statements pertaining to employee motivational factors through a comprehensive review of
the scholarly and contemporary literature on the subject.
Step 2: Develop the Q-Set
In the development phase of the Q methodological approach, the concourse items are
repetitive statements. As seen in DeWeese’s Q methodological study on the characteristics
of successful Olympic level coaches, this editing process “can be completed by allowing
domain experts to review the statements, performing a pilot study, or through a random
sample of statements.” DeWeese was able to narrow his original collection of statements to
34 concourse items. The recommendation is to select a Q-set that represents a wide range of
opinions on the topic, generally consisting of 40 to 50 statements (Van Exel & de Graaf,
2005, p. 5). This study involved a final Q-set consisting of 75 statements.
Step 3: Select the P-Set
The P-set, or the research participants, is commonly comprised of a smaller number
than the Q-set. The smaller sample size is one of the benefits to conducting a Q
methodological study: “Q does not need numbers of subjects, for it can reveal a
characteristic independently of the distribution of that characteristic relative to other
characteristics” (Van Exel & de Graaf, 2005; Smith, 2001). The P-set for this study was
generated from an email solicitation to the participating company’s North American
headquarters’ women’s group listserv. The final number for this study’s P-set was 18. These
female participants “are expected to have a clear and distinct viewpoint regarding the
problem and, in that quality, may define a factor” (Brown, 1980).
Step 4: Q-Sorting
In the Q-Sorting phase, the P-set is asked to complete an initial sort of the Q-set by
that the final Q-set has random number assignments for tracking purposes. Once the piles are
created, the respondent “rank orders the statements according to the condition of instruction,”
in this case the level of agreement, and enters the corresponding statement number into the
worksheet found in Appendix F (Van Exel & de Graaf, 2005, p. 7). This phase of the process
concludes with a brief follow-up survey to obtain greater detail on the rankings and
selections the participants made. Participants were also asked to complete a demographic
and job satisfaction questionnaire. Samples of these items are found in Appendix B,
Appendix C, and Appendix D.
Step 5: Analysis and Interpretation
According to van Exel, the analysis of the Q-sort is a purely technical, objective
procedure, and is therefore sometimes referred to as the scientific basis of Q (Van Exel & de
Graaf, 2005, p. 8). To begin, the researcher calculates the correlation matrix of all Q-sorts.
This is followed by factor analysis to identify natural groupings of either similarities or
dissimilarities. Van Exel and de Graaf (2005) explain it as:
People with similar views on the topic will share the same factor. A factor loading is
determined for each Q-sort, expressing the extent to which each Q-sort is associated
with each factor. The number of factors in the final set depends on the variability in
the elicited Q-sorts.
In the last two stages of analysis, the researcher performs a factor rotation and a
factor score. The factor rotation is designed to maintain as much variance as possible. In this
Graaf (2005) describe this rotation as objective, done according to a statistical principal, or
theoretical or judgmental, performed based on the researcher’s prior knowledge or
preconceived idea about the topic. These rotations allow the researcher to see opinions from
different angles and each resulting final factor “represents a group of individual points of
view that are highly correlated with each other and uncorrelated with others” (Van Exel and
de Graaf, 2005, p. 9).
Once the rotation is completed, the researcher calculates factor scores and differential
scores. These z-scores define a given factor and can be added back to the distribution to
provide a composite Q-sort for each factor (DeWeese, 2012, p. 54).
Participants
In order to obtain the viewpoints and perceptions of women who work in a high tech
organization, the North American headquarters’ women’s affinity group of a single
technology company was sent an email communication to solicit participants for this study
(see Appendix A). Within the company, these women represent various corporate
departments, functional roles, tenures, and work styles. On a personal level, they represent
different geographies, ages, educational backgrounds, family situations, and career paths.
Sample
Given that Q methodology does not require a large sample group, the number of
who opted to participate based on the email communication. Of the 363 women who
received the original email solicitation, 18 actually participated in the study.
Instrumentation
To measure participants’ beliefs concerning motivational factors, a concourse was
developed. The concourse items were selected as a result of a conclusive literature review of
existing studies and current popular literature on the subject. Initial concourse items were
taken from scholarly literature, opinion pieces, and contemporary nonfiction writing. This
initial list consisted of 91 items, which were grouped into five categories based on broader
themes and loosely tying to Herzberg’s internal and external themes. The overarching
themes for this initial concourse set include: tangible factors (monetary or benefits-related),
external obligation factors (personal or family-related), self-fulfillment factors (status, career
growth, or recognition), organizational and social factors (organizational culture and
environment), and work/task-specific factors (characteristics of the work itself).
To create the final Q-set, the list was narrowed down to remove any duplicate
statements or redundancies. The final list of concourse items included 75 statements on
motivational factors. This list followed the same categorization into broader themes as
described above. The final list can be seen in Appendix D.
In addition to the concourse list, participants were given a free-form questionnaire to
complete at the conclusion of their sorting. This questionnaire was designed to collect
demographical information. Participants were also given a job satisfaction questionnaire, the
level of satisfaction on a scale of 1 to 5, 5 being very satisfied. In this questionnaire,
participants were provided with an area for free response should they wish to elaborate.
Data Collection
Prior to commencing the data collection segment of this study, the researcher
obtained approval from the Institutional Review Board (IRB) of North Carolina State
University on February 4, 2014. A copy of the approval is found in Appendix G. Once this
approval was obtained, the researcher followed the Q methodological approach as described
in previous sections with the ultimate goal of exploring a group of females’ preferences and
opinions on motivational factors in the workplace.
Volunteer participants were identified through an electronic solicitation to the
company’s “Women’s Leadership Community” email group. This group includes all
full-time female employees who work in the company’s Raleigh, North Carolina office. As part
of this initial email communication, potential participants were provided details on the
purpose of the study, a description of what their role entails, and contact information to
address any ethical or privacy concerns.
Once participants committed to taking part in the study, the researcher scheduled
three separate in-person sessions to administer the Q-sort. These sessions took place at the
company’s Raleigh office in a conference room; there were no more than 12 people in
attendance so that the researcher could effectively explain the process and answer any
questions as they came up. At each of these sessions, prior to the sorting process, participants
Then, the researcher provided a brief introduction and overview (5 to 10 minutes) of the
process before asking the participants to begin sorting. Each of the sessions lasted
approximately one hour. From the time that the researcher sent the initial Participant
Introduction Letter on February 18, 2014, all Q-sorts were completed within a three-week
period by March 6, 2014.
Once the participants completed their Q-sort, they were assigned a random
identification number for entry into an Excel spreadsheet for the data analysis phase. All
data was kept in a password protected Excel spreadsheet on the Company’s private and
secure server.
Data Analysis
When all data was collected via the in-person administration, the data analysis phase
began by consolidating the data into a statistical software program, SPSS. The researcher
then conducted various statistical analyses, including factor analysis, through SPSS.
Results
The following section provides an overview of the data that was collected through the
means described above. Eighteen participants completed the Q-sorts to determine how
women who work in a high tech organization share or do not share similar views toward
factors that motivate them. To reiterate, the selection of Q methodology for this study
centers on its purpose to “determine relationships between commonly held opinions on a
statement sort in order to determine common viewpoints or segments of subjectivity”
(DeWeese, 2012, p. 61). This results section will set out demographical information on the
sampled population and correlations between the sorts, as well as an overview of the factor
analysis, factor rotation, factor arrays, defining statements, and the factor interpretations.
P-Set Demographics
Eighteen female participants completed the Q-sort process. All of the participants
currently work at the same high tech organization, although they fall within a wide range of
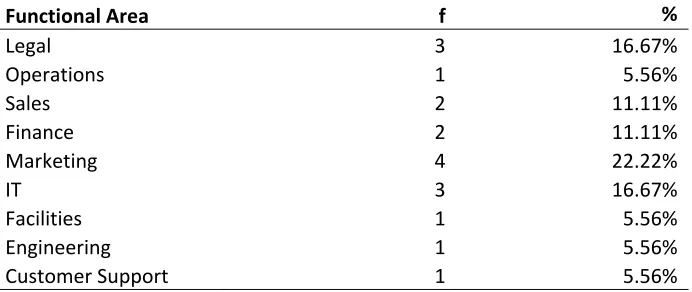
job functions. The corporate functions, or departments, with the highest number of
participants were Legal (3), Marketing (4), and IT (3). The breakdown of functional area or
department for the sampled population is found in Table 1.1. The participants were also
asked whether or not they held a leadership role at the company and, if so, whether it was
part of their current position (manager or supervisory role) or if they served in a leadership
capacity in an alternative function (project management or company committee chair). There
was a close division between those who did and did not hold leadership positions: 44.44%
did and 55.56% did not (see Table 1.2).
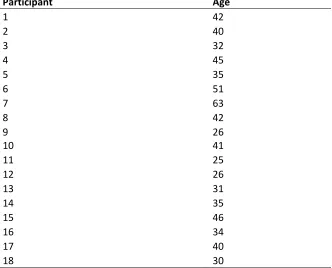
In terms of age, Table 1.3 lists the year of birth for each participant. Based upon this
data, the age for the average participant at the time this survey was conducted was 38. The
youngest participant, born in 1989, was 25 years old. The oldest participant, born in 1951,
was 63.
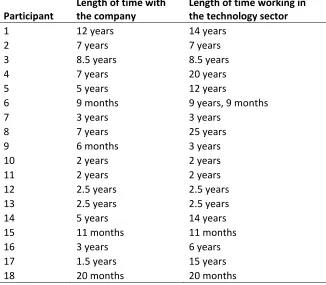
This study also collected data on how long each participant had been working at this
sector. The data seen in Table 1.4 supports the earlier statistics of the technology sector’s
high turnover rate, showing that exactly 50% of the participants worked in the technology
sector prior to joining the current company. On average, the number of years worked at the
current technology company is 3.991 with a standard deviation of 3.178. On average, the
number of years worked in the technology sector is 8.277 with a standard deviation of 7.070.
Participants were not asked how many different technology companies they worked at over
the course of their professional career.
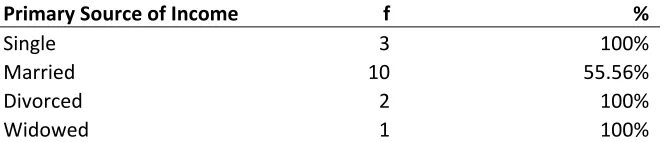
Tables 1.5 and 1.6 provide the breakdown of participant marital status at the time of
the data collection and whether or not the participant is the primary source of income for
their household. The majority of participants are either married (66.67%) or single (16.67%).
For the participants who are married, one-third is the primary breadwinner for their
household.
Table 1.1
Breakdown of functional area or department for sampled population
Functional Area f %
Legal 3 16.67%
Operations 1 5.56%
Sales 2 11.11%
Finance 2 11.11%
Marketing 4 22.22%
IT 3 16.67%
Facilities 1 5.56%
Engineering 1 5.56%
Table 1.2
Breakdown of whether sampled population holds a leadership role
Leadership Role f %
Yes 8 44.44%
No 10 55.56%
Table 1.3
Age of sampled population at time of study
Participant Age
1 42
2 40
3 32
4 45
5 35
6 51
7 63
8 42
9 26
10 41
11 25
12 26
13 31
14 35
15 46
16 34
17 40
Table 1.4
Years worked at current technology company compared to length of time working in technology sector
Participant
Length of time with the company
Length of time working in the technology sector
1 12 years 14 years
2 7 years 7 years
3 8.5 years 8.5 years
4 7 years 20 years
5 5 years 12 years
6 9 months 9 years, 9 months
7 3 years 3 years
8 7 years 25 years
9 6 months 3 years
10 2 years 2 years
11 2 years 2 years
12 2.5 years 2.5 years
13 2.5 years 2.5 years
14 5 years 14 years
15 11 months 11 months
16 3 years 6 years
17 1.5 years 15 years
18 20 months 20 months
Table 1.5
Breakdown of marital status for sampled population
Marital Status f %
Single 3 16.67%
Married 12 66.67%
Divorced 2 11.11%
Table 1.6
Breakdown of primary source of income for household by marital status
Primary Source of Income f %
Single 3 100%
Married 10 55.56%
Divorced 2 100%
Widowed 1 100%
Correlation Between Sorts
To analyze the Q-sorts, it is necessary to first calculate the correlation matrix to
determine differences in the points of view between the participants. Through an in-person
Q-sort administration, 18 female employees at a high tech organization were asked to sort
and rank their perceptions of 75 items or statements concerning motivational factors.
Clusters of these concourse items illustrate various perspectives toward motivational factors.
Following DeWeese’s analysis of Q-sort data concerning the constructs of expert Olympic
level coaches, the researcher utilized SPSS software to generate a correlation matrix of the 18
individual Q-sorts (DeWeese, 2012, p. 66). This correlation matrix shows how each Q-sort
compared and related to the Q-sorts of the other participants. This exercise was conducted to
“determine the variability of the [18] Q sorts in order to determine how many shared factors
are in evidence” (DeWeese, 2012, p. 66). Sorts with a correlation of 1.00 demonstrate
perfect agreement, while a correlation of -1.00 demonstrates perfect negative agreement.
1.00 as possible as they will have shared views toward the motivational factors listed in the
concourse.
Factor Analysis and Factor Rotation
Using SPSS and under advisor supervision, the researcher used factor analysis to
determine how many different groupings, or families, exist based on similarities of responses
by the research participants. The next step in the process is conducting a factor rotation,
which results in various family outcomes. In this particular study, SPSS used varimax with
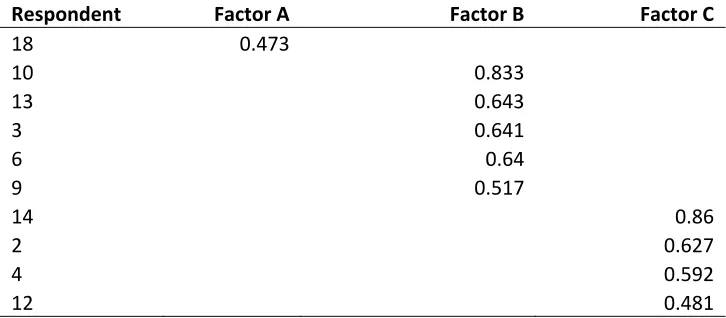
kaiser normalization. The factor rotation resulted in three families that are seen in Table 1.5.
Nine research subjects make up Factor A; five make up Factor B; four comprise Factor C.
Table 1.6 also provides certain demographical data based on these factor loadings and as
compared to the full sample population. Here, two new elements are introduced to the
demographical data: the average number of children and the average job satisfaction rating
based on the Minnesota Satisfaction Questionnaire “MSQ”-20-item short form.
Table 2.1
Factor Loading of Subject Responses to Motivational Factors
Participant Factor A Factor B Factor C
16 0.778
15 0.765
17 0.736
11 0.663
7 0.608
1 0.548
8 0.54
Table 2.1 Continued
Respondent Factor A Factor B Factor C
18 0.473
10 0.833
13 0.643
3 0.641
6 0.64
9 0.517
14 0.86
2 0.627
4 0.592
12 0.481
Table 2.2
Descriptive Statistics for Factors / Groups
Year of Birth
Years with Company
Years in Technology Sector Number of Children Job Satisfaction Rating Factor A Mean
1974 4.01 8.8433 1.0000 4.0000
SD 10.943 3.556 8.206 .527 1.22
Factor B
Mean
1977.8 2.85 5.15 1.6000 4.0000
SD 9.884 3.267 3.672 .447 .707
Factor C
Mean
1977.5 5.375 10.875 0.7500 3.7500
SD 8.103 2.136 7.706 .957 .500
Total Mean 1976 3.9911 8.2689 1.1111 3.9444
SD 9.689 3.178 7.070 .511 .937
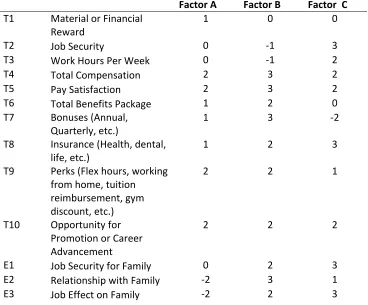
Factor Arrays
The next step in the Q methodology process provides an opportunity to see how each
statement is given a z-score, or factor score, by SPSS. These factor scores are weighted
“based on how strongly they correlate to that factor” (DeWeese, 2012, p. 69). In this
instance, the factor scores have been rounded up to whole numbers to more easily see
comparisons between the factor loadings. In the study, participants were asked to group and
rank the 75 concourse statements on a scale of -6 to +6, therefore, the numbers listed in Table
1.7 fall within this scale and assist the researcher in interpreting the data and creating
overarching themes.
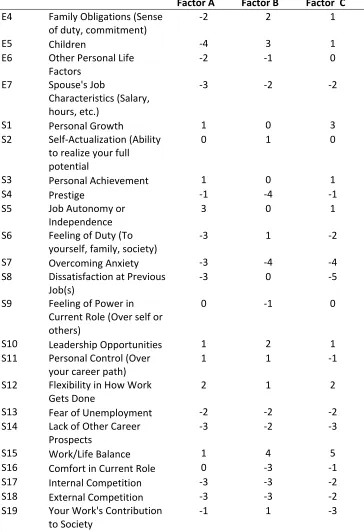
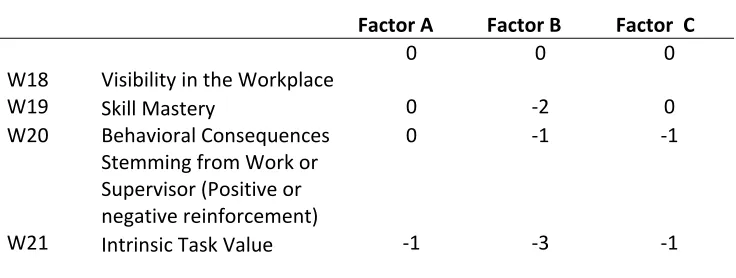
Table 3.1
Factor Arrays
Factor A Factor B Factor C T1 Material or Financial
Reward
1 0 0
T2 Job Security 0 ‐1 3
T3 Work Hours Per Week 0 ‐1 2
T4 Total Compensation 2 3 2
T5 Pay Satisfaction 2 3 2
T6 Total Benefits Package 1 2 0
T7 Bonuses (Annual, Quarterly, etc.)
1 3 ‐2
T8 Insurance (Health, dental, life, etc.)
1 2 3
T9 Perks (Flex hours, working from home, tuition reimbursement, gym discount, etc.)
2 2 1
T10 Opportunity for Promotion or Career Advancement
2 2 2
E1 Job Security for Family 0 2 3
E2 Relationship with Family ‐2 3 1
Table 3.1 Continued
Factor A Factor B Factor C E4 Family Obligations (Sense
of duty, commitment)
‐2 2 1
E5 Children ‐4 3 1
E6 Other Personal Life Factors
‐2 ‐1 0
E7 Spouse's Job
Characteristics (Salary, hours, etc.)
‐3 ‐2 ‐2
S1 Personal Growth 1 0 3
S2 Self‐Actualization (Ability to realize your full potential
0 1 0
S3 Personal Achievement 1 0 1
S4 Prestige ‐1 ‐4 ‐1
S5 Job Autonomy or Independence
3 0 1
S6 Feeling of Duty (To yourself, family, society)
‐3 1 ‐2
S7 Overcoming Anxiety ‐3 ‐4 ‐4
S8 Dissatisfaction at Previous Job(s)
‐3 0 ‐5
S9 Feeling of Power in Current Role (Over self or others)
0 ‐1 0
S10 Leadership Opportunities 1 2 1
S11 Personal Control (Over your career path)
1 1 ‐1
S12 Flexibility in How Work Gets Done
2 1 2
S13 Fear of Unemployment ‐2 ‐2 ‐2
S14 Lack of Other Career Prospects
‐3 ‐2 ‐3
S15 Work/Life Balance 1 4 5
S16 Comfort in Current Role 0 ‐3 ‐1
S17 Internal Competition ‐3 ‐3 ‐2
S18 External Competition ‐3 ‐3 ‐2
S19 Your Work's Contribution to Society
Table 3.1 Continued
Factor A Factor B Factor C
S20 Performance Recognition 2 3 1
S21 Job or Career Status 0 ‐1 1
S22 Stimulation by Work 2 1 2
S23 Passion for Work 3 2 1
S24 Work's Contribution to Positive Self‐Image
1 ‐2 2
S25 Work's Alignment with Personal Beliefs and Values
1 1 3
S26 Work's Alignment with Personal Goals
1 1 3
O1 Supervisor Feedback 1 2 0
O2 Social Identity or Sense of Belonging to a Group
‐1 0 ‐2
O3 Working in Groups ‐1 ‐2 ‐2
O4 Your Company's Involvement with the Community (Charitable contributions, volunteer opportunities, etc.)
‐2 ‐1 ‐2
O5 Company Policy Communication
‐3 ‐2 ‐4
O6 Relationship with Colleagues
2 3 1
O7 Being Helped by Supervisor
‐1 ‐1 ‐3
O8 Workplace Conditions (Seating, comfort, safety, etc.)
0 ‐2 ‐2
O9 Office Location 0 ‐2 ‐1
O10 Organizational Brand or Image
1 0 ‐1
O11 Current Level of
Supervision by Manager
0 0 ‐2
W1 Working to Solve Bigger Problems
1 ‐1 1
W2 Challenging Nature of Work
4 0 2
W3 Opportunities for Continuous Learning on the Job
Table 3.1 Continued
Factor A Factor B Factor C W4 Opportunities for
Continuous Learning from Colleagues
0 ‐1 1
W5 Job Characteristics (Specific job function, daily responsibilities)
0 ‐1 0
W6 Redundancy (Performing the same tasks over and over again)
‐3 ‐1 ‐2
W7 Job Involvement (Engagement and enthusiasm)
4 1 3
W8 Changing World of Work (External factors including technology, work environment, globalization, virtualization)
‐1 0 ‐3
W9 Clarity in Job Role and Responsibility
1 0 ‐1
W10 Ease of Work/Comfort in Role
‐1 ‐3 ‐2
W11 Necessary Equipment is Available to Help you Perform Your job effectively
0 ‐1 ‐3
W12 Job is intellectually challenging (Opportunities to problem solve)
5 2 3
W13 Regularity of work (consistent workflow, predictable and
manageable busy cycles)
‐2 ‐1 ‐2
W14 Simplicity in work tasks ‐3 ‐3 ‐3
W15 Opportunity to Teach Others
0 1 0
W16 Stress (Environment or work itself)
0 ‐1 2
Table 3.1 Continued
Factor A Factor B Factor C
W18 Visibility in the Workplace
0 0 0
W19 Skill Mastery 0 ‐2 0
W20 Behavioral Consequences Stemming from Work or Supervisor (Positive or negative reinforcement)
0 ‐1 ‐1
W21 Intrinsic Task Value ‐1 ‐3 ‐1
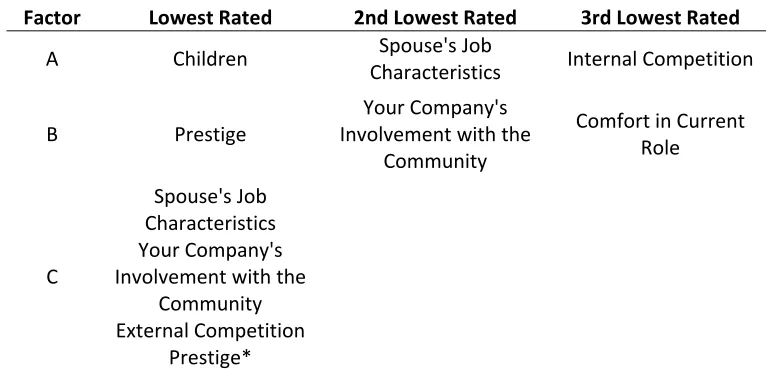
Defining Statements
As part of the data analysis, the researcher looked at what concourse items are unique
to each of the three factors, specifically what were the highest and lowest rated factors.
These anchor statements were the concourse item statements found at the -6 or +6 positions
of the arrays and are considered most or least important by the survey participants. These
statements will assist in defining themes for each motivational group, which will be
discussed in the following section. Table 1.9 illustrates the highest rated statements and
Table 1.10 outlines the lowest rated statements.
Table 4.1
Highest Rated Statements for Each Factor
Factor Highest Rated 2nd Highest Rated 3rd Highest Rated
A
Job is intellectually challenging (Opportunities to
problem solve)
Table 4.1 Continued
Factor Highest Rated 2nd Highest Rated 3rd Highest Rated B Performance
Recognition
Relationship with
Family Work/Life Balance
C Work/Life Balance Personal Growth
Opportunities for Continuous Learning
on the Job
Table 4.2
Lowest Rated Statements for Each Factor
Factor Lowest Rated 2nd Lowest Rated 3rd Lowest Rated
A Children Spouse's Job
Characteristics Internal Competition
B Prestige
Your Company's Involvement with the
Community
Comfort in Current Role
C
Spouse's Job Characteristics Your Company's Involvement with the
Community External Competition
Prestige*
*All statements under -6 for Factor 3 were different.
Group Interpretation
This data analysis explores the similarities and differences in views toward
considered to be a “family” with similar thoughts or beliefs on this specific topic, the
researcher developed three primary factors or themes that correlate with the three factor
loadings. These themes were defined through various statistical measures, including factor
arrays, anchor statements, and qualitative responses from the post-sort questionnaires.
The three emerging themes obtained from this analysis are identified as: (a) women
driven by intrinsic values of work, (b) women driven by external obligations and validation,
and (c) women driven by time management control. Descriptions of these three factors are
provided below, as well as the demographics for the factor loadings and select statements
from the post-sort questionnaires.
Factor A: Women driven by intrinsic values of work. Factor A accounted for the largest variance in the study, 50%, with 9 of the 18 respondents loading onto this factor. As seen in
Table 1.6, the mean year of birth for the women in this factor is 1974. As compared with the
other factors, this was the oldest group. Women in this factor averaged approximately 4
years with the company, but spent twice as much time of their professional career in the
technology sector (8.84 years). This means that a number of them worked at technology
companies in addition to their present employer. The mean number of children that women
had in this factor was 1. The mean job satisfaction rating was 4 out of 5, or “satisfied” when
asked about their current position.
In looking at the factor arrays (see Table 1.7) for Factor A, the three highest z-scores
tied to three of the items found in the “Work and Task Specific Factors” theme: Job is
intellectually challenging (z-score of 5), challenging nature of work (z-score of 4), and job
highest rated statements seen in Table 1.9 and the free responses collected in the post-sort
survey, indicate a strong pull toward motivations stemming from seeking knowledge,
challenge and passion. In contrast, the lowest z-scores and anchor statements involved
redundancy and simplicity in tasks, children, and spouse’s job characteristics. For those who
ranked children and the spouse’s job at -6, it was because they did not have either and felt
that “the relevance is low.”
Participant 1, a 12-year veteran of the company, wrote “I am driven and motivated
primarily by knowledge and a deep curiosity about everything. I need to know how things
work, why things are and how they relate. I get excited about complex problems that seem to
have no solution.” Participant 7 wrote, “My passion for my work explains why I do what I
do. Without passion, it would just be a job, not a career.” Other recurring elements seen in
the post-sort survey were discussion on “the exciting, creative and intellectual experience”
(Participant 8), the importance of feeling challenged, and “taking on challenging material”
(Participants 15 and 11).
These types of factors fit into Herzberg’s “motivators” category, referring to factors
intrinsic to the work itself. With a mean job satisfaction rating of 4, it does appear that the
women who are motivated by knowledge and passion are satisfied with their job. In fact, of
the 4 women who rated their current level of satisfaction at 5, or “Very Satisfied,” 3 of them
were in Factor A.
Because these women are motivated by intangible factors and self-driven factors, it is
important for the company to explore ways that they can continue to provide stimulating and
Factor B: Women driven by external obligations and validation. This factor accounted for 27.7% of the variance in this study and was comprised of 5 of the 18 participants. The
mean year of birth for this group was 1977.8, which is comparable to the mean year of birth
for Factor C (1977.5). Factor B, however, had the least experience in the company (2.85
years) and the technology sector (5.15 years). Interestingly, they also had the highest number
of children with a mean of 1.6. Their mean job satisfaction rating was 4 or “Satisfied.”
What stands out most for this group in looking at the factor arrays and responses to
the post-sort survey is the impact others have on their motivation. This factor values family,
work/life balance (so they can be with their family), and recognition or validation from
others: “Receiving recognition validates the work that I do” (Participant 10). As seen in the
response from Participant 3, “I tend to be a people pleaser…this caused me to always drive
for recognition…and has carried into my adult life.” Participant 6 also wrote, “My
relationship with my family is of most importance to me. The things I do in my life are
impacted by my relationship with my family.”
While the highest rated anchor statement of “performance recognition” and the lowest
rated anchor statement of “prestige” were not sorted by the same person, it is interesting to
note that these two seemingly opposing views were found in the same factor loading.
Participant 6, who assigned “prestige” under -6 wrote, “Prestige is not of great importance to
me. To me, it is something that is defined by some external factor that society places great
weight upon. Desiring prestige or a prestigious job or title is not a motivator for me.” Again,