Copyright 0 1983 by the Genetics Society of America
FINE STRUCTURE MAPPING OF T H E AM
(GDH) LOCUS OF
NEUROSPORA
JOHN A. RAMBOSEK AND JOHN A. KINSEY
Department of Microbioloa, University of Kansas Medical Center, Kansas City, Kansas 66103 Manuscript received April 16, 1983
Revised copy accepted June 27, 1983
ABSTRACT
Utilizing a combination of flanking marker analysis and deletion mapping we have constructed a fine structure map of the a m locus which includes 6 3 point mutants and ten unique deletions. Positions of point mutants can be rapidly assigned to one of 13 segments within the gene on the basis of crosses to nine deletion strains.
HE a w l locus of Neurospora crassa codes for NADP-specific glutamate
T
dehydrogenase (GDH). This enzyme catalyzes a reversible reaction in which ammonium ion and a-ketoglutarate are combined to form glutamate. Thus, the enzyme plays a central role in nitrogen metabolism.T h e am-1 locus and its gene product have been the subject of considerable genetic and biochemical analyses. T h e enzyme is a hexamer which consists of six identical monomers. There are 453 amino acid residues per monomer, and the complete sequence of the monomer has been determined (WOOTEN et al. 1974). In addition, a number of amino acid mutational replacements have been determined (BRETT et al. 1976; SEALE et al. 1977; FINCHAM and BARON 19’7’7; KINSEY et al. 1980). T h e sequence of the mutational replacements in the poly- peptide chain is colinear with the sequence of the corresponding mutational sites in the genetic map (FINCHAM 1967; Smyth 1973; Kinsey et al. 1980). T h e sequence of the first 17 bases of the messenger RNA has been deduced by comparing the amino acid sequence of GDH from double frameshift revertants of the mutant ain6 to that from the wild type (SIDDIG et al. 1980). This infor- mation has allowed the synthesis of a synthetic 17-base fragment that is com- plementary to the amino terminal coding region of the gene. T h e gene has recently been cloned and partially sequenced using this 17-mer as a probe. (KINNAIRD et cil. 1982).
Because the am locus offers a particularly advantageous system for a com- bined genetical and molecular genetic approach to the study of recombination in a microbial eukaryote, we have constructed a detailed fine structure map of the locus which includes 63 point mutations and ten deletions. Our initial results were obtained by flanking marker analysis. However, it quickly became apparent that, in order to map the large number of mutant sites with which we were working, it would be advantageous to use deletion mapping. We, therefore, isolated a group of am deletion mutants which were subsequently utilized to complete the construction of the am locus map.
2 94 J. A. RAMBOSEK AND J. A. KINSEY MATERIALS AND METHODS
Strains used: Mutant strains aml through am19 and lys-1 were from the authors stock collection. Mutant strains a m l o o through am148 were isolated using the direct selective procedure (KINSEY 1977), and their characterization has been described (KINSEY and HUNG 1981). Mutant strain FK059 was isolated by E. Kafer using the direct selection procedure. Isolation of the ani locus deletion mutants is described in RESULTS of this communication. Stocks used for mapping by flanking marker analysis carried the markers cot-I (allele C102t), rec-3 and either his-1 (allele K83) or ure-2 (allele 47) which were introduced through a series of crosses. The stocks used to introduce these markers were obtained originally from the Fungal Genetics Stock Center, Humboldt State University, Humboldt, California. Stocks used for flanking marker analysis were of mixed genetic background.
Chemicals a d reagetits: The mutagen 1,2,7,8-diepoxyoctane (DEO) was obtained from Aldrich Chemical Company. Most other chemicals were obtained from the Sigma Chemical Company.
Crosses and cross analysis: The techniques used for crosses and for flanking marker analysis were as previously described (KINSEY et al. 1980). Crosses for deletion mapping were made in the same way, however, analysis involved only the measurement of recombination frequency.
Isolation of deletion mutants: am mutants were isolated in either a lys-1 a background (series 23) or lys-1 rot-1 rec-3 a background (series 48 and 73) using the procedure of KINSEY (1977) following mutagenesis with DEO. Previous reports had indicated that D E 0 causes deletions in Neurospora (ONC and DESERRES 1975) and Aspergillus (HYNES 1979). The procedure for D E 0 mutagenesis was as follows: Conidia were treated with 100 mM DE0 for 90 min at room temperature. The incubation was carried out in a large glass centrifuge tube with continuous stirring in 0.067 M
phosphate buffer, pH 7.0, with conidia adjusted to a final concentration of 6 X lo6 conidia/ml. Conidia were washed three times with ice-cold Fries basal medium after the incubation period was completed.
Rapid reaersion S C ~ ~ P I Z : am mutants were screened for putative deletions by characterization for reversion following ultraviolet (UV) irradiation. Conidial suspensions in sterile water were adjusted to an absorbance of 0.5 at 600 nm. One-tenth of a milliliter, containing approximately lo6 conidia, was plated on Vogels minimal salts (VOGEL 1956) containing 1.5% sorbose, 0.2% glucose, 0.2% glycerol agar plus glycine (0.02 M) and exposed to U V (1.71 X lo3 erg/mm2). The number of revertant colonies was compared with control plates containing either atn119, which reverts with a relatively high frequency following UV irradiation, or a??zl32, a large deletion, which is not revert-
able. Mutant strains that did not revert were considered to be putative deletions and further characterized by genetic analysis.
RESULTS
Fla liking marker aizulyis
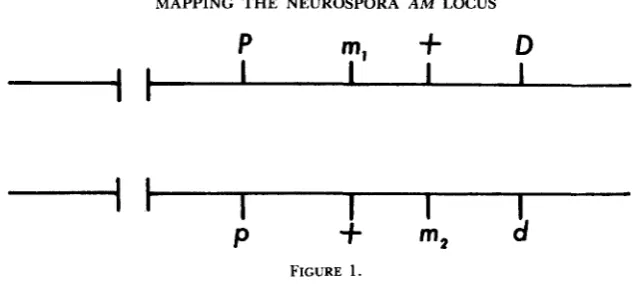
We began to map a m mutants using flanking marker analysis, utilizing the conventions developed by SMYTH (1973). These conventions have been shown to give a genetic map that is colinear with the sites of altered amino acids in mutant forms of GDH (BRETT et al. 1976; KINSEY et al. 1980). Mapping is based on two criteria which can be related to the diagram in Figure 1, in which ml represents the site of the more proximal and m2 that of the more distal of two m n alleles. P,p and D,d are general terms for markers at the centromere proximal and centromere distal ends, respectively, of the am locus. T h e first criterion is based on prototrophic recombinants between different
MAPPING THE NEUROSPORA A M LOCUS 295
P
m1
+
D
I
t
I
I
P
+
m2d
FIGURE 1.
binants which are not recombinant with respect to flanking markers. This criterion states that gene conversion occurs more frequently at the centromere proximal end of the gene than at the distal end; that is, a polarity of conversion exists within the gene. This criterion is empirically derived. Accordingly, the more proximal a m allele is defined as that which entered the cross with the same association of flanking markers represented most frequently among the prototrophic recombinants (i.e., PD
>
pd).In practice, mapping of a m mutants has depended almost exclusively on the polarity criterion, since prototrophic recombinants which are also recombinant for flanking markers generally fail to reveal significant differences between recombinant classes (i.e., pD
=
Pd) (SMYTH 1973; FINCHAM 1974; our results). In our experiments crosses of the general constitution ure-2 am,; rec-3; cot-1X am, his-I; rec-3; cot-1 were made in which ure-2 is the centromere proximal flanking marker, approximately 1 map unit from a m , and his-1 is the centrom- ere distal flanking marker, approximately 1.5 map units from am. T h e cot-1
marker was present in these stocks and produced very compact colonies at
33". Prototrophic a m + recombinants were counted, and the flanking marker constitution of the prototrophs was determined as previously described (KINSEY
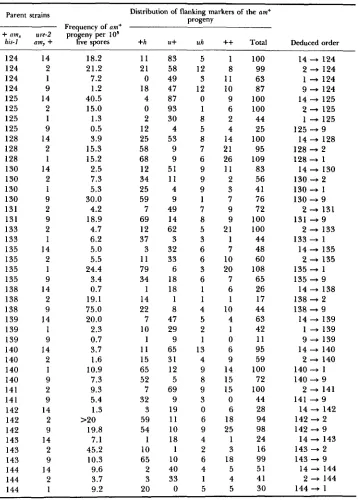
et al. 1980). T h e results of 90 informative crosses involving 30 previously unmapped alleles crossed to various alleles with known map positions are given in Table 1. T h e deduced order is shown for a cross only if the PD class was significantly ( 5 % probability level) greater than the
pd
class. In addition to the data shown in Table 1, all am mutants used were crossed to themselves in opposite mating type and at least 5 Xlo6
viable spores analyzed. No proto- trophic revertants were found for any of these selfing crosses (data not shown). In addition to the informative crosses shown in Table 1 , more than 100 ad- ditional crosses were made that gave significant recombination frequencies (data not shown) but for which either there was no significant bias in parental flanking marker combinations or for which flanking marker analysis was not performed. In these cases, recombination frequency, if it was very low, was taken as a presumption of closeness on the genetic map when deciding which alleles to cross to particular deletion mutants.Isolation of deletion mutants
296 J. A . RAMBOSEK AND J. A. KINSEY TABLE 1
Frrquriirius cold dislributioii of flniikiiig incirkers ninong am prototrophir recombinants
from rrosses o j the geiiernl constitution
+
amx his-I X ure-2 amy+
Distribution of flanking markers of the am+
progeny Parent strains
Frequency of o n + i N I I I , ure-2 progeny per lo5
his-l om, i live spores i h u i uh i+Total Deduced order
100 100 100 101 101 101 101 102 102 102 103 103 104 104 104 104 104 106 106 107 107 108 108 108 108 109 109 110 110 110 112 112 113 113 113 118 118 118 119 119 119 121 121 121 122 122 14 2 9 14 109 2 1 14 2 1 14 1 1 14 109 2 1 9 2 1 1 9 14 109 2 1 14 2 14 2 1 14 2 14 2 1 14 2 1 14 2 9 14 2 1 14 2 0.55 3.5 2.4 1.1 2.0 10.2 38.5 16.3 15.0 2.2 20.8 12.06 1.2 2.3 5.4 11.8 49.5 6.3 13.9 3.2 8.1 3.6 11.4 1.7 9.8 1.2 21.2 17.1 1.9 2.9 5.3 30.0 26.5 11.6 24.4 11.7 3.2 7.6 10.0 1.9 3.2 42.3 21.5 5.3 49.0 35.4 45 13 51 34 2 83 71 34 17 45 21 39 7 37 38 78 69 56 60 61 40 17 1 1 20 73 44 144 2 0 15 9 70 22 70 43 10 24 73 2 5 12 5 20 16 4 22 9 4 14 81 44 25 3 67 48 62 59 20 26 66 14 9 8 22 4 22 16 49 30 9 8 70 64 73 19 3 70 9 65 12 7 67 40 18 60 35 3 82 68 51 60 54 4 0 8 22 1 26 3 0 19 15 17 5 3 3 11 3 7 10 5 17 7 3 9 3 5 4 24 18 8 2 16 14 7 11 43 20 8 9 12 5 6 4 3 3 5 8 4 1 9 15 1 41 2 4 15 29 14 26 1 2 16 12 13 12 11 13 35 5 9 2 0 7 15 4 2 2 5 7 6 7 10 4 5 5 6 8 8 7 9 12 4 8 62 18 82 152 48 175 79 105 99 151 111 90 38 108 79 102 97 100 80 113 98 74 59 34 86 125 247 97 29 22 100 100 100 100 103 101 77 105 80 53 29 98 IO0 82 73 92
100
-
14 100-
2 100-
914 + 101 109 4 101
101
-
2 101 + 11 4 - 102 2 - 1 0 2 1
-
102 14-
103 103-
1114 4 104
109 + 104 104
-
2 1 0 4 - 1 104 + 9 106 4 21 0 6 - 1 107 + 1
IO7
-
9 14-
108 109 + 108 108 + 2 108- 1109 --.* 2 14 4 109
14
-
1102 - 110
14 + 112
1 4 - 113 1 1 0 4 1
112
-
2113
-
2 1 1 3 - 114
-
118 2 + 11814
-
119 2-
11914
-
121 2-
121 1 + 12114
-
122 2 - 122 1 1 8 - 1MAPPING THE NEUROSPORA A M LOCUS TABLE 1-Continued
Parent strains Distribution of flanking markers of the am+ Droeenv
a 0 1 Frequency of am+
+
am, ure-2 progeny per io5his-I amzr
+
live spores +h U+ uh++
Total124 124 124 124 125 125 125 125 128 128 128 130 130 130 130 131 131 133 133 135 135 135 135 138 138 138 139 139 139 140 140 140 140 141 141 142 142 142 143 143 143 144 144 144 14 2 1 9 14 2 1 9 14 2 1 14 2 1 9 2 9 2 1 14 2 1 9 14 2 9 14 1 9 14 2 1 9 2 9 14 2 9 14 2 9 14 2 1 18.2 21.2 7.2 1.2 40.5 15.0 1.3 0.5 3.9 15.3 15.2 2.5 7.3 5.3 30.0 4.2 18.9 4.7 6.2 5.0 5.5 24.4 3.4 0.7 19.1 75.0 20.0 2.3 0.7 3.7 1.6 10.9 7.3 9.3 5.4 1.3 19.8 7.1 45.2 10.3 9.6 3.7 9.2 >20 11 21 0 18 4 0 2 12 25 58 68 12 34 25 59 7 69 12 37 3 11 79 34 1 14 22 7 10 1 11 15 65 52 7 32 3 59 54 1 10 65 2 3 20 83 58 49 47 87 93 30 4 53 9 9 51 11 4 9 49 14 62 3 32 33 6 18 18 1 8 47 29 9 65 31 12 5 69 9 19 11 10 18 1 10 40 33 0 5 12 3 12 0 1 8 5 8 7 6 9 9 9 1 7 8 5 3 6 6 3 6 1 1 4 5 2 1 13 4 9 8 9 3 0 6 9 4 2 6 4 1 5 1 8 11 10 9 6 2 4 14 21 26 11 2 3 7 9 9 21 1 7 10 20 7 6 1 10 4 1 0 6 9 14 15 15 0 6 18 25 1 3 18 5 4 5 100 99 63 87 100 100 44 25 100 95 109 83 56 41 76 72 100 100 44 48 60 108 65 26 17 44 63 42 11 95 59 100 72 100 44 28 94 98 24 16 99 51 41 30 Deduced order
14
-
124 2-
124 1 + 124 9 + 124 14 + 125 2 + 125 1 + 12514 + 128 125 + 9
128 + 2 128- 1
130
-
2 130- 1 130-
9131 + 9
133 + 1 14 + 130
2 + 131
2 + 133
1 4 + 135 2 + 135 1 3 5 + 1 135 + 9
138 + 2 138 + 9
14 + 138
14 --.f 139
1 + 139 9 + 139 14 140 2 + 140 140- 1 140 + 9
141
-
9142 + 2 142 -D 9
143 + 2 143 + 9
2 141
14
-
14214 + 143
14 + 144 2
-
144 1 4 4 + 1298 J. A. RAMBOSEK AND J. A. KINSEY
mapping data, especially when both markers were in the middle of the gene. Therefore, we have isolated and characterized deletion mutants of the am gene and utilized these in the manner devised by BENZER (1959, 1961) to map mutant sites.
Most of the deletion mutants we have mapped were found among DEO- induced mutants that failed to revert following UV irradiation. T h e exceptions are A 7 3 S G 1 and A 7 3 S G 2 , which are spontaneous mutants, and a m l l l , a m 1 2 8 and a m 1 3 2 , which have been previously described (KINSEY and HUNG 1981). T h e frequency of am mutants following D E 0 mutagenesis was approximately 1/106 surviving conida. This figure is about tenfold higher than the frequency of spontaneous a m mutants in the strains used. One observation worth noting is that D E 0 stored at room temperature for several months ceases to be mutagenic for Neurospora conidia while still remaining toxic. We have noted this phenomenon with several lots of DEO.
Of 108 DEO-induced mutants that we have analyzed, 59 failed to revert following UV treatment. These 59 am mutants, as well as four spontaneous mutants with similar UV reversion characteristics, were crossed to a series of 11 point mutants that together span the am locus (SMYTH 1973; KINSEY et al. 1980). As a control the D E 0 mutants were also crossed to a m 1 3 2 which deletes the entire ai~z locus.
T h e idea behind these crosses was that any substantial deletion would fail to show recombination with one or more of these point mutants. Past experience with point mutant crosses had indicated that virtually all point mutant X point mutant crosses (except selfing crosses) yield some recombinants. On the basit of the results of these screening crosses, further crosses of the putative dele- tions would be made to other point mutants that mapped in the indicated area. Since these crosses were intended only for rapid screening, ascospore concen- trations were estimated on the basis of optical density measurements of the spore suspensions. Except as specifically noted an estimated 1 06- 10’ spores were tested for each cross. It should be pointed out that some crosses that gave no recombinants in this test subsequently were shown to give a few recombinants when more spores were analyzed (compare Table 2 with Table 3). Also inherent in this scheme would be the loss of many of the possible small deletions which did not overlap one of the 11 point mutants.
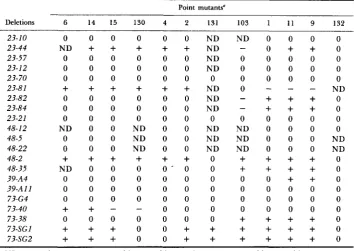
Seventy-one percent (45 of 63) of the nonreverting mutants failed to show recombination with at least one of the 11 point mutants. However, only 21 of these could subsequently be demonstrated to be deletions based on the crite- rion that a deletion must fail to recombine with two or more mutants capable of recombination with each other. Ten of these 21 failed to recombine with any of the strains used, and presumably each deletes the entire a m locus. The results of crosses between these 21 deletion mutants and the 1 1 point mutants and c ( ? ? z l 3 2 are shown in Table 2.
Crosses of coilfirmed deletions to each other and to releuant point mutants
Those strains deleted for part of the am locus were crossed to other am
MAPPING THE NEUROSPORA A M LOCUS 299 TABLE 2
Crosses of pututive deletions to point mutants
Point mutants"
~ ~~~~
Deletions 6 14 15 130 4 2 131 103 1 1 1 9 132
23-10 23-44 23-57 23-12 23-70 23-8 1
23-82 23-84 23-2 1 48-12 48-5 48-22 48-2 48-35 39-A4 73-G4 73-40 73-38 73-SG2 39-A I I
73-SGI
0 0 0
ND
+ +
0 0 0
0 0 0
0 0 0
+
+
+
0 0 0
0 0 0
0 0 0
ND 0 0 0 0 0
0 0 0
+
+
+
ND 0 0
0 0 0
0 0 0
0 0 0
+
+
-0 0 0
+
+
+
+
+
+
0+
0 0 0+
0 0 0 ND ND ND+
0 0 0 0 0 0 0 -0 0 ND
-I-
+
ND0 0 N D
0 0 ND
0 0 0
+ +
ND0 0 ND 0 0 ND
0 0 0
0 0 ND 0 0 ND
0 0 ND
+
+
00 - 0 0
0 0 0
0 0 0
0 0 0
0 0 0
0 0 0
o
+
+
o
+
+
ND 0 0 0 0
-
-
0 ND ND ND+
+
0 0 0 0+
+
+
0 0 0 0
o
+
+
0
0 0 0 0
0 0 0 0
0 0 0 0
+
+
+
0+
+
+
00 0 0 0
0 0 0 0
O O O N D
O O O N D
+
+
+
0+
+
+
0o
+
+
00 0 0 0
0 0 0 0
0 0 0 0
+
+
+
0+
+
+
0+
+
+
0ND
-
-
-ND = not done,
+
= prototrophic recombinants, 0 = no prototrophic recombinants,-
= no " T h e order of the tester strains is centromere oms, ain14, am15...
am,,. umg. Mutant am132 is a prototrophic recombinants but fewer viable spores than needed for conclusive test.complete deletion of the om locus.
that could potentially overlap them. For example, the data in Table
2
indicate that A23-82 is a deletion in which approximately half of the gene correspond- ing to the amino terminus of GDH is missing, with the right end point of the deletion lying between am2 and aln.1. Consequently, all of the alleles mapping in the vicinity of, or in the interval between, am2 and aml were crossed to A23-82 in order to define the right end point of the deletion. Similarly, it can be seen from Table 2 that A73-40 is a deletion in which all of the gene except that corresponding to the amino terminus of GDH is deleted, with the left end point of the deletion lying between am14 and a m 4 . Thus, all of the alleles that mapped near or between am14 and am4 were crossed to A73-40 in order to define the left end point of this deletion. T h e data in Table2
also show A73-SG2 to be a small deletion with both end points in the gene and mapping in the vicinity of the left end point of A73-40. Subsequent crosses to A73-40 and alleles mapping near the deleted region of A73-SG2 were used to show the overlapping nature of A73-40 and A73-SG2 and to define the end points of A73-SG2. Employing similar strategy with the other partial deletions shown in Table 2 and with f"and a m l l l (described later), we were able to define300 J. A. RAMBOSEK A N D J. A. KINSEY
W E
d
m
d
5
m
CO a
d op &
I m d
m
w
s
0
2
P-
a
I I I I I I I I I I I I I I I I I I I I I I I I I I I I
'0
2 (LI
z
'?
MAPPING THE NEUROSPORA AM LOCUS 301
I
33
302
d
4
P
&
a
d
0
x
I .
4
Y
m
MAPPING THE NEUROSPORA AM LOCUS 303
the gene by deletion analyses. T h e mapping crosses of a m alleles crossed to deletion strains are given in Table 3, and the crosses of deletions by deletions are given in Table
4.
During this mapping process it was discovered that the previously described mutants a m 1 2 8 and am111 (KINSEY and HUNG 1981) are also deletion mutants.
a m l l l , which in a previous communication (KINSEY and HUNG 1981) was mis- takenly reported to revert, was found to map in two nonoverlapping deletions, A23-81 and A48-2 (Table 4), and to cover the allele am17 which maps between A23-81 and A48-2 (Table 3). am128 was found to map in A73-40 and A73-SG2 (Table 4) and to cover several alleles that did not map in these deletions (Table
3). Thus, a m 1 2 8 and a m l l l are small deletions, deleting portions of the gene corresponding to the amino terminal and carboxy terminal ends of GDH, respectively. Four DEO-induced mutants-A23-82, A23-84, A48-35 and A73- 38-are identical on a genetic basis; all delete approximately half of the gene corresponding to the amino terminus of GDH. Only results for A23-82 are listed in Tables
2
and 3. Two spontaneous deletions, A73SGl and A73SG2, are also identical on a genetic basis; each deleted a small region of the gene in the vicinity of and including am4. Only results for A73-SG2 are listed in Tables2
and 3.By using a set of nine of these deletion mutant~-am]2~, a m l l l , A73SG2, A73-40, A23-44, A23-82, A23-81, A48-2 and A39-A4-we can easily map any a m allele to one of 13 discrete regions of the gene. We have used this set of deletion strains to map
7
alleles (am16, amFK059, am1179 amlzo, am123, am129 and a ) n 1 3 6 ) for which we previously had no mapping information (Table 3), as well as to complete the mapping of the 49 partially mapped alleles.DISCUSSION
Flu piking ma rker annlyis
We have utilized flanking marker analysis primarily to place mutants sites in one of four segments of the gene. This placement was subsequently corrobo- rated in a few cases by peptide sequence information obtained from analysis of mutant GDH (KINSEY et al. 1980), in one case by DNA sequence analysis from a cloned mutant version of the a m gene
U.
A. RAMBOSEK andJ. A . Kinsey, unpublished results), and in all cases by deletion mapping analysis.In each case we were able to confirm independently the assignment made on the basis of conversion polarity, thus confirming the usefulness of the polarity criterion for mapping at the a m locus. Additional analysis of the var- ious classes of prototrophic recombinants, with respect to flanking markers,
are also consistent with the previous observations of FINCHAM (1964, 1967)
and SMYTH (1973). For example, if all of the crosses are taken together, the mean value for total prototrophs that are also recombinant for flanking mark- ers is 22 & 0.11%. This compares with a value of 29.5% obtained by SMYTH
(1973) and once again indicates that only about 25% of conversion events at the ~ 1 1 7 1 locus are associated with exchange of flanking DNA regions.
3 04 J. A. RAMBOSEK A N D J. A. KINSEY TABLE 4
Selrctrd crosses brtiilrrii drletioiis
Strains crossed
128 x 73SG2 128 X 73-40 73-SG2 X 73-40 48-2 X 1 1 1 23-81 x 111 48-2 X 23-81 23-81 X 39.A4 23-81 X 23-82 111 X 23-82 48-2 X 23-82 73-SG2 X 48-2
Prototrophs per viable spores
0/2.5 X l o 6
0/4.2 X lo6
0/3.1 X lo6 0/6.2 X lo6 29/1.2 X lo6
0/1.6 X lo6
0/8.4 X lo6 0/2.5 X IO6 2/7.6 X IO5 0/2 x IO6
q 4 . 3 x lo6
Prototrophs per IO5 viable spores
0.0
0.0 0.0
0.0 0.0
2.4 0.0 0.21 0.0 0.0 0.26
analyzed, again combining the data from all of our crosses, we find no signif- icant difference between the two classes. This is in contrast to the results of
SMYTH (1973) in which he found a slight, but significant, excess of one class over the other. It was on this basis that SMYTH decided that a9126 represents the centromere proximal end of the gene. Although we have utilized this convention throughout this study, there is no direct support for it in our data.
Deletioil N izcil)jsis
Our early efforts to obtain deletions were not very successful, and it was only when we started to use D E 0 as a mutagen (ONC and DESERRES 1975) that we began to obtain deletions in significant numbers. D E 0 is a bifunctional alkylating agent that is thought to crosslink guanosine residues in adjacent positions on complementary strands (ONC and DESERRES 1975), thus promoting double strand breaks and excision. Altogether, 21 of 108 DEO-induced mu- tations were shown to be deletions; this may represent only a fraction of the actual induced deletions because our method of screening would allow many small deletions to go undetected.
It is interesting to note that about half of the proven deletions cover the entire ~ i i z locus; however, none of these large deletions extend into the nearest known gene, gul-1 (0.3 map units distal to am). This fact, coupled with our repeated failure to obtain a m through gul-1 deletions among mutants selected simultaneously for the gul and criri phenotypes, suggests to us that there is indispensible material between the two sites.
We have isolated five proven deletions not induced by DEO. Two of these were spontaneous, and both of these, A73-SGl and A73-SG2, appear to be identical and probably represent repeat isolations of a preexisting deletion mutation present in the stock used. One of the others, A l l l , was isolated after U V mutagenesis, and two, A128 and A132, were isolated after nitrous acid mutagenesis. All of these non-DE0 mutants are small internal deletions except
A132, which removes the entire aiii locus and considerable material on either side but, once again, not extending to the gul-I locus
U.
A. RAMBOSEK and J.MAPPING THE NEUROSPORA A M LOCUS 305
AI32 A132
A3V-AA
A23-82
A73-40
FIGURE 2.-A fine structure map of the a m locus. See text for detailed explanation. For the purpose of these studies we have chosen to include mutant 23-81 as a deletion, however, its behavior is somewhat anomalous. On the basis of mutant peptide analysis one can assign certain alleles in this region to an unequivocal order (reference to Figure
2
will aid the following discussion). That order is, left to right, am17, am,, am7, a m I P 2 , am3. T h e deletion, A111,covers am17 but none of the other alleles and, therefore, has a righthand end point between am17 and aml. T h e deletion, A39-A4, by the same kind of reasoning, has an end point between am1 and am7. T h e small deletion, A23- 44, has its left end point between am17 and am1 and its right end point between
aml and a m 7 . By analysis of their behavior in crosses to these three deletions, new a m mutations can now be oriented on this map. T h e putative deletion 23- 81 does not cover 0312~7 nor does it appear to cover am,, yet it overlaps Alll and clearly covers am122 and amg. Moreover, it also covers am147 which is in turn covered by
AI
11. Thus, 23-81 has the appearance of failing to recombine with left hand markers Alll and am147, as well as am105 which maps withinA2344 (as does am,). It then recombines with central markers aml, am7 and
a m l l and then fails to recombine with righthand markers am122 and am3 as well
as am116, am117 and “ n 1 2 5 , all of which map to the right of A39-A4. It then recombines with all of the remaining markers that map to the right of A39-
A4. We have shown 23-81 in our map as if it were a continuous deletion, however, it is possible that it represents two small neighboring deletions or that it represents an inverted region. We are currently cloning the 23-81
version of the am gene to sort out the answer to this question.
Fine structure map
T h e current fine structure map of the a m locus based upon previous map- ping experiments (SMYTH 1973; KINSEY et al. 1980) as well as flanking marker analysis and deletion mapping (reported here) is shown in Figure
2.
T h e scale of the map is based on recent nucleotide sequencing data (J. H. Kinnaird and306 J. A. RAMBOSEK AND J. A. KINSEY
are accurately placed based on sequencing of mutant peptides (BRETT et al.
1976; KINSEY et al. 1980) or in the case of am12ti on DNA sequencing data from a cloned ~ 1 j 2 ~ 2 6 version of the a m gene (J. A. Rambosek and J. A. Kinsey, unpublished results). Mutant sites placed just below the line are placed in the correct order, based on flanking marker analysis, but the actual distance be- tween such sites is an estimate, based on recombination frequency. Allele des- ignations placed well above the line are mapped only with respect to deletion end points as indicated by the vertical bars. Deleted regions are indicated by heavy bars below the line. T h e actual end points of the deletions are only estimates, however, the relationship of the end points to defined point mutants are accurate with respect to relative order.
Many of the mutant sites that have been placed only within a given interval as defined by deletion end points are separable by recombination and/or dis- tinguishable on the basis of reversion frequency, complementation, cross-re- acting material production, temperature sensitivity or suppressibility.
We are currently using this more detailed fine structure map to reassess the effects of rec-3 on recombination at the a m locus (SMYTH 1973), utilizing stocks that have been extensively backcrossed to the standard IVA/ORSa reference stocks.
We thank J. R. S. FINCHAM and DAVID STADLER for reading the manuscript and making suggestions. We also thank MALCOLM LUKER who suggested to us that we use D E 0 as a mutagen. This project was supported by grants BRSG SO7 RR 05373 and GM 23967 from the National Institutes of Health.
LITERATURE CITED
BENZER, S., 1959 O n the topology of the genetic fine structure. Proc. Natl. Acad. Sci. USA 4 5
1607-1620.
BENZER, S., 1961 On the topography of the genetic fine structure. Proc. Natl. Acad. Sci. USA
47: 403-415.
BRETT, M., G. K. CHAMBERS, A. A. HOLDER, J. R. S. FINCHAM, and J. C. WOOTTON,
FINCHAM, J . R. S., 1967 Recombination within the a m gene of Neurospora crassa. Genet. Res. 9
FINCHAM, J. R. S., 1974 Negative interference and the use of flanking markers in fine-structure mapping in fungi. Heredity 33: 1 16-1 2 1.
FINCHAM, J. R. S. and A. J. BARON, 1977 T h e molecular basis of an osmotically reparable mutant of lVairosporu c'rassn producing unstable glutamate dehydrogenase. J. Mol. Biol. 1 1 0 627-642.
HYNES, M. J., 1979 Fine structure mapping of the acetamidase structural gene and its controlling region in aspergillus nidulans. Genetics 91: 381-392.
KINNAIRD, J. H., M. A. KEIGHREN, J. A. KINSEY, M. EATON and J. R. S. FINCHAM, 1982 Cloning of the a m (glutamate dehydrogenase) gene of Neurospora crassa through the use of a synthetic DNA probe. Gene 20: 387-396.
Direct selective procedure for isolating Neurospora mutants defective in nicotinamide adenine dinucleotide phosphate-specific glutamate dehydrogenase. J. Bacteriol. 132: 751-756.
New mutational
1976 Mutational amino acid replacements in Ne-urospora crassa. J. Mol. Biol. 106: 1-22.
49-62.
KINSEY, J. A., 1977
KINSEY, J. A., J. R. S. FINCHAM, M. A. M. SIDDIG and M. KEIGHREN, 1980
MAPPING THE NEUROSPORA AM LOCUS 307
KINSEY, J. A. and B. S. T. HUNG, 1981 Mutation at the a m locus of Neurospora crussa. Genetics
ONC, T.-M. and F. J. DESERRES, 1975 Mutation induction by difunctional alkylating agents in
Neurospora crassa. Genetics 80: 475-482.
SEALE, T. W., M. BRETT, A. J. BARON and J. R. S. FINCHAM, 1977 A k o acid replacements resulting from suppression and missense reversion of a chain-terminator mutation in Neuro- spora. Genetics 8 6 261-274.
SIDDIG, M. A. M., J. A. KINSEY, J. R. S. FINCHAM and M. KEICHREN, 1980 Frameshift mutations affecting the N-terminal sequence of Neurospora NADP-specific glutamate dehydrogenase. J.
Mol. Biol. 137: 125-135.
SMYTH, D. R., 1973 A new map of the amination-1 locus of Neurospora crussa and the effect of the recombination-3 gene. Aust. J. Biol. Sci. 26: 1355-1370.
VOGEL, H. J., 1956 A convenient growth medium for Neurospora (medium N). Microbiol. Genet.
WOOTTON, J. C., G. K. CHAMBERS, A. A. HOLDER, A. J. BARON, J. G. TAYLOR, J. R. S. FINCHAM,
K. M. BLUMENTHAL, K. MOON and E. SMITH, 1974 Amino acid sequence of NADP-specific glutamate dehydrogenase of Neurosporn c r a m . Proc. Natl. Acad. Sci. USA 71: 4361-4365.
Corresponding editor: R. C. ULLRICH
9 9 405-414.