THERMAL ANALYSIS OF SAMPLE CONTAINER USED FOR TESTING
OF STRUCTURAL MATERIAL
P Suryanarayana, N K Maheshwari
Reactor Engineering Division, Bhabha Atomic Research Centre, Mumbai, INDIA-400085 E-mail of corresponding author: [email protected]
ABSTRACT
A facility is developed for irradiation of materials at elevated temperatures to study their effect on the physical properties like fracture toughness, impact and tensile strength. The sample of the size of 1TCT (one inch thick compact tension) or equivalent size can be irradiated at a time. This facility is designed and installed in Indian Research Reactor Dhruva. It is part of reactor grade fuel and structural materials development program. The material can be irradiated at elevated temperatures under various neutron fluence. The elevated temperature is achieved due to gamma heating and also by providing insulation all around the sample. The sample is placed inside the reflector region of the reactor to achieve high fluence for the same irradiation time. An analysis is carried out using HEATING5 code to estimate the temperature distribution all over the sample, sample container and sample box. This paper deals with the details of sample container geometry, heat transfer analysis carried out and the temperature distribution obtained.
INTRODUCTION
Irradiation of materials at different fluence and temperatures followed by post irradiation examination of these materials is a well-known technology being followed by the nuclear industry for the study and development of materials used in nuclear reactors. Many facilities existed in BARC for irradiation of materials but not at controlled temperatures. Hence, there is a need for Controlled Temperature Irradiation Facility (CTIF) to study the irradiation behavior of structural materials of different types of Reactors. Therefore, it has been designed with the objective of irradiation of fuel and structural materials like Clad, Pressure Tube, End Fittings, Calandria tube, End Shields etc., at reactor operating temperature. The facility is installed in a radial beam hole of reactor Dhruva.
A cage assembly is used for the irradiation of samples. This assembly consists of sample container, sample box and sample cage and this goes right in the reflector region of reactor. Samples of total volume of 97.65 cc can be accommodated in the sample container. By gamma heating and with adequate insulation around the sample, it is possible to achieve the prescribed temperature in the sample. The prescribed temperature is controlled within a narrow prescribed band by controlling airflow over the sample box.
The irradiation of sample generates heat in it due to attenuation of gamma rays. About 200 watts heat generation is estimated for the carbon steel sample. A steady state heat transfer analysis is carried out using HEATING5 code to estimate temperature distribution all over the sample container and sample box. This paper deals with the details of sample container geometry, heat transfer analysis and the results obtained.
DESCRIPTION OF SAMPLE BOX, CONTAINER AND SAMPLE
The sample box is made of Aluminum and consists of three different compartments. The front and rear compartments have Alumina insulation. The sample is located in the sample container and this sample container is located in the central compartment of sample box. Fig.1 shows isometric half cut view of the sample box with sample container located in the central compartment. The sample is surrounded by Microtherm insulation in the top, bottom and two sides (Fig. 1). This sample box is located on a sample cage, which has Aluminium tubing for supply of air on to the sample box surfaces. Fig.2 shows isometric half cut view of assembly of sample box with container located on sample cage. Air supply tubing is also shown in the Fig. 2.
The air flow comes out from the holes of φ1 mm size provided on the tube along its height for uniform distribution. The air flow on sample box surfaces, maintain the sample temperature within a narrow band. The airflow is controlled by control scheme consisting of thermocouples, temperature indicator, temperature controller, current to pneumatic converter, flow control valve and flow indicator.
surface. Likewise, the top, bottom and side surfaces of sample box are shown in Fig. 1. Various air gaps considered in the analysis are shown in Figs. 3 and 4.
Fig.1: Isometric half cut view of Sample Box & Container Fig.2: Isometric half cut view of Sample Box on Cage
Fig.3: Cut view of sample box with container (Section A-A ) Fig.4: Cut view of sample box with container (Section B-B)
Size of Sample Box = 66(t)x102(w)x96(h) mm Size of Sample container= 25(t)x62.5(w)x60.0(h) mm
THE COMPUTER CODE USED
HEATING5 [1] is an acronym for Heat Engineering and Transfer in Nine Geometries and was developed at Oak Ridge National Laboratory (ORNL). It is a generalized heat conduction code to solve steady-state and/or
Sample
Cage Sample
Box
Sample Container Tube for
air supply
Y Z
X B
B
Y Z
X Front
Surface
Rear Surface Top
Surface Side
Surface
Bottom Surface Sample
Box
Sample Container
Front & Rear Compartments
A
A
C
C’
D D’
X
Z Alumina
Microtherm
Front Surface
Rear Surface
Bottom Surface
Top Surface
Sample
Air Gap 2
Air Gap 1
Air Gap 2
Model is symmetric about Y=0 plane.
Air Gap 3
X Y Side Surface Alumina
conductivity, density and specific heat may be both spatially and temperature dependent. The thermal conductivity may be anisotropic. The code can take heat generation rates dependent on time, temperature and position. It accounts boundary conditions, which may be surface-to-boundary or surface-to-surface, fixed temperature or any combination of prescribed heat flux, forced convection, natural convection, and radiation. The mesh spacing can be variable along each axis.
METHOD OF ANALYSIS
The sample box with front and rear compartments filled with Alumina and sample container located in the central compartment, is modeled in the three dimensional geometry in HEATING5 code. About 200 watts heat is generated in the carbon steel sample. Analysis is carried out in 3-dimensional Cartesian co-ordinate system. The narrow air gaps are modeled and conduction and radiation modes of heat transfer are considered in these narrow gaps. The convective and radiative boundary condition is modeled on outside surfaces of sample box, where these surfaces are exposed either to free or forced convection. Front and rear surfaces are modeled by giving forced convective and radiative boundary conditions. Top, bottom and side surfaces are modeled by giving free convective and radiative boundary conditions. The air gaps are modeled by giving conduction and radiation boundary condition. Air flows on the front and rear surfaces of Aluminium Sample Box, which is supplied through the tubing. An Aluminium tube (Fig. 2) is located in the two corners of Sample cage on which sample box is located. The tube has φ1-mm holes all along its length parallel to the front and rear surfaces of sample box. The assembly is symmetric with respect to width (Y-axis) and so modeled half the model in this direction.
The average temperature of air at inlet and outlet, is taken as ambient temperature surrounding the sample box. Convective heat transfer co-efficients are estimated based on this ambient temperature and given in the input for the code. Surface temperatures are obtained after running of the HEATING5 code.
ESTIMATION OF HEAT TRANSFER CO-EFFICIENTS
The air flow over the front and rear surfaces of sample box are of prime concern to maintain constant temperature of sample at prescribed temperature. The front and rear surfaces have forced convection because of air blast on these surfaces. These surfaces will also have radiative boundary condition because of high surface temperature. The remaining three surfaces (top, bottom and sides) have natural convective boundary condition along with radiative boundary condition. The internal air gaps will have both conduction and radiative heat transfer. Convection boundary condition is given by providing convective heat transfer co-efficient and ambient temperature.
The basic convective heat transfer equation is Q =
h
(
T
1−
T
2)
A
(1) where h= convective heat transfer co-efficient
i) The forced convection heat transfer co-efficient on front and rear surfaces is estimated by using Pohlhausen equation for flow over flat plate. Reynolds number (Re) is estimated based on the velocity of jet and characteristic dimension of the rectangular surface. The co-efficient in the equation is modified from 0.664 to 0.4316 based on the experiments carried out [2].
hf =
3333 . 0 5 . 0
Pr
Re
4316
.
0
for Re<2.0E5 (2)
where hf = forced convection heat transfer co-efficient
ii) The natural convection heat transfer co-efficient (hn) on top flat surface is estimated by the following equation [3].
hn=
333 . 0
Pr)
(
13
.
0
Gr
for GrPr <2.0E8 (3)iii) The natural convection heat transfer co-efficient on vertical side surface is estimated by the following equation [3].
hn=
25 . 0
Pr)
(
56
.
0
Gr
for 1.0E5 < GrPr <1.0E11 (4) iv) The natural convection heat transfer co-efficient on bottom flat surface, facing down is estimated by the following equation [3].hn=
2 . 0
Pr)
(
58
.
RESULTS AND DISCUSSIONS
The temperature distribution in the geometry is determined using Heating5 Code. The analysis is carried out for different cooling air flow rates of 30, 35 and 40 lpm on the front and rear surfaces of sample box. The temperature distribution is given in the following sub-sections.
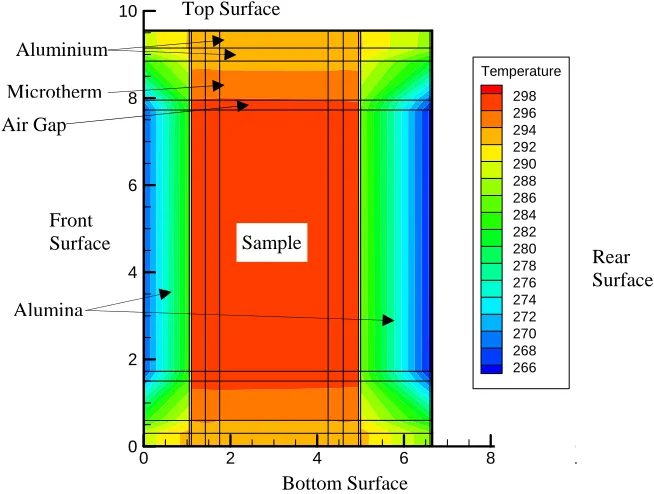
Temperature Contours and distribution for Cooling Flow Air Flow Rate of 35 lpm
The temperature contour at section A-A (Fig. 3) is given in Fig. 5 for a cooling air flow of 35 lpm. This shows that the maximum temperature attained in the sample is ~298 deg. C.
Thickness
H
e
ight
0 2 4 6 8 1
0 2 4 6 8 10
Temperature 298 296 294 292 290 288 286 284 282 280 278 276 274 272 270 268 266
Fig. 5: Temperature Contour at mid plane (section A-A, Y=0 plane)
At the same mid plane, the temperature variation along X-direction (C-C’) and Z-direction (D-D’) are given in Figs. 6 and 7 respectively. In the X-direction (C-C’), the steep fall is in air gap compared to the relatively lesser steep drop in Alumina. In the Z-direction (D-D’), the temperature drop is in Microtherm insulation.
Fig. 6: Temperature Variation along C-C’ from Fig. 7: Temperature Variation along D-D’ from front to rear Surface (Y=0 plane) bottom to top Surface (Y=0 plane)
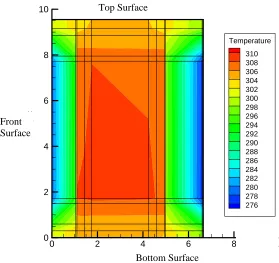
Temperature Contours and distribution for Cooling Flow Air Flow Rate of 30 lpm
The temperature contour at section A-A for a cooling air flow of 30 lpm is given in Fig. 8. This shows that Sample
Microtherm
Air Gap Aluminium
Alumina Front Surface
Rear Surface
Thickness
He
ig
h
t
0 2 4 6 8 1
0 2 4 6 8 10
Temperature
310 308 306 304 302 300 298 296 294 292 290 288 286 284 282 280 278 276
Fig. 8: Temperature Contour at mid plane (section A-A, Y=0 plane)
Temperature Contours and distribution for Cooling Flow Air Flow Rate of 40 lpm
The temperature contour at section A-A is given in Fig. 9 for a cooling air flow of 40 lpm. This shows that the maximum temperature attained in the sample is ~288 deg. C.
Thickness
H
e
ight
0 2 4 6 8 10
0 2 4 6 8 10
Temperature 288 286 284 282 280 278 276 274 272 270 268 266 264 262 260 258 256
Fig. 9: Temperature Contour at mid plane (section A-A, Y=0 plane) Front
Surface
Rear Surface
Bottom Surface Top Surface
Front Surface
Rear Surface
CONCLUSIONS
An analysis has been carried out for different flow rates of air by using HEATING5 code. Three-dimensional Cartesian co-ordinate system is used in the analysis. The temperature distribution for different air flow rates has been obtained. The temperature of about 300 deg C for sample is achieved with a cooling air flow of 35 lpm.
REFERENCES
[1] Turner, W.D., Elord, D.C., Siman-Tow, I.I., “Heating5 Manual”.