Transactions of the 17th International Conference on
Structural Mechanics in Reactor Technology (SMiRT 17) Prague, Czech Republic, August 17 –22, 2003
Paper # O01-6
The use of Acoustic Monitoring to Manage Concrete Structures in the Nuclear
Industry
Peter O. Paulson1), Oliver Tozser1), Marcel de Wit2)
1)Pure Technologies Ltd.
2)Advitam Northern Europe
ABSTRACT
Concrete and steel are widely used in containment vessels within the nuclear industry. Both are excellent acoustic transmitters. In many structures tensioned wire elements are used within containment structures. However, tensioned wire can be vulnerable to corrosion. To reduce the probability of corrosion sophisticated protection systems are used. To confirm that the design strength is available through time, extensive inspection and maintenance regimes are implemented.
These regimes include tests to confirm the condition of the post-tensioning, and pressure tests (leak tests) to verify the performance of vessel.
This paper presents an acoustic monitoring technology which uses widely distributed sensors to detect and locate wire failures using the energy released at failure. The technology has been used on a range of structures including post-tensioned concrete bridges, suspension bridges, buildings, precast concrete cylinder pipelines (PCCP) and prestressed concrete containment vessels (PCCV), where it has increased confidence in structures and reduced maintenance costs.
Where the level of ambient noise is low then SoundPrint® acoustic monitoring can detect concrete
cracking. This has been shown in PCCP pipelines, on laboratory test structures and also in nuclear structures. The programme has shown that distributed sensors can locate internal cracking well before there is any external evidence.
Several projects have been completed on nuclear vessels. The first has been completed on an
Electricité de France (EDF) concrete test pressure vessel at Civaux in France. The second at
the Sandia PCCV Test Vessel in Albuquerque, New Mexico, USA, which involved the testing of a steel lined concrete vessel. The third was on a PCCV in Maryland, USA.
1. INTRODUCTION
Continuous acoustic monitoring has been used since 1994 to monitor failures in bonded and unbonded tendons in post-tensioned structures, where it has shown major benefits in confirming the performance of structures, increasing Client confidence and reducing maintenance costs. To extend the application of this technology to the monitoring of concrete cracking required that the effectiveness of the principles and methods was evaluated for each structural type.
For acoustic monitoring technology to function in a particular environment it must be shown that the signals generated by cracking can be detected above general noise levels and distinguished from events which are not of interest. Furthermore, to assess the structural implication of each event it is generally important to be able to locate the source of each emission. Provided with high quality data of this type,
the engineer can appraise a structure with knowledge of the actual failures in damaged elements, and
their location, in the entire structure over the monitoring period. The alternative, to base the assessment on a
physical inspection at a sample of locations, leads to uncertainty when for practical and economic reasons the number of inspection points is limited. Monitoring the entire structure may also reveal failures not detectable by a conventional investigation.
In many applications the acoustic data is transmitted over the Internet for processing and analysis. After processing and quality control checks, the data can be made available on a secure section of the
SoundPrint® website, allowing owners rapid independent access to their database of results.
SoundPrint® acoustic monitoring systems have also been placed on structures, which are in active
seismic zones. Rapid status reports on wire failures / structural damage allows Owners and Regulators to assess the condition of a structure within a few hours.
The technology is useful in providing cost-effective long-term surveillance of both unbonded and grouted post-tensioned containment structures. This paper shows how the technology can also monitor the cracking of concrete structures which are subject to low levels of ambient noise.
2. DEVELOPMENT OF CONTINUOUS ACOUSTIC MONITORING
The principle of examining acoustic emissions to identify change in the condition of the structural elements is not new. However, until recently, continuous, unattended, remote monitoring of large structures was not practical or cost-effective. The availability of low-cost data acquisition and computing hardware, combined with powerful analytical and data management software, resulted in the
development of a continuous acoustic monitoring system called SoundPrint®, which has been
successfully applied to unbonded post-tensioned structures in North America since 1994.
Corrosion of the steel strands in these post-tensioned structures has become a concern for designers and owners. As with grouted post-tensioned bridges, the extent of corrosion is not known, primarily because of the difficulty of identifying corrosion due to the inaccessibility of the corrosion sites, the lack of external evidence and the limited spatial coverage of intrusive inspections.
The SoundPrint system uses the distinctive acoustic characteristics of wire breaks to separate them
from other acoustic activity on a structure. Using a combination of instrumentation, data acquisition and data management, it is possible to identify events, as well to locate the failure and time of failure.
This concept allows the non destructive identification of broken strands, so that these strands can be replaced periodically as part of a long term cost effective structural health programme. In addition, an understanding of the condition of the steel wire elements allows the life of the structure to be extended.
to the concrete slab. Sensor locations are chosen so that an event occurring anywhere on the slab can be detected by at least four sensors. Sensor spacings range from 1 per 60 square meters for fully grouted slabs up to 1 per 100 square meters for ungrouted tendons. Multiplexing techniques are able to acquire data from many hundreds of channels on 32 acquisition channels.
Figure 1 – Standard sensor for buildings, bridges and parking structures
Figure 2 – Time domain and frequency spectrum plots of wire break detected by sensor 10.0 m. from event
Figure 3 – Time domain plot showing relative arrival time of signal at different sensors
Figure 3 – Time domain plot showing relative arrival time of signal at different sensors
Volts
Time Frequency
Using several characteristics of the acoustic events including frequency spectrum it is possible to classify wire breaks and to reject environmental noise.
By analyzing the time taken by the energy wave caused by the break as it travels through the concrete to arrive at different sensors, the software is able to calculate the location of the wire break, usually to within 300 – 600 mm of the actual location. Independent testing showed the system to be 100% correct when spontaneous events classified as “probable wire breaks” were investigated. Figure 2 shows a typical acoustic response to an unbonded wire break at a sensor 10.0 m from the break location. Figures 3 and 4 illustrate how the system locates events.
SoundPrint® site systems download all data automatically using the Internet to the Calgary processing
semi-automatically using e-mail, automatically voice activated phone alarms, etc.
Presently, over 300,000 square meters of unbonded post-tensioned slab in twenty structures, five bridges and almost 100km of large diameter water pipe are being simultaneously monitored. The analytical software is capable of automatically generating reports summarizing the time and location of wire breaks and other significant events. The operating efficiency of the system over the monitoring period is also recorded.
3. MONITORING OF WIRE BREAKS IN GROUTED POST-TENSIONED BRIDGES
Acoustic monitoring has been used in a wide range of applications including suspension and cable stay bridges (reference J.F. Elliott), and pipelines (reference Mark Holley).
The technology has also been applied on many post-tensioned concrete bridges as described at this conference (reference Carlyle, Adkins, Youdan).
4. MONITORING OF CRACKING DEVELOPMENT IN CONCRETE STRUCTURES
Description of Concrete Projects
During the UK TRL grouted post-tensioned bridge evaluation program, the developers of the acoustic monitoring system, Pure Technologies Ltd (Pure) and TRL had the opportunity to evaluate the application of the method to crack development in a partially hollow reinforced concrete beam specimen. This specimen was tested with three-point loading.
Dr. Walter Dilger of the University of Calgary provided access to a flat post-tensioned slab specimen. The slab was 5 m by 10 m by 150 mm thick supported by 3 columns and tested in shear.
Electricité de France allowed access to a large-scale model prestressed concrete containment vessel at Maeva being tested with internal pressure. This vessel has part of the perimeter wall instrumented for crack detection. This specimen had previously been tested to the same pressures used in the current experiment.
At the Sandia National Laboratories in Albuquerque, New Mexico, a ¼ scale test vessel was pressured to the full ‘failure’ test pressure in a modification of a standard leak rate test. The objective was to monitor concrete cracking, tearing of the liner, and gas leakage.
Finally in Maryland, US an operating PCCV was tested during an Integrated Leak Rate Test to determine if any wire failures were recorded.
Transport Research Laboratory, UK
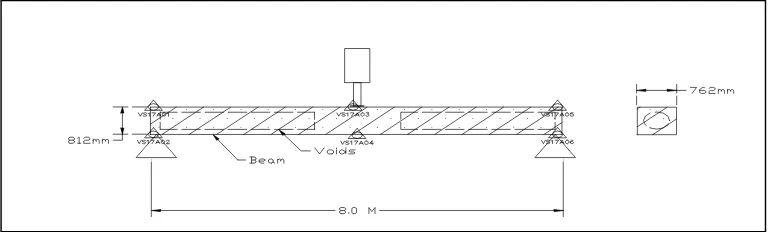
A partially-voided reinforced concrete bridge beam was loaded as shown in Figure 5.
Figure 5 - Arrangement of Test Specimen VS17
VS17A01
VS17A02
VS17A05
VS17A06 VS17A03
VS17A04
[1]
[2]
[3]
[4] [7][8]
[9]
[10]
[11] [12]
[13] [14]
[15]
[16] [17]
[18]
[19]
[20] [21]
[22] [23][24]
[25]
[26]
Figure 6 – Location of Events from 0 kN to 30 kN (0 to 6,700 lbf)
VS17A01
VS17A02
VS17A05
VS17A06 VS17A03
VS17A04
[1]
[2]
[3] [6] [4] [8][9][5] [7]
[10] [11]
[12]
[13] [14] [15]
[16] [18] [19]
[20]
[21] [22][23]
Figure 7 – Location of Events from 30 kN to 100 kN (6,700 lbf to 22,500 lbf)
VS17A01
VS17A02
VS17A05
VS17A06 VS17A03
VS17A04
[1]
[2]
[3]
[4]
[5]
[6] [7]
[8] [9] [10][13] [11] [12] [14] [16] [15] [17]
[18]
[19] [20]
[21]
[22]
[23] [25] [24][26] [27]
[28] [29]
[30] [31]
[32] [33]
[34] [35]
[36] [37] [38]
[39] [41] [40]
[42] [43]
[44] [45]
[46] [47]
[48][49] [52] [51] [50] [53] [54]
[55] [56] [57][58][59] [60]
[61]
[62]
[63] [64]
[65]
[66]
[67] [68] [69]
[70]
[71] [72]
[73]
[74]
[75][76] [77]
[78]
[79] [80] [81][82][83]
[84]
Figure 8 – Location of Events from 100 kN to 200 kN (22,500 lbf to 45,000 lbf)
Results
As used here, ‘cracking noise’ means the generation of acoustic events associated with the propagation of cracks, some of which were not visible. Amplification through the data acquisition system produced audible cracking noise throughout most of the test. No sounds were heard or recorded during periods when displacement had stopped. Acoustic events were located as plotted in Figures 6, 7 and 8.
equipment were able to direct researchers to the area where cracks had occurred, resulting in the visual confirmation of cracks at those locations.
Crack Monitoring at University of Calgary
Procedure
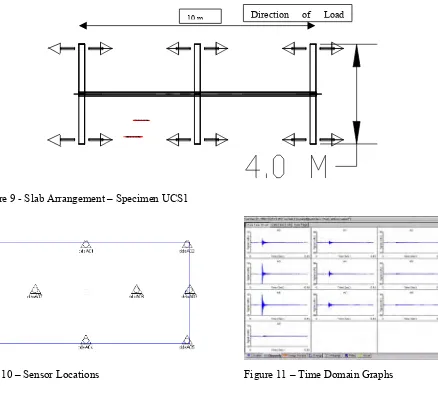
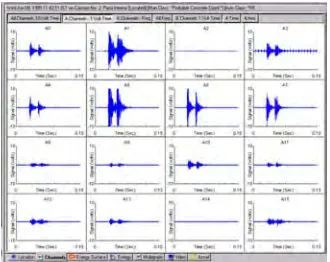
Ten accelerometers were attached to the underside of the test slab. The slab-column arrangement is shown in Figure 9 and sensor locations are shown in Figure 10. Lateral motion of the slab was commenced and the resulting cracking events were heard and recorded. Upon first loading of the specimen, a very large number of small emissions were heard. This is known as the Kaiser. This effect describes the generation of acoustic events coincident with initial load sharing and redistribution when a concrete specimen is first loaded to a given level. Subsequent unloading and reloading to the same level will not produce new acoustic events until the previous maximum load is exceeded. The rate of occurrence of these emissions is estimated at between 10 and 100 per second in the specimens tested at the rate of loading used. A sample of the time-domain data is shown in Figure 11. Each graph represents the output of one sensor.
Figure 9 - Slab Arrangement – Specimen UCS1
Figure 10 – Sensor Locations Figure 11 – Time Domain Graphs
Results
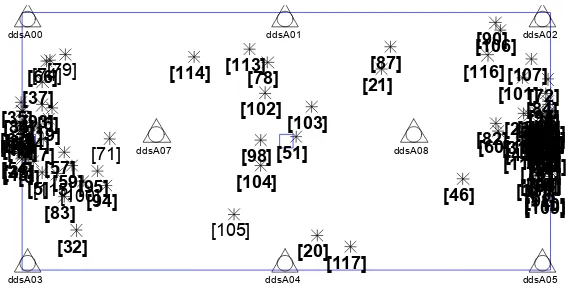
Amplification through the data acquisition system produced audible cracking noise throughout most of the test. No sounds were heard or recorded during periods when displacement had stopped. The locations of these events are shown in Figure 12.
As was the case with the TRL test, it was possible to direct researchers to the location of cracking before the cracks were visible. The locations of cracks identified by the acoustic system coincided with the confirmed locations as determined by the researchers.
ddsA00 ddsA01 ddsA02
ddsA05
ddsA03 ddsA04
ddsA07 ddsA08 ddsA09
ddsA06 [1] [2] [3] [4] [5] [6] [7][8] [9] [10] [11] [12] [13] [14] [15] [16]
[17][19] [18]
[20] [21] [22] [23] [24] [25] [26] [27][28][29] [30] [31] [32] [33] [34] [35] [36] [37] [38] [39] [40] [41][42] [43] [44] [45] [46] [47] [48] [49] [50] [51] [52] [53] [54] [55] [56] [57] [58] [59] [60] [61] [62][63] [64] [65] [66] [67] [68] [69] [70] [71] [72] [73] [74] [75] [76] [77] [78] [79] [80] [81] [82] [83] [84] [85] [86] [87] [88][89] [90] [91][92] [93] [94] [95] [96] [97] [98] [99] [100] [101] [102] [103] [104] [105] [106] [107] [108] [109] [110] [111] [112] [113] [114] [115] [116] [117]
Figure 12 – Event Locations
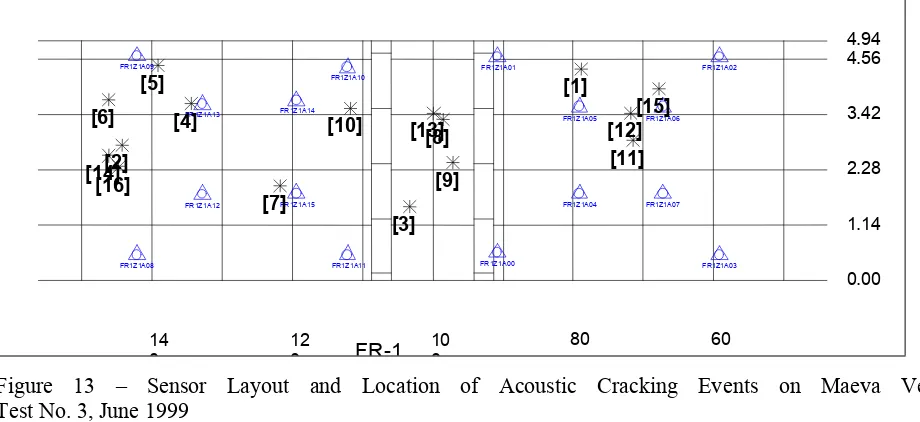
Maeva Model Containment Vessel
The Maeva vessel was built for other purposes relating to internal pressure testing. The vessel consists of a cylindrical wall with an internal diameter of 16.0 m (52.5 ft.) and an external diameter of 18.4 m (60.4 ft.). The floor and roof of the vessel consist of concrete slabs connected by four columns each containing sixteen x 75 mm (3 in.) high-strength steel Macalloy bars. The concrete wall is enclosed by a watertight steel bulkhead. Instrumentation has been installed on two panels of the vessel to confirm the ability of the acoustic monitoring system to detect cracking of the concrete as pressures change. The programme includes a medium pressure test to 5.66 bars (82.1 psi) (which has been completed) and a high-pressure test to 10 bars (145 psi) (which is to be completed later). Because the vessel had previously been pressurized to a greater pressure than was used in the medium pressure test, the vessel was not expected to produce the Kaiser effect cracking.
FR1Z1A09
FR1Z1A13 FR1Z1A14
FR1Z1A10
FR1Z1A15 FR1Z1A12
FR1Z1A08 FR1Z1A11 FR1Z1A00
FR1Z1A01
FR1Z1A05
FR1Z1A04
FR1Z1A06
FR1Z1A07 FR1Z1A02
FR1Z1A03
10 0 12
0 14
0 FR-1 80 60
0.00 1.14 2.28 3.42 4.56 4.94
[1]
[2]
[3] [4]
[5] [6]
[7]
[8]
[9] [10]
[11] [12] [13]
[14]
[15]
[16]
Figure 13 – Sensor Layout and Location of Acoustic Cracking Events on Maeva Vessel Test No. 3, June 1999
First Results
Sixteen acoustic cracking events were detected and located. Of these, events numbered 2, 6, 14 and 16 occurred outside the area monitored and therefore could not be accurately located. Locations of events are shown on Figure 13. The largest cracking events were detected at locations 1, 5, 6, 12 and 15. Comparison with a known impact from a Schmidt hammer suggests that some of the cracking events released approximately 1 Joule of energy. Event #1, the first large event, occurred at an internal pressure of 3.01 bars (42.66 psi). Maximum pressure achieved was approximately 5.66 bars (82.09 psi). Events 15 and 16 occurred after the pressure began decreasing, at 5.65 bars (81.95 psi) and 5.46 bars (79.19 psi) respectively. Time domain and frequency spectrum plots for Event #1 are shown in Figures 14 and 15.
To confirm the relationship between acoustic events and cracks it is common to correlate the visible surface evidence of cracks and the measured locations of the acoustic cracking events. This process is
limited by the fact that cracking events recorded by SoundPrint® may reflect cracks that are internal to
the structure. Also a visual inspection will normally only record cracks that are of the order of 0.2 mm
(0.008 in.) wide, whereas SoundPrint® will record cracks finer than this. For this test vessel two
additional factors are relevant. The first is that no crack survey was taken before this latest phase of the testing commenced, and the vessel had previously been taken to higher pressures than were used in this phase of testing. The second is that the internal surface of the concrete had been treated with a thin layer of epoxy, which would have the effect of reducing the clarity of the any crack survey. However, a preliminary crack survey was carried out after the medium pressure tests and this survey will be repeated after the high pressure tests.
Figure 14 - Time Domain Plot of Sensors Responding to
Crack #1. Figure 15 - Frequency Domain Plot of Sensors Responding to Crack #1.
Outline Details of the Sandia Test
In a US project sponsored by MITI and the National Research Council (NRC), a one-quarter scale model of a steel lined containment vessel has been constructed at Sandia National Laboratories in Albuquerque, New Mexico. The model is approximately 16.5 m (54 ft.) high and 11 m (36 ft.) in diameter. The objective of the work was to validate numerical simulation methods by comparing measured to calculated responses well into the inelastic regime, up to and including failure. The intention was to map the development of strains and eventual damage as the pressure in the vessel is brought above the design pressure of the vessel. Although more than one thousand strain and other gauges were installed on the vessel, much of the vessel was not monitored by strain gauges. Acoustic monitoring was being installed on the entire vessel wall area as part of the programme to detect tendon failures and with the hope of monitoring concrete cracking and liner tearing/leakage. The system has been specially configured to stream data offsite to a back-up computer incase the onsite unit is
destroyed during the test. Preliminary details of the test are reported by Hessheimer5. Results of this
test will be published first by the NRC in 2001. See Appendix A for update to June 2001.
PCCV Maryland
This vessel is approximately 42m diameter reinforced with two sets of circumferential tendons. A total of 204 tendons are present; a normal tendon is comprised of 90No. 6mm wires.
The vessel was monitored with 36 distributed acoustic sensors, which were placed on the external concrete surface. The vessel was tested during an Integrated Leak Rate Test. Surveillance of the vessel was by on-site monitoring in real time during the test. During the ILRT zero wire breaks were recorded. To confirm the performance of the acoustic monitoring system events were generated using impacts with a similar energy (and a similar acoustic signature) to a wire break. Impacts made at anchorage cans, were correctly identified and located. This was quite an achievement as some of the cans were less than 1m apart. See Appendix A for update to June 2001.
5. SEISMIC MONITORING
In numerous applications Owners need to know the effect of a seismic event on their structures. This is particularly important in seismically active zones and in the nuclear sector where seismic standards are rigorous. In California where there is a statutory requirement to report on the effect of a seismic event
within 24 hours, SoundPrint® acoustic monitoring has been used to provide rapid and relevant details to
East Bay Municipal District of Southern California - Brookwood Reservoir
Above ground prestressed water storage tanks are common in many areas of the world, including California. Failure of these tanks due to corrosion or other factors can be catastrophic. To investigate the usefulness of long term acoustic monitoring as a management tool, the East Bay Municipal District of Southern California commissioned the installation of a monitoring system on the Brookwood reservoir, a 10 million litre (264,00 US gal) capacity tank in the Walnut Creek area East of San Francisco.
As part of the commissioning process, two individual wires were corroded to failure and the results monitored with the system installed there. Both wire breaks were detected and located successfully within 300 mm (1 ft.) of the actual location.
At 18:06 on 17 August 1999 there was a Mercalli 5 earthquake in the Bay Area of California. At 23:04
SoundPrint® recorded 1 wire break at the water tank resulting from the earthquake some 30-km (19 mi.)
distant. Details of this minor damage were e-mailed to the owner within hours. With this data the owner was able to report quickly, and positively, recording only minor damage. With the proven success of the system the owner is planning to extend the number of structures monitored.
If many sites were monitored, the owner can also use the rapid notification capability of the system to direct emergency repair teams to the areas where most damage has occurred in the event of a large earthquake.
6. SUMMARY
Continuous remote acoustic monitoring has been used successfully to determine the time and location of wire breaks in prestressed structures. Testing of the technique as a method of detecting cracking in concrete structures subject to loading has been carried out on post-tensioned and reinforced concrete structures of different configurations. On two of the three structures tested, the locations of cracks identified by the monitoring system were confirmed by visual inspection. Crack development was detected by the monitoring system before cracks became visible.
The SoundPrint® acoustic system has been shown to provide reliable continuous remote monitoring
capability and the ability to determine the times and locations of both prestressing failures, concrete cracking and liner tearing/leakage. These capabilities are useful in providing cost-effective long-term surveillance of unbonded and grouted post-tensioned containment structures, and of cracking within the concrete itself where ambient noise levels are low.
SoundPrint® has been shown to be a valuable management tool where rapid monitoring of seismic
ACKNOWLEDGEMENTS
The authors thank TRL and the UK Highways Agency, Dr. Walter Dilger, University of Calgary, and Electricité de France for use of these data. The authors wish to thank the many individuals and agencies who contributed to the gathering of these data.
REFERENCES
1. J.F. Elliott. Continuous Acoustic Monitoring of Bridges. International Bridge Conference, 1999, Pittsburgh, Pennsylvania IBC-99, pp. 70.
2. M.F.Hessheimer, D. W. Pace, E. W. Klamerus, T. Matsumoto, and J. F. Costello. Instrumentation
and Testing of a Prestressed Concrete Containment Vessel Model. 14th International Conference on
Structural Mechanics in Reactor Technology, Lyon, France, 1997, pp 792-1, 792-9.
3. M. Holley, Acoustic Monitoring of Prestressed Concrete Cylinder Pipe. American Society of Civil Engineers, Pipelines in the Constructed Environment, California, USA, 1998, pg 468
4. F. Carlyle, A. Adkins and D.Youdan. The Use of Acoustic Monitoring to Extend the Life of
Post-Tensioned Overbridges at Huntingdon and Mossband, UK. Structural Faults & Repair 2001, 9th
APPENDIX A - UPDATE TO JUNE 2001
SANDIA TEST VESSEL
The PCCP model structure discussed in this section of the paper was constructed by Sandia National Laboratories in New Mexico in cooperation with the Nuclear Power Engineering Corporation (NUPEC) of Japan and the US Nuclear Regulatory Commission (NRC). The purpose is to investigate the
integrity of nuclear containment structures Hessheimer2. A 1:4 scale model of a prestressed concrete
containment vessel (PCCV) of a pressurized water reactor (PWR) plant was instrumented and tested to failure. The model was tested in a number of phases, the final of which, the high pressure "Limit State Test" (LST), was completed in September 2000. The detailed results of the test programme are to be presented by the NRC in the near future. This update refers to summary information from the acoustic
monitoring programme which have already been summarised Hessheimer 2,5.
The prestressed concrete containment vessel (PCCV) model is a uniform, 1:4-scale model of the containment structure of Unit 3 (pressurized water reactor - PWR) of the Ohi Nuclear Power Station in Japan. The Ohi-3 containment vessel is a steel-lined, prestressed concrete cylinder with a hemispherical dome and two vertical buttresses, Figure 16. The design pressure of the model was 0.39 MPa. Hessheimer reports that Sandia personnel installed nearly 1500 transducers to monitor the strain, displacement, forces, temperatures and pressures in the model. Unfortunately over half of the strain gauges installed on the tendons were damaged during prestressing operations, nevertheless, enough survived to provide useful data on the tendon response during prestressing and pressurization tests.
Additional instrumentation included a SoundPrint acoustic monitoring system. Fifty-four acoustic sensors were positioned on the structure, thirty-eight on the external surface, and another sixteen on the internal surface of the steel liner.
Pressure testing of the model consisted of a series of static pressurization tests of increasing magnitude ranging from 0.5Pd to 3.3Pd before the leak rate exceeded the capacity to pressurize the model.
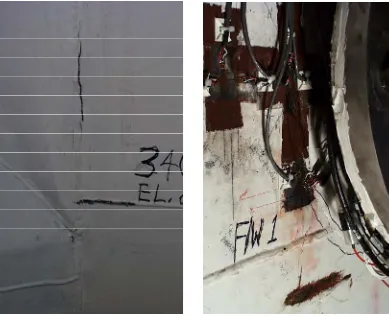
Subsequent visual inspection showed a series of tears in the liner and cracks within the concrete. Figure 17 is a developed elevation of the PCCV model showing the location of the liner tears. A series of acoustic events, keyed to the pressure levels at which they were observed are also shown in the figure. The acoustic data, along with the liner strain data, strongly suggests that the liner first tore at the edge of the equipment hatch embossment at approximately 2.5Pd, while the tears at either end of the Feed water penetration insert plate occurred very near the end of the LST around 3.0Pd, Figure 18.
The acoustic monitoring was able to detect the location from which the gas leaked, when the leaks started, and when the leakage stopped. In addition numerous concrete cracking events were recorded and located in regions where concrete cracking were observed.
32.5 cm
27.5 cm
22.5 cm (8 7/8”)
1.6 mm liner 45° 15°
(12 13/16")
537 cm (17'-7
5
/8")
1075 cm (35'-3 1/4")
1140 cm (37'-4 7/8")
(10
13
/
16") 565 cm (18'-6
7
/
16
")
1640 cm (53'-9
5
/
8
")
1075 cm (35'-3
1 / 4") 350 cm (11'-5 13 / 16 ")
720 cm (23'-7 7/16")
18 hoop tendons
90
hoop tendons
90 meridional hairpin tendons (45 E/W, 45 N/S)
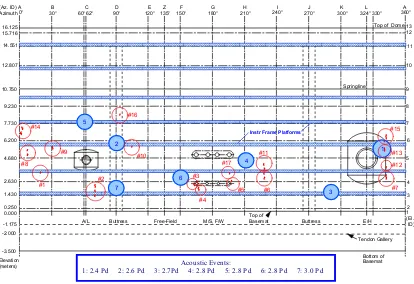
0° 62° 90° 180° 270° 324° CL Equipment Hatch CL Personnel Airlock Buttress 537.5 cm CL Main Steam & Feedwater Penetrations Buttress
Figure 16 Prestressed Concrete Containment Vessel (PCCV) Model Geometry
180° 270° 90° 0° 62° E/H M/S, F/W A/L 12 3 4 5 6 7 8 9 10 11 12 13 B C
A D E F G H I J K L A
16.125 15.716 14.551 12.807 10.750 9.230 7.730 6.200 4.680 2.630 1.430 0.250
0.000 Top of
Basemat
Springline
Top of Dome
Tendon Gallery Bottom of Basemat -1.175 -2.000 -3.500 Z Free-Field Buttress Buttress
30° 60° 120° 135° 150° 210° 240° 300° 324° 330° 360°
Elevation (meters) (El. ID) Azimuth (Az. ID)
Instr Frame Platforms
1 3 4 6 2 5 7 Acoustic Events:
1: 2.4 Pd 2: 2.6 Pd 3: 2.7Pd 4: 2.8 Pd 5: 2.8 Pd 6: 2.8 Pd 7: 3.0 Pd
#14 #8 #1 #9 #2 #16 #10 #3 #4 #5 #6 #11 #15 #13 #12 #7 #17
Figure 18 Liner Tear at Locations 15 (Equipment Hatch) and 3 (Feed water Penetration)
Calvert Cliffs Nuclear Power Station - Maryland
During a routine Integrated Leak Test (ILT) on the Unit 2 Calvert Cliffs PCCV, SoundPrint Acoustic Monitoring was included within the programme to monitor the performance of the post tensioning wires.
For this vessel the wall is 21.30m / 69'-9" in radius; tendons are in two rings: 19.11m / 62'-7 13/16" and 19.62m / 64'-3 7/8" from centre of the vessel. There are a total of 204 tendons, and a 'normal' tendon is comprised of 90 wires. Tendon anchorage is the button head system, and each wire is 5mm - 1/4" in diameter.
Thirty-six sensors were placed on the structure to monitor potential wire breaks in vertical tendons. Before and after the leak rate tests, the acoustic monitoring system was calibrated using blind tests to confirm that it would record and locate events with an energy representative of a wire break within the vessel. The calibration exercise correctly identified 100% of the locations at which the test impact had been made, even though the anchorage were within 1 metre of each other.
During the pressurization process no wire breaks were recorded.
Before and after the 50-hour ILT some of the anchorage cans were X-rayed to confirm their condition. X ray photos confirmed that no wire breaks were present. Acoustic surveillance of the vessel was by on-site monitoring in real time for the duration of the ILT pressurization test.
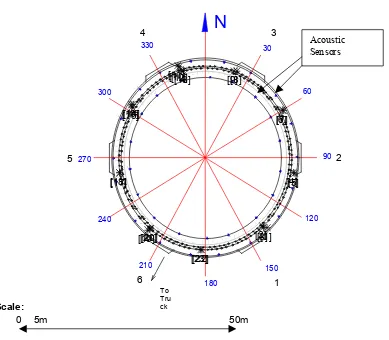
Figure 19 shows a cross section showing the structure layout with the sensor positions, and the location of selected acoustic events.
12V18 12 V0 4 12 V0 3 12 V0 6 12 V0 5 12 V0 8 12 V0 7 12 V1 0 12V09 12V12 12V1112V1312V14
12V16 12V15 12V17 12V20 12V19 12V22 12V21 12V24 12V23 12V26 12V25 12V28 12V27 12V30 12V29 12V32 12V31 12V34 12V33 23V02 23V01 23V04 23V03 23V06 23V05 23V08 23V07 23V10 23V09 23V12 23V11 23V14 23V13 23V16 23V15 23V18 23V17 23V20 23V19 23V22 23V21 23V24 23V23 23V26 23V25 23 V2 8 23 V2 7 23 V3 0 23 V2 9 23 V3 2 23 V3 1 23 V3 4 23 V3 3 34 V0 2 34 V0 1 34 V0 4 34 V0 3 34 V0 6 34 V0 5 34 V0 8 34 V0 7 34 V1 0 34 V0 9 34 V1 2 34 V1 1 34 V1 4 34 V1 3 34 V1 6 34 V1 5 34 V1 8 34 V1 7 34 V2 0 34 V1 9 34 V2 2 34 V2 1 34 V2 4 34 V2 3 34 V2 6 34 V2 5 34 V2 8 34 V2 7 34 V3 0 34
V2 9 34 V3 2 34
V3 1 34 V3 4 34 V3 3 45 V0 2 45
V0 1 45 V0 4 45 V0 3 45 V0 6 45 V0 5 45 V0 8 45
V0 7 45 V1 0 45V09 45V12 45V11 45V14 45V13 45V16 45V15 45V18
45V17 45V20 45V19 45V22 45V21 45V24 45V23 45V2645V25 45V28 45V27 45V30 45V29 45V32 45V31 45V34 45V33 56V02 56V01 56V0456V03 56V06 56V05 56V08 56V07 56V10 56V09 56V12 56V11 56V14 56V13 56V16 56V15 56V18 56V17 56V20 56V19 56V22 56V21 56V24 56V23 56V26 56V25 56 V2 8 56 V2 7 56 V3 0 56 V2 9 56 V3 2 56 V3 1 56 V3 4 56 V3 3 61 V0 2 61 V0 1 61 V0 4 61 V0 3 61 V0 6 61 V0 5 61 V0 8 61 V0 7 61 V1 0 61 V0 9 61 V1 2 61 V1 1 61 V1 4 61 V1 3 61 V1 6 61 V1 5 61 V1 8 61 V1 7 61 V2 0 61 V1 9 61 V2 2 61 V2 1 61 V2 4 61 V2 3 61 V2 6 61 V2 5 61 V2 8 61 V2 7 61 V3 0 61 V2 9 61 V3 2 61 V3 1 61 V3 4 61 V3 3 12 V0 2 12 V0 1 A13 A15 A17 A19 A2 1 A2 3 A2 5 A2 7 A29 A31 A33 A35 A0 1 A0 3 A0 5 A0 7 A0 9 A11 A34 A00 A0 2 A0 4 A0 6 A0 8 A1 0 A12 A14 A16 A18 A2 0 A2 2 A2 4 A2 6 A2 8 A32 A30 60 3 30
N
2 120 90 150 1 180 330 4 300 210 6 To Tru ck 270 240 5 Scale:0 5m 50m
[1] [2][3] [4][5] [6][7] [8] [9] [10]
[11][12][13]
[14] [15] [16]
[17] [18]
[19][21][20]
[22] [23]
Acoustic Sensors
Figure 19 Calvert Cliffs Layout Drawing Unit 2, Showing Sensor Locations
Acknowledgements
The authors would like to acknowledge Sandia National Laboratories, NUPEC, NRC, and Constellation Energy.
References