A
PROBABILITY MODELFOR
EVALUATING THE RANDOMNESSO F THE
ASSORTMENT OF CHROMOSOMES DURINGSOMATIC REDUCTION
SHU GENG, JAN DVORAK A N D PAUL SCHNEEMAN
Department of Agronomy and Range Science, University of California, Davis, California 95616
Manuscript received July 17, 1978 Revised ropy received November 13, 1978
ABSTRACT
Pollen mother cells with reduced numbers of chromosomes have been
observed in wheat, its hybrid derivatives and amphiploids. Models are pre- sented here for calculating the exact probability of the occurrence of any
particular combination of single chromosomes and chromosome pairs in any
reduced cell. Hence, it is possible to evaluate randomness of chromosome assortment in somatic reduction. Several sets of data reported by other in- vestigators on somatic reduction in Triticum are analyzed, and we conclude that in those instances chromosomes assort at random.
BERRANT somatic or meiotic cells with reduced chromosome numbers have
A
been reported in diverse plant taxa. Such cells are often found in interspe- cific hybrids and their derivatives, as well as in polyploids. Reduction of chromo- some numbers can also be induced by artificial means (HUSKINS 1948; HUS-KINS and CHENG 1950; WILSON and CHENG 1949; WILSON, HAWTHORNE and
Tsou 195 1 ; YOSHIDA and YAMAGUCHI 1973). In polyploids, preferential separa- tion of the chromosomes :of specific genomes has been suggested by MENZEL
{ 1952), MENZEL and BROWN (1952)
,
SNOAD (1955),
BAMMI (1965), CARLBOM[ 1969) and LADIZINSKY and
FAINSTEIN
(1978).In wheat and in artificially produced amphiploids or hybrid derivatives, re- duced p l l e n mother cells (PMC) can be found at metaphase I (HOLLINGSHEAD
1932; LOVE 1936, 1938; SACHS 1952; KNOTT 1956; CARLBOM 1969; ORLOVA
1976). Information on chromosome pairing in these PMC's can be used to infer whether chromosomes are assorted randomly in somatic reduction and whether they are specifically arranged in the nuclei of somatic cells.
If
homologous chromosomes and the chromosomes of the same genome in polyploids are in proximity. as suggested by FELDMAN, MELLO-SAMPAYO and SEARS (1966) andFELDMAN and AVIVI (19T3), &en nonrandom assortments of chromosomes in
reduced cells should be frequently observed. CARLBOM (1969) observed a PMC with 14 bivalents in a hexaploid Triticum aestiuum plant and concluded that wheat genomes separated from each other in the reduced cell. However, SACHS
(1952) and KNOTT (1956) concluded that the numbers of bivalents and uni-
566
valents in reduced cells suggest that the assortment of chromosomes in somatic reduction is random with respect to the separation of homologues.
Since the numbers of bivalents and univalents in reduced cells are variable, there is need for a probability model that can be used to test whether the ob- served number of bivalents in a reduced cell represents a random or nonrandom assortment of chromosomes. Such a model is reported here.
THE MODEL
Let us consider the following situation:
k
bivalents are found in a reduced PMC containing y chromosomes (instead of theN
chromosomes in a normal unreduced cell), and a maximum ofK
bivalents can occur in the normal cell, that is, the euploid will be K”, a monosomic or monosomic addition will beK”
4-
l’, a trisomic will be K”+
1”’,
and so on. This paper describes probability models for the number of chromosome pairs in reduced cells in the euploid and monosomic plants. Probability models for trisomic and other chromosome types can also be derived, based on similar logic.If all chromosomes are distributed randomly in the cell, each will have an equal chance to be included in the reduced cell. Hence, the number of combina- tions with
k
pairs in a reduced cell from a normal cell withK
possible pairs is C ( K , k ) , whereC(K,k)
= K ! / k !( K - k )
! is the usual notation for a binomial coeffi- cient. The number of combinations of (y-2k) unpaired chromosomes is C ( K - k 7 y - 2 k ) ~ 2 ~ * * . The probability of observingk
pairs in a cell with ychromosomes produced by somatic reduction of a normal cell with
N
chromo- somes can be calculated by dividing the product of the two combinations by the total number of ways in which y chromosomes can be taken from the N-chromo- some cell. That is,P ( k j y : N ) = C(K,k).C(K-k, y-2k).2--2k/C(N7y), ( 1 )
where P ( k / y : N ) represents the probability of observing
k
pairs of chromosomes for a given reduced cell with y chromosomes from an ordinary N-chromosome cell. The limits ofk
are max ( 0 , ( y - K ) } Ik
5 [ y / 2 ] , where max { } represents the maximum of the two values in the bracket, andI]
] means truncating the number to an integer if y is an odd number. With a slight modification, the probability function for an odd numberN
of typeK”
4-1) can also be constructed:P(k1y:N) =
C(K,k).2P*”1/C(N7y)
(2)if
k
= y - (N+1)/2= C ( K , k ) C ( K - k , y-2k).(N-yf1)2V--2’”/
c
( N , y ) . (N-2y+
2k+l)if max ( 0 , (y-N/2-0.5)} 5 k 2 [ y / 2 ]
MODEL FOR CHROMOSOME ASSORTMENT
567
E(kjy:N) = y(y-l)/2(N-l) for K” type f o r K“
+
1’ type= y.(y-l)/2N
and
Var
( k
j
y : N ) = y ( y-1). (N-y) . ( N - y-1 ) /2 (N-I ) 2. ( N - 3 ) for K” type= y’ ( y-1 ) * ( N - y ) . (N-y+l ) /2N2. (N-2) for k”
+
1’ typewhere E ( ) and Var ( ) are, respectively, operators of expectation and variance. Certain properties can be identified for the probability models of chromosome types of K” and K”+l’. Given an integer C, 1 I C I [ y / 2 ] ,
E(kjy1:N)
= E(kly2:N)+
c
and
Var(kly,:N) = Var(kly,:N),
where yl = K - C and yz = K
4-
C for a K“ type, and y l = K-
C f 1 and y 2 = K+
C+
1 for a K”+
1’ type. In fact, for the yl and y2 defined above,P ( k ] y 1 : N )
=P(k+Cly2:N)
(3)These properties reveal that the probability functions for reduced cells are symmetric with respect to the haploid number of chromosomes, K for the K”
type, or (K-I) for the K”i-I’ type of cells.
Furthermore, there is a simple relationship between the probability models of
the K” and the ( K - 1 ) ” f l ’ types. That is, for an even integer
N ,
P ( k 1 y : N ) = P ( k 1 y : N - I )
.
(4)
The relationship demonstrates that the probabilities of observing
k
pairs of chromosomes in a reduced cell of y chromosomes are identical whether the origi- nal unreduced cell hasN
or (N-I) chromosomes( N
is even). Note that this is not true if (N-I ) is replaced by (Ni-1) in equation ( 4 ) . These properties simplify the computation of probabilities required to evaluate the randomness of the process of chromosome reduction for these two types of somatic cells.In fact, the probability function for all types of cells can be expressed in the following most general form,
P ( k l y : N ) = nC(ni, y J / C ( N , y )
where ni is the number of chromosomes in the irh set of homologues in the original cell and yi is the number of chromosomes in the it” set of homologues that is present in the reduced cell. However, the limits of
k
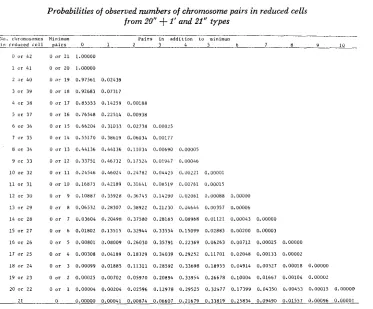
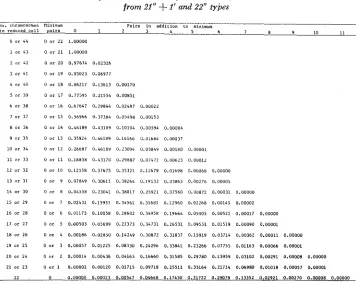
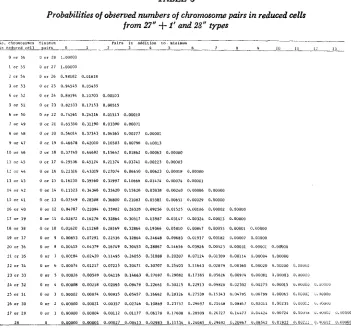
cannot be specified in a general form for all cases.The probabilities of all possible k and y are shown in Tables 1, 2 and 3, for plants (e.g., wheat) with 41 or 42 chromosomes, 43 or
44
chromosomes, and55
or 56 chromosomes, respectively. In each table, the “minimum pair”TABLE 1
Probabilities of observed numbers of chromosome pairs in reduced cells from 20"
+
1' and 21" types___ -
\o. c l ~ ~ o n o s o ~ ~ e s M i n i m m Pairs in addition to m i n i m m
i n r e d u c e d ~ c l l pairs 0 1 2 3 4 5 6 7 n Y 10
0 or 4 2
1 o r 4 1
2 o r 40
3 or 39
4 O T 3 8
5 o r 37
6 or 3b
7 or 35 M or 34
9 or 3 3 1 0 or 32
11 o r 3 1 1 2 or 30 1 3 o r 29
1 4 or 28
1 5 or 27
1 6 o r 2 6
1 7 o r 25 18 or 2 4
19 or 23 20 or 2 2
0 o r 2 1 1.00000
0 o r 20 1.00000 0 o r 1 9 0.97561 0.02439
0 or 18 0.92683 0.07317
o U T 17 0.8555) 0.14259 0.00188 0 o r 16 0.76548 0.22514 O.OOY38
0 o r 1 5 0.66204 0.31033 0.02738 0.00025 0 o r 14 0.55170 0.38619 0.06034 0.00177 0 o c 1 3 0.44136 0.44136 0.11034 0.00690 0.00005
0 o r 1 2 0.33751 0.46712 0.17524 0.01947 0.00046
0 o r 11 0.24546 0.46024 0.24782 0.04425 O.i)0221 0.00001
o i o 0.16875 0.42189 0 . 3 1 6 4 1 0 . 0 8 5 1 ~ 0.00761 o . o o o i 5 0 or 9 0.10887 0.15928 0.36745 0.14290 0.02061 0.00088 0.00000 0 or 8 0.06532 0.28307 0.38922 0.21230 0 . 0 4 6 4 4 0.00357 0.0000b
o 7 0.03604 0.20498 0.37580 o . z ~ ( i 8 5 0.08968 0.01121 0.00043 o.ooooo
0 o r 6 0.01802 0.13515 0.32944 0.33554 0.15099 0.02883 0.00200 0.00003 0 or 5 0.00801 0.08009 0.26030 0.35791 0.22369 0.06263 0.00712 0.00025 0.00000
o or 4 o.00308 0.041~19 o . i n 3 2 9 0.34039 0.29252 0.11701 0 . 0 ~ 0 4 8 0.00133 0.00002 0 or 3 0.00099 0.01885 0.11311 0.28592 0.33698 0.18955 0.04914 0.00527 0.00018 0.00000 0 or 2 0.00025 0.00702 0.05970 0.20894 0.33954 0.26678 0.10004 0.01667 0.00104 0.00002 0 o r 1 0.00004 0.00204 0.02596 0 , 1 2 9 7 8 0.29525 0.32477 0.17399 0.04350 0.00453 0.00015 0.00000
2 1 o o.ooooo o.ooo4i 0.00874 0.06607 0.21679 0.33819 0.25n34 0.09490 0.01557 0.00096 o.oooo1
ability is given for observing the minimum pair number plus the number of additional pairs listed at the top oi each column. For example, in Table 1
,
if there are 38 chromosomes in a reduced cell from a 42 chromosome parent, the prob- ability that we observe 19 (17-i-2) pairs is 0.00188. Figure 1 shows the means and variances of bivalents in reduced cells for the 21" type.DISCUSSION
HUSKINS
(1948) emphasized the possible importance of somatic reduction inplants. The question has been raised whether the distribution of chromosomes in somatic reduction is random or involves either a preferential separation of homologues or a preferential incorporation of both homologues into the reduced cell (WILSON and CHENG 1949; SACHS 1952; KNOTT 1956; YOSHIDA and YAMA-
GUCHI 1973). If separation of homologues occurs, few bivalents can be observed
569 MODEL FOR CHROMOSOME ASSORTMENT
TABLE 2
Probabilities of observed numbers of chromosome pairs in reduced cells from 21” f I ’ and 22” types
P a i r s in a d d i t i o n t m alniioum
No. cliromosomes Mininum
in reduced cell lairs 0 1 2 3 4 5 6 7 8 9 10 11 0 or 44
1 or 43 2 or 4 1 3 o r 4 1
4 o r 40 5 or 39
6 or 38
7 or 37
8 o r 36 9 or 35
10 or 34
11 or 3 3 1 2 or 32
13 or 31
1 4 or 30 15 or 29
16 or 28 I 7 or 27
18 or 26 1 9 or 25 20 or 24 21 or 23
0 or 22 1.00000 0 or 2 1 1.00000 0 or 20 0.97674 0.02326 0 or 1 9 0.93023 0.06977
o 01 18 0.n6217 0.13613 o.ooi70
0 or 17 0.77895 0.21554 0.00851
0 or 16 0.67647 0.29844 0.02487 0.00022
0 o r 15 0,56966 0.37384 0.05498 0.00153
0 or 1 4 0.46189 0.43109 0.10104 0.005Y4 0.00004
0 or 13 0.35924 0.46189 0.16166 0.01684 0.00037
0 o r 1 2 0.26687 0.46181) 0,23094 0.03849 0,00180 0.00001
o or ii 0.18838 0.43170 0.29887 0.07472 0.00623 0.00012
0 O r 10 0.12558 0.37675 0.35321 0.12679 0.01698 0.00068 0.00000 0 or 9 0.07849 0.30611 0,38264 0.19132 0.038b3 0.00276 0.00005 0 or 8 0.04558 0.23041 0.38017 0.25921 0.07560 0.00872 0.00031 0 or 7 0.02431 0.15951 0 . 3 4 5 6 1 0.31681 0.12960 0.02268 0.00142 0 or 6 0.01173 0.10058 0.28602 0.34958 0.19664 0.05005 0.00521 0 or 5 0.00503 0.05699 0.21373 0.34731 0.26531 0.09551 0.01519
0 or 4 0.00186 0.02850 0.14249 0.30872 0.31837 0.15919 0.03714
0 or 3 0.00057 0.01225 0.08330 0.24296 0.33841 0.23266 0.07755 0 or 2 0.00014 0.00436 0.04165 0.16660 0.31585 0.29780 0.13959 0 or 1 0.00002 0.00120 0.01715 0.09718 0.25511 0.33164 0.21714
0.00000 0.00002 0.00017 0.00000 0.00090 0.00001
0.00362 0.00011 0.00000 0.01163 0.00066 0.00001 0.03102 0.00291 0.00009 0.00000 0.06980 0.01018 0.00057 0.00001
22 0 0.00000 0.00023 0.00547 0.04648 0.17430 0.31722 0.29079 0.13352 0.02921 0.00270 0.00008 0.00000
cells is random and whether the assortment of chromosomes in the reduction process is random. W-hen a decision must be made regarding how many pairs of chromosomes are too many or too few, the probability models provided in this paper can be used to define the critical values. The applications of the derived models are not limited to any particular plant species. However, we will demon- strate the usefulness of the application of these models by examining some pub- lished Triticum data, which leads to sigdicant biological inference.
Table
4
presents the probabilities for each aberrant cell computed from dataof LOVE (1939, 1938),
SACHS
(1952) and KNOTT (1956). Except for three cases,the probabilities of observing such combinatioiis of bivalents and univalents in these cells are high ( P
>
0.05). It should be pointed out that due to asynapsis, the number of bivalents observed in a reduced PMC may be lower than the actual number of chromosome pairs present in the cell. The numbers of bivalents and univalents in the reduced PMC’s listed in Table 4 deviate, however, more-or-less symmetrically in both directions from the most probable number of chromosome pairs, suggesting that those cells were not asynaptic. Analysis of the frequencies of bivalents and univalents in reduced PMC’s listed in Table 4 supports SACHS’5
70 S. GENG, J. DVORAK A N D P. SCHNEEMANTABLE 3
Probabilities of observed numbers of chromosome pairs in reduced cells
from 27"
+
I' and 28" types-__ _. .~ .___
Pairs in rddllion I D minimulo
_.
b o . chromosomes ,linimun
i n r e d t i r e d cell mic~ 0 1 _L_ 3 4 5 6 7 n Y IU 1 1 i 1 3
0 n r 54 1 or 55
L O r 5*
1 O r 53
4 O r 52 5 o r 5 1 6 or 50 7 or 6 9
8 or 4 8 Y or 4 7 10 or 4 6
I, O r i s
I 2 o r 1 4 1 3 or 4 3
14 or I 2 15 o r 4 1 1 6 or 40
17 or 3 9 18 or 38 1 9 or 37 20 or 1 6 2 1 or 35
22 or 1 4
23 o r 3 3
24 or 32 25 or I1
26 or 3 0 27 Or 2 9
0 O r i n 1.onooo
0 or 2 7 1.00000
0 o r 2 6 0.98162 0.01m
U o r 25 0.96545 0.05451 0 o r 24 0.89194 0.10703 0.00103 0 or 2 3 0.82333 0.17153 0.00515 0 or 22 0.76261 0.2b216 0.01513 0.00010 0 or 21 0.65350 0.31190 0.03390 0.00071 0 01 20 0.56014 0.37310 0.06365 0.00277 0.00001 0 or 19 0.66678 0.42010 0.10503 0.00796 O.UO013 0 or 18 0.37760 0.64692 0.15662 0.01862 0.00061 0.00000 0 or I 7 U.29536 0 . & 5 1 2 4 0.21374 0.03741 0.00223 0.00001 0 o r 16 0.22316 0.43319 0.17076 0.06650 0.00623 0.00018 0.00000
0 or 15 0.16230 0.39560 0.31997 0.10666 0.01111 0.00076 0.00001 0 or 14 0.11323 0.34316 0.15620 0.15626 0.03038 0.00240 0.00006 0.00000 0 or 13 0.07549 0.28308 0.36800 0.21013 0.05581 0.00611 0.00029 0.00000 0 O T 12 0.04787 0.22094 0.35902 0.26328 0.09256 0.01525 0.00106 0.00002 0.00000 0 or 11 0.02872 0.16276 0.32864 0.30517 0.13987 0.03147 0.00324 0.00011 0.00000 0 o r 10 0.01620 0.11268 0.28169 0.12864 0.19366 0.058lO 0.00847 0.00053 0.00001 0.00000 0 o r 9 0.00853 0.07291 0.22536 0.12861 0.2&648 0.09683 0.01917 0.001112 0.00001 0.00000 0 or 8 0.00415 0.04379 0.16749 0.10453 0.28867 0.14656 0.03926 0.00521 0.00031 0.00001 0.0IpJOU 0 or 7 0.00184 0.02420 0.11695 0.26051 0.31088 0.20207 0.07121 0.01309 0.0011G 0.00001 0.00000
0 or 6 0.00074 0.01217 0.07225 0.20471 0.30707 0.25103 0.11643 0.0287Y 0.00360 0.00020 U.00000 0.0UUliZ 0 or 5 0,00026 0.005b9 0.04116 0.14663 0,27697 0.29082 0.17115 0.05626 0.00974 0.00081 0.00UO3 U.ilOiiUJ 0 or 4 0.00008 0,00218 0.02095 0.09479 0.22661 0.30215 0.22913 U.OYBI0 0.02301 0.00275 0.00015 U.UUI)OY U.iiUOui
0 o r 3 0.00002 0.00014 0.00935 0.05457 0.16662 0.28326 0.2753Y 0.113&1 U . 0 4 1 9 5 U.UU799 0.OOUbJ 0.OUI)U. r.JUO0U
0 o r 2 0.00000 0.00021 U.00357 0,02746 0,10869 0.23757 0.19697 O . Z l i 4 8 0 . 0 8 8 1 1 0.02011 0.00135 U.UV3:. U . i O U U U 0 or 1 0.00000 0,00004 0.00112 0.01171 0.06178 0.17608 0.28509 0.24727 0.14677 U.01(.21 O . U O 7 2 4 0.001110 U.,JI'UL12 U.110000
28 0 0.00000 0.00001 0.00027 0.00113 0.02983 O . L l l 3 4 0.2hOB5 0,29492 O.ZO961 il.OLlil2 0.01922 O.OU2-I? Y . , l U O i Z U.UU(I00
of chromosomes into the reduced cells is determined neither by genome relation- ship nor by their homology.
The numbers of bivalents in reduced PMC's can be used to obtain information on the spatial distribution of chromosomes at the moment when reduction occurs.
If somatic reduction is a single step process, such as a split-spindle mitosis, which separates chromosomes into several groups, both members of one homologous pair should be preferentially incorporated into the reduced nucleus if they are asso- ciated at the moment of reduction. The analyses of LOVE'S, SACHS', and KNOTT'S
data suggest that either homologous chromosomes are not closely associated at the moment of reduction or that somatic reduction is achieved by a process other than the split-spindle mitosis.
FELDMAN
with his associates, MELLO-SAMPAYO andSEARS 1966; FELDMAN, MELLO-SAMPAYO and AVIVI 1972) used a different ap-
M O D E L FOR CHROMOSOME ASSORTMENT
I I I I
I
1.5571
CHROMOSOME NUMBER IN REDUCED CELL
FIGURE 1.-Expected number of bivalents and variances of observed number of bivalents
in reduced cells from 21” type.
1973). Since the frequencies of bivalents in the reduced cells analyzed here
do
not indicate preferential assortment of chromosomes, it is obvious that additional evidence on the mechanism of the somatic reduction in wheat is needed to resolve the apparent conflict between these two lines of investigation.
We wish to thank one of the reviewers for suggesting the generalized probability function.
LITERATURE CITED
BAMMI, R. K., 1965 “Complement fractionation’’ in a natural hybrid between Rubus procerus
Muell, and R . laciniatus Willd. Nature 208: 608.
CARLBOM, C., 1969 Premeiotic reduction in Agrostis L., Potentila L. and Triticum L. Hereditas
61: 421423.
FELDMAN, M., T. MELLOW-SAMPAYO and E. R. SEARS, 1966 Somatic association in Triticum aestivum. Proc. Natl Acad. Sci. U.S. 56: 11%1199.
FELDMAN, M., T. MELLO-SAMPAYO and L. AVIVI, 1972 Somatic association of homologous
chromosomes in Triticum aestivum. Chromosoma (Berl.) 37: 209-222.
FELDMAN, M. and L. AVIVI, 1973 The pattern of chromosomal arrangement in nuclei of com- mon wheat and its genetic control. Proc. 4th Intern. Wheat Genet. symp., Columbia, Mis-
HOLLINGSHEAD, L., 1932 The occurrence of unpaired chromosomes in hybrids between varieties
HUSKINS, C. L., 1948 Segregation and reduction in somatic tissues. I. Initial observation on
souri, 675-684.
of Triticum vu2gare. Cytologia 3 : 119-141.
5 S. GENG, J . DVORAK A N D S C H N E E M A N
TABLE 4
Probabilities of observed numbers of chromosome pairs in reduced pollen mother cells in wheat and a wheat
x
Triticum ovatum amphiploidChromosome Chromosome
number Pairs Frequency Probability number Pairs Frequency Probability
(Love (1936), N = 4 2 )
21 7 1 0.0949
(Love (19381, N = 41)
20 5 1 0.3248
20 6 2 0.1740
2 1 6 1 0.2583
2 1 7 3 0.0949
22 4 1 0.1298
22 6 1 0.3248
23 6 5 0.3395
2 3 7 1 0.2668
25 7 2 0.3404
26 7 1 0.2603
27 9 5 0.3355
28 7 3 0.0360*
28 8 3 0.2050
28 9 1 0.3758
29 9 1 0.2831
30 10 2 0.3593
*P < 0.05
(Sachs (1952), N = 5 6 )
11 0 1 0.2954
1 3 1 1 0.1623
1 7 1 3 0.1628
1 7 2 2 0.3286
20 3 3 0.3045
20 5 2 0.1466
2 1 4 1 0.3109
23 5 1 0.2908
28 7 1 0.2949
28 8 2 0.2097
28 10 2 0.0192*
35 1 0 2 0.2605
42 14 2 0.1132
(Knott (1956), N = 42)
20 4 2 0.2952
20 5 2 0.3248
20 7 1 0.0435*
22 5 2 0.2952
22 6 1 0.3248
22 7 2 0.1740
HUSKINS, C. L. and K. S. CHENG, 1950
KNOTT, D. R., 1956
LADIZINSKY, G. and R. FAINSTEIN, 1978
Theoret. Appl. Genet. 51: 159-160.
On the occurrence of haploid pollen mother-cells in a uulgare wheat. Nature
138: 589-590. -, 1938 Somatic variation of chromosome numbers in hybrid wheats.
Genetics 23: 517-522.
Polygenmic hybrids in Gossypium. 111. Somatic reduction in a pheno-
typically-altered branch of a three species hexaploid. Am. J. Bot. 39: 625-633.
Polygenomic hybrids in Gossypium. 11. Mosaic
formation and somatic reduction. Am. J. Bot. 39: 59-69.
Segregation and reduction in somatic tissues IV. Re-
A case of somatic reduction in a premeiotic cell in wheat. Can. J. Bot. 34:
A case of genome partition in polyploid oats.
ductional groupings induced in Allium cepa by low temperature. J. Heredity 41: 13-18.
831-832.
LOVE, R. M., 1936
MENZEL, M. Y., 1952
M O D E L F O R C H R O M O S O M E A S S O R T M E N T
5
73ORLOVA, I. N., 1976 Causes of masaicism of the sporogenous tissue with respect to chromosome
SACHS, L., 1952 Chromosome mosaic in experimental amphidiploids in the Triticinae. Heredity
SNOAD, B., 1955 Somatic instability of chromosome number in Hymenwallis calathinum. He-
WILSON, G. B. and K. C. CHENG, 1949 Segregation and reduction in somatic tissues 11. T h e
WILSON, G. B., M. E. HAWTHORNE and TE MAY Tsou, 1951 Spontaneous and induced variation
YOSHIDA, H. and H. YAMAGUCHI, 1973 Arrangement and association of somatic chromosomes
Corresponding editor: R. W. ALLARD
numbers in microsporocytes of hexaploid triticale. Genetika 12 : 7-13.
6: 157-170.
redity 9: 129-134.
separation of homologous chromosomes in Trillium species. J. Heredity 40 : 3-6.
i n mitosis. J. Heredity 42: 183-189.