Advance in Smart Grid by Embedding a
Last Meter in Internet of Things
A.V.V. SATYANARAYANA & NADIPALLI ARCHANA
Abstract—The customer domain of the smart grid natu-rally blends with smart home and smart building systems, but typical proposed approaches are “distributor-centric” rather than “customer-centric,” undermining user acceptance, and are often poorly scalable. To solve this problem, we propose a detailed architecture and an implementation of a “last-meter” smart grid—the portion of the smart grid on customer premises—embedded in an internet-of-things (IoT) platform. Our approach has four aspects of novelty and advantages with respect to the state of the art: 1) seamless integration of smart grid with smart home applications in the same infrastructure; 2) data gathering from heterogeneous sensor communication protocols; 3) secure and customized data access; and 4) univocal sensor and actuator mapping to a common abstraction layer on which additional concurrent applications can be built. A demonstrator has been built and tested with purposely-developed ZigBee smart meters and gateways, a distributed IoT server, and a flexible user interface.
Index Terms—Demand side management, internet of things, power meter, smart grid, telemetering.
I. INTRODUCTION
T
HE LAST-METER smart grid is the portion of the smart grid closer to the home, and the one with which customers interact. It allows a two-way data flow between customers and electric utilities, transforming the “traditionally passive end-users into active players” [1] in the energy market.Considering the seven domains of the conceptual model of smart grids proposed by the National Institute of Standards and Technology [2], [3], the last-meter smart grid corresponds to the “customer domain.” It enables residential, commercial, and industrial customers—based on their different energy needs—to optimize energy consumption and local generation,
Manuscript received December 17, 2013; revised May 21, 2014 and July 8, 2014; accepted July 18, 2014. Date of publication August 27, 2014; date of current version December 17, 2014. This work was supported in part by the European Nanoelectronic Initiative (ENIAC) Joint Undertaking grants ERG (EneRgy for a Green) Society under Contract 270722-2, and in part by E2SG (Energy to Smart Grid) under Contract 296131, in part by the Ministry of Economic Development through the Cleverhome grant under Grant B01/0741/X16, in part by the Tuscany Region through the Smart Energy Distribution Project, and in part by Quantavis s.r.l. Paper no. TSG-00922-2013.
E. Spanò, S. Di Pascoli, and G. Iannaccone are with the Polo Universitario Sistemi Logistici and Dipartimento di Ingegneria dell’Informazione, University of Pisa 56122, Italy (e-mail: [email protected];
[email protected];[email protected]).
L. Niccolini was with the University of Pisa, Livorno, Italy; and is now with Riverbed Technology, San Francisco, CA 94107 USA (e-mail:
Color versions of one or more of the figures in this paper are available online athttp://ieeexplore.ieee.org.
Digital Object Identifier 10.1109/TSG.2014.2342796
and to actively participate to demand-response policies [4], one of the most disrupting aspects of smart grids.
Nontechnical customers need a simple way to control energy consumption and production, and to exchange power usage data at the proper level of granularity with energy providers or distributors.
From the point of view of market acceptance and penetration, the last-meter smart grid is just one aspect of the broader concept of smart home and smart buildings. The con-sequence of this consideration is that one can hardly imagine a situation in which the consumer side of the smart grid and other smart home applications rely on different and separate infrastructures or platforms.
However, smart-grid architectures proposed in the literature typically focus on the needs of power distributors to manage the complete power grid [5]. They reach customers’ premises with an ad-hoc network of smart meters connected by General Packet Radio Service (GPRS) or, sometimes, with a dedicated programmable logic controller (PLC) technology [6]. They do not take into account the possibility that customers already have other smart home infrastructures [7]–[13]. On the other hand, some solutions proposed in the literature, based on a smart home infrastructure, are not designed to be seamlessly scalable to large deployments [14]–[23].
In this paper, we present an architecture for the last-meter smart grid that is embedded in a platform for the internet of things (IoT) [24]. Our architecture has four main advan-tages and elements of novelty with respect to the state of the art, each corresponding to the basic requirement of being “customer-centric” and scalable, in order to improve market acceptance and ease of deployment.
1) It seamlessly integrates smart grid with smart home applications. We assume that the typical early adopter of a last-meter smart grid is also a user of smart home applications (dedicated to security, entertainment, home automation, et cetera). In order to avoid duplication and enable possible synergy, the platform must support both smart grid and other smart home applications.
2) It can gather data from heterogeneous sensor commu-nication protocols. The last-meter smart grid exploits existing infrastructure for in-home connection to smart meters. Therefore, its architecture allows different wire-less or wired protocols to be used for communications between meters, users, and other parts of the system. 3) It provides secure and differentiated access to data.
Single customers have complete fine-grained access to their own data, and can enable access by third parties.
Online available https://edupediapublications.org/journals/index.php/IJR
Page No. 318
Fig. 1. Block diagram of the internet of things platform supporting the in-home smart grid.
On the other hand, distributors and energy utilities can receive coarse-grained and aggregated statistical data. 4) It allows to univocally map each sensor and actuator
to a common abstraction layer. To simplify interaction with nontechnical users, sensors and actuators are also described at a higher abstraction level, independent of the physical details and of the communication protocols. Developers, utilities, and businesses can use this higher abstraction level to provide additional services, as for example scheduling of energy usage by home appliances in response to dynamic changes of energy rates, based on power demand and availability on the grid, or on mon-itoring and managing power consumption in real time. In the following, we present the complete architecture of the IoT platform (Section II), a hardware and software imple-mentation of the last-meter smart grid with experimental tests (Section III). In Section IV, we compare our proposal with related work, and in Section V we present our conclusion.
II. PLATFORM FOR THEINTERNET OFTHINGS We have developed a platform for the IoT as a scal-able distributed system that can seamlessly support an in-home smart grid and different concurrent applications for remote monitoring and control.
The platform architecture is illustrated in Fig. 1. It con-sists of three main parts: the sensor and actuator networks, the IoT server and the user interfaces for visualization and management.
Sensor and actuator nodes communicate in a reliable bidi-rectional way with the IoT server.
The communication between the nodes and the IoT server follows the TCP/IP client-server model. Sensors send mes-sages in their native format to the IoT server (through a gateway, if needed), over an encrypted link.
The IoT server converts the raw payload, containing infor-mation from heterogeneous nodes, into a standard format, con-taining object identifier, object type, measurement unit, data field, geographical position, and timestamp. In this way, data can be easily represented, manipulated and aggregated with-out considering the communication protocol of the originating source.
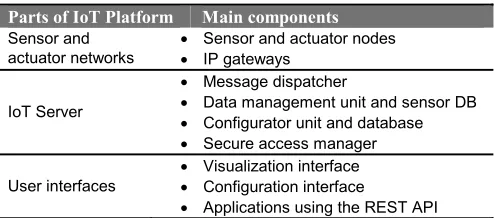
TABLE I
MAINCOMPONENTS OF THEINTERNET OFTHINGSPLATFORM
A web-based graphical interface allows users to access real time and historical sensor data. The same interface allows users with administration privileges to manage net-works and single nodes. Third-party software can access the platform using a REpresentational State Transfer application programming interface (API) [25].
Due to the possibility of using the system to collect sen-sitive and confidential data, the platform ensures an adequate security level both to end-to-end communications and to data access. For this reason, users need to be authenticated before they can access the platform and can only access specific sets of sensor data through HTTPS. The IoT server supports multiple encryption protocols (AES-128, SSH).
At a finer level of detail, the IoT platform consists of sev-eral hardware and software components, each described by its functions and by its interfaces with other components. In this way, the architecture is easily scalable and robust. Each component can be modified, redesigned, and extended with minimum impact on the rest of the system. The components are indicated in Table I and are described in more detail in the following subsections.
A. Sensor and Actuator Networks
1) Sensor and Actuator Nodes: The sensor and actuator
nodes can be part of networks implemented with wired (e.g., controller area network (CAN), PLC) or wireless (e.g., ZigBee, Wi-Fi, Bluetooth) network protocols. The architecture can accommodate different and heterogeneous sensor and actua-tor networks. The data management unit is responsible for translating information to the format required by the sensor database.
On the other hand, bidirectional communication channels to/from the nodes enable the IoT server to interrogate, con-figure, and program them. Configuration messages mainly carry node-specific information (for example measurement thresholds, alarm settings) or firmware updates.
Even if specific node characteristics depend on the net-work implementation, the proposed architecture supports the possibility to add or remove any network component in real time. Indeed, any node can join the system without requiring any change to the network implementation. For this reason, any new node that joins a network connected to the plat-form is automatically identified and immediately accessible from the network administration interface for registration and configuration. Similarly, updating or un-joining nodes are
automatically referred to the IoT server. The interface between sensor networks and the platform is based on a communication protocol between the gateway and the IoT server defined by API specifications.
Each node has to be uniquely identified to ensure global device accessibility. However, node addresses in typical sen-sor networks may change over time and are often unique only within a single network. For this reason, the IoT server assigns a unique ID to each node of the network (for example an octet string based on EUI-64) and maintains the mapping between such ID and the network address provided by the local sen-sor network coordinator. When a node sends a message to the server, the gateway translates its network address into the unique ID, and vice versa for messages from server to nodes.
2) IP Gateway: The gateway is the element connecting a
sensor/actuator network—if it has no direct IP capability—to the IoT server via an IP link. The gateway is bidirectional: for uplink communication it collects data received from the net-work nodes, performs reformatting/encapsulation if required, and sends them over a secure TCP/IP link to the message dispatcher. For downlink communication, it forwards to the receiver node(s) the commands received from the IoT server. We propose a different gateway concept with respect to the one commonly used to integrate heterogeneous networks with an external network [26]–[28]. These systems use a gateway-based approach [29], where the gateway performs a conversion of data into a universal format.
In our architecture, instead, it is the IoT server that per-forms such operation. Therefore, the gateway sends network packets over TCP/IP in the native format and both the gate-way and the message dispatcher are transparent at the logical communication level between nodes and IoT server.
This choice provides three meaningful advantages.
1) The gateway can have reduced hardware requirements and computational complexity. Our gateway has only to ensure an IP connection, to implement the encapsula-tion of the nodes’ native protocol into TCP/IP packets, and to ensure the security level required by the specific application.
2) Different applications and new functionalities can be developed and added without modifying the gateway. 3) The user side of the platform can communicate at the
application level directly with network nodes.
As a validation of this concept, the gateway is cur-rently implemented with Cortex-M3/M4 microprocessors. It is designed for easy deployment in a typical home LAN, which uses private nonroutable addresses and is connected to the Internet through a router able to perform network address translation (NAT). The machines on such LAN can-not receive incoming TCP connection from a remote server without a manual configuration of the router. To avoid this user configuration, our gateway implements the client side of a TCP connection to the IoT server and always initiates the communication with the message dispatcher (Fig.1).
B. IoT Server
1) Message Dispatcher: The message dispatcher
man-ages the bidirectional communication between each gateway
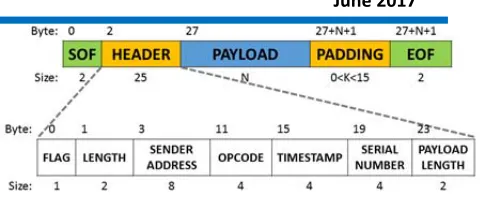
Fig. 2. Structure of the TCP/IP packet of the communication protocol between gateway and message dispatcher.
and the rest of the system. It only deals with low-level communications from nodes (through the gateways) to the data management unit and from the configurator unit to the nodes. It has the main task of listening to new connections from IP nodes that want to join the system. For every connection, it decrypts incoming packets and forwards them to the data management unit, for interpretation and storage. In the other direction (downlink), it encrypts and encapsulates messages from the configurator unit into a TCP message, and for-wards them to the destination gateway. The packet structure is illustrated in Fig.2. Each packet contains the following infor-mation: 1) 64-bit gateway address (which uniquely identifies the local network); 2) opcode; 3) timestamp, with resolution of 1 s; 4) serial number; and 5) payload in raw format.
The opcode defines the function of each packet. Packets can be divided in two main classes: administration packets and data relay packets.
For every type of local sensor network protocol included in the platform two opcodes are defined: one used for the upstream and one for the downstream data transmission.
Administration packets are used for configuration and main-tenance of the gateway. The addition of a different local sensor and actuator network requires only the addition of two new opcodes to the protocol.
2) Data Management Unit and Database Storage: The
Data management unit is a collection of software modules, each able to manage the messages of a specific sensor network type. These components receive node packets in their native format and extract their payload. Depending on the payload, two different storing mechanisms are used:
1) If the payload contains measurement data from a sensor or an event notification by an actuator, data are stored in a unique format in a streaming sensor database. 2) If the payload contains specific network messages
(configuration, management information, communica-tion channel, node address, etc.), messages are stored in the original format into the configurator database. The presence of the sensor database decouples data col-lection from data processing and visualization, so that users do not need to interrogate nodes directly. This approach is useful especially when sensor networks are heterogeneous. It is also very useful when nodes are battery-operated devices. Decoupling allows nodes to stay most of the time in sleep mode and periodically wakeup to receive commands and configurations and to send measurement and status data.
In the sensor database, sensor data are represented with a unique format, independent of the local sensor network
protocol, and are univocally associated to the physical nodes through the unique node ID. In this way, data can then be easily accessed by performing a simple query to the database, and can be processed and visualized independently of the characteristics of the physical source.
Unlike sensor data, configuration variables and messages can be completely different for nodes of different type and network protocol. Storing configuration messages with no protocol conversion avoids possible loss of information.
Both sensor and configuration information are stored in remote databases. This makes the system easily scalable and does not impose limitations on the data volume a node can send to the server.
3) Configurator Unit and Database: This unit configures
networks and nodes according to inputs from users and autho-rized applications and according to the system status stored in the configuration database. Also the configurator unit is a col-lection of software components, each dedicated to a specific type of sensor/actuator network. For any new added sensor network protocol, dedicated modules must be added to the configurator unit.
4) Secure Access Manager: A secure access manager that
ensures privacy and data protection coordinates all communi-cation between end-users and the IoT server. It provides access to stored information and network configuration only to autho-rized users or third-party applications, based on a database of users and their permission to each resource (networks, node). By default, network owners have administrator rights on their networks.
C. User Interfaces
Users, service providers and application developers can interact with the platform through user interfaces (web-based or API). The user interface offers two main functionali-ties related to two main client profiles: standard users and administrators. Standard users can access sensor data and con-trol actuators. Administrator users have superior access: they can also see the configuration and the status of the nodes and dynamically configure them.
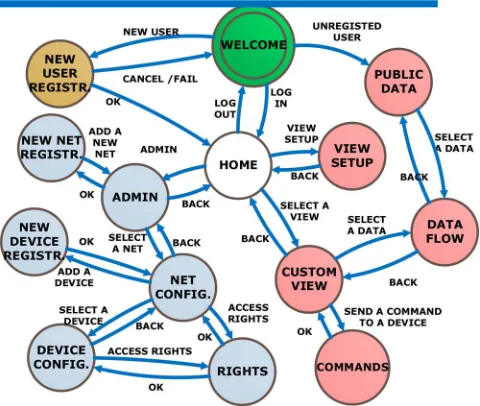
The interaction between users and the platform through the web user interface can be modeled as a finite state machine. In this representation (illustrated in simplified form in Fig. 3). Transitions are triggered by IoT node events and client requests, and they depend on user permissions.
The initial state is the login page. Nonregistered users can only see public sensor data and cannot send commands or configure nodes and networks. Registered users have access to the user home page.
The web interface can be divided as follows.
1) Visualization Interface: The visualization interface dis-plays current and historical information from sensors and actuators is a series of pages. In addition, the visualization interface allows authorized users to send commands to actuators. Users can create custom data views and visualization pages, send commands, set rules and alarm notifications.
2) Administration Interface: The administration interface provides users with the possibility to remotely manage
Fig. 3. User interface state machine diagram. Blue circles represent states of the administration interface; red circles represent states of the visualization interface.
and configure their networks. In addition, users can set the data visibility of their own sensors and manage third-party access and privileges to their nodes. The layout and the fields included in the administration interface pages depend on the type of networks and on the correspond-ing protocols. The administrator interface is also used to easily and remotely register new gateways and configure new network connections.
To establish the connection, the gateway needs to know the network name and the IP address of the message dispatcher, the port number on which it accepts connec-tions and the network AES security key. For this reason, it has to be registered and configured.
Using the web interface the administrator users can add a new network on their admin page, by inserting the gate-way address, selecting the type of network and assigning a name, a description and a network location. The server will generate a network security key (ex. AES key) and will save it in the user database along with the network information.
After the configuration with this security key, the gate-way connects to the server sending a request connection. The server processes the request, spawns a new process and lets it communicate directly with the gateway. This task acquires the network information from the configu-ration database and informs the gateway that it can begin the encrypted communication. After the communication is setup, the network appears on the configuration page of the user.
3) Web Service API: Web service APIs open the platform to service providers and new client applications (as for example an Android app as in Fig.4). APIs offer an easy and unified way to retrieve information collected from heterogeneous sources. Service providers, utilities and third parties can use the API to obtain single, multiple or aggregated measurement data, and to provide informa-tion to the customers concerning for example, dynamic
Fig. 4. Example of a sensor data visualization using a smartphone.
Fig. 5. Smart Plug prototype (left) and power calibration curves (right).
changes to the tariffs, alarms, weather-related data, that can be used by customer-defined rules set (or accepted) by the users. In this context, the implementation of demand-response policies can be enabled. To protect sensitive information, the sensor owner can define third-party accessibility of collected data. Only registered end-users and authorized third-party applications can retrieve sensor data from the sensor database through the API.
III. IN-HOME SMART GRIDIMPLEMENTATION We have implemented an in-home prototype on the IoT platform, building dedicated hardware and software. This first prototype only includes a ZigBee network connected to the IoT server through a ZigBee IP gateway. The sensors are smart plugs, placed between home appliances and a wall socket, and able to collect real-time power consumption data from the loads. Customers can have a visual feedback of their energy consumption and can remotely control each load. Let us consider in detail the elements of the system.
A. Smart Plug
As shown in Fig. 5 (left), the smart plug is enclosed in a plastic case with a plug and a socket section and can be inserted in a standard wall socket.
The smart plug collects load information from the attached electrical equipment. Information includes: single-phase active, reactive, and apparent power; power factor; sampled waveforms; root mean square (RMS) current and volt-age; on/off status. The smart plug is also an actuator, since it can turn the load on and off. Our smart plug has no buttons and can be completely configured and controlled through the user interface.
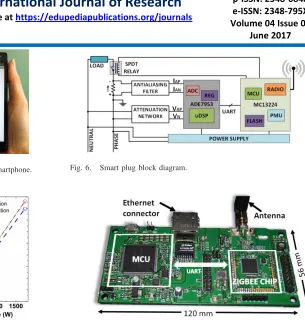
Fig. 6. Smart plug block diagram.
Fig. 7. ZigBee IP gateway prototype.
In the current design (Fig. 6), the communication with the ZigBee network is provided by a Freescale MC13224 SoC, equipped with an AES128 encryption engine. The board includes an ARM7 processor with 128 kB of Flash, 96 kB of RAM and 80 kB of ROM memory. An Analog Devices ADE7953 is used for energy measurement.
Load control is implemented using a single pole bistable 12 V relay supporting loads up to 16 A. The board includes a power supply unit, which provides the supply voltages of 12 V for the relay and 3 V for the ADE7953 IC and the MC13224 SoC. The firmware running on the smart plug is implemented using the Freescale ZigBee stack, called BeeStack.
The ADE7953 can be calibrated by microcontrollers (MCU) through the serial link. The smart plug has been calibrated using as a reference meter tabletop power meter PCE-PA 6000 (Fig.5—right). Calibration coefficients can be remotely send to the node through the ZigBee radio. The ZigBee smart plug has an accuracy of 1.1% (post-calibration).
B. Gateway
As the power meter is a ZigBee device, a ZigBee/IP gateway is needed to allow communication with the IoT server. The gateway is composed by an Ethernet interface, a microcontroller, and a ZigBee RF transceiver.
Following what we wrote in Section II-A2, the gateway can have reduced hardware requirements. However, in order to reduce chip count, and hence cost, we have selected a micro-controller with an on-chip Ethernet micro-controller, which slightly increases the processor hardware requirements.
The gateway firmware makes use of the lwIP TCP/IP stack [30]. When connected to a LAN equipped with a DHCP server (like most of home ADSL modem/routers) it can auto-configure its network interface. All the messages exchanged between the server and the gateway can be encrypted.
C. Message Dispatcher
The message dispatcher is implemented as a multiprocess application running on a Linux machine. The main appli-cation task continuously listens to new possible connections from gateways or other IP nodes. Every time a new TCP con-nection is established, a new process is created and remains active until the connection is closed by the gateway or a timeout occurs. This new process saves received packets in a UNIX-named pipe, which is read by the data management unit (Section II-B2). Moreover, the process collects and deliv-ers from the config database (Section II-B3) downstream data addressed to the gateways.
D. Data Collection and Storage
The data collection unit is implemented using the CoMo platform software [31]. CoMo has been developed for the fast prototyping of network data mining applications and has been used in large testbed deployments, such as PlanetLab [32]. Hence it is scalable to very large systems and very high data rates.
The CoMo architecture presents an abstraction layer for the network interface and for the IoT server. Developers can implement new algorithms for processing sensor network data streams without any explicit knowledge of the internals of the monitoring system, transport media, memory and storage organization.
CoMo follows a classical modular approach that has proven to be successful in similar contexts [33]. The core system pro-vides an API to enable the development of modules for each packet stream. Each module uses a common data model and specifies the information of interest (together with its resolu-tion and accuracy). The system identifies if that informaresolu-tion is available. CoMo converts all incoming data streams in a unified packet stream that is then delivered to the subsequent processing queries [31].
In the context of the IoT platform, each CoMo module inter-prets the packets of a specific type of sensor network and extracts data to be further included in the sensor database or in the config database.
E. User Interface, Configurator Unit, Secure Access Module
We have chosen a web interface implementation that: 1) is easily scalable to many concurrent client connections; 2) implements user authentication; and
3) is friendly to inexperienced users on different form-factor devices.
The web interface, the configurator unit, and the secure access module are based on Tornado [34], an open-source scal-able non-blocking web server and web application framework written in Python. The graphical interface is responsive and
Fig. 8. Example of the visualization of data from a smart meter in the implemented last-meter smart grid.
Fig. 9. Authorized users can see possible commands that can be sent to each virtual device.
rests on Twitter Bootstrap [35], a set of ready-to-use graphical elements. Among the many services, which could be pro-vided by our architecture, we have implemented five main user interface functionalities.
1) View Sensor Data: As shown in Fig.8, this page allows the user to visualize collected data of a sensor. The page provides a chart where data are plotted as a function of time and a time range selector. On the right, a timepicker allows an easy selection of measurement period. 2) Register and Configure New Networks: The
adminis-trator users can register and configure new networks through dedicated pages. The network configuration is saved in the configurator database and the AES key for the gateway is generated. This is the only action required to an administrator user to make its network visible. 3) Network Configuration and Rights Management: The
network configuration page allows the administrator to assign access rights with different privileges, to mod-ify specific network options (netID, communication channel, security level, etc.) and to manage sensors visibility, grouping, and security.
4) Register New Sensors: The system automatically recog-nizes unregistered sensors that are sending data through a registered network/gateway and presents them to administrators, who can decide to register them. 5) Send Commands: Authorized users can send commands
to actuators. All nodes are represented as one or more virtual devices (Fig. 9) that can possibly accept com-mands.
If this is the case, the command interface is visible to authorized users. When a command is sent through the user interface, a JavaScript object notation (JSON) message is created containing the recipient ID and the command. This
Fig. 10. Power consumption data collected from 3 common household loads and partial sum.
message is then converted into the sequence of messages to be sent to the node. All messages are stored in a configuration database that is continually read by the message dispatcher.
The user database and the config database are imple-mented with MySQL. The Tornado backend implements direct access, after authentication, to the sensor data through HTTP. This makes it easy to ask for sensor data directly from the JavaScript frontend through Ajax requests. The query returns sensor data for a given network id, sensor id and time range as an array of <timestamp, measure>tuples.
F. Experimental Demonstration
We have performed several extensive tests of the implemen-tation to verify operation and reliability. Each element has been individually tested and validated. All sensors have been cali-brated as described in Section III-A. A complete demonstrator including all elements of the implementation and more than ten sensors has run continuously for more than three months without loss of data in a laboratory setting, with quasi-daily addition and removal of sensors and remotely switching on and off each load using the web interface shown in Fig. 9. As an example, data extracted from the demonstrator in a time span of about 3 h from three smart meters are plotted in Fig. 10. Data from a small fridge, an expresso coffee maker, and an electric heater show the typical features of the corresponding power loads.
IV. COMPARISONWITHRELATEDWORKS
Comparison with related works must consider recent liter-ature in the neighboring fields of distributed sensor networks, home automation, and smart grids. We can loosely classify the large number of related papers in two groups.
A set of papers focuses on the automation of the com-plete power distribution grid, of which the “last-meter” smart grid is only a subsystem. In this case, the complete grid includes power generation plants, transmission and distribu-tion networks, and “smart” consumers, with local generadistribu-tion capabilities, flexible usage, and sometimes energy storage capacity. This large infrastructure is usually managed by a central server/data storage or Supervisory Control and Data Acquisition (SCADA) system [7]–[9]. For obvious reasons, the proposed systems are described only at the architectural level, with an extensive discussion of the goals and objectives but with few details of the implementation. They also require substantial investments in infrastructure, especially for data
transmission from the customer site to the last node of power distribution (last meter). Many transport options are typically proposed, such as the use of dedicated lines, to POTS/modem, PLC, wireless links [10], [11].
Most of these projects include a “smart meter” used for both data collection and billing [9], which can be deployed only by the power distributor or in strict coordination with it. A pilot project deployed by a power distributor [12] required an invest-ment of 10 MAC for the territory covered by a single primary distribution transformer (about 30 MVA). It is worth noting that deployed smart metering networks are usually based on PLC links [13].
With respect to this set of papers, the advantage and the uniqueness of our approach are apparent. Our proposal is “cus-tomer centric,” as opposed to “distribution centric,” in the sense that favors ease of deployment and user acceptance, leveraging the smart home trend to enable the merging of smart grid and smart home applications in customers’ homes. Indeed, our proposal focuses on the customer domain of the smart grid, possibly leaving the domains more evidently con-trolled by the utilities, such as transmission and distribution, to a “distribution-centered” treatment.
There is also another set of papers presenting home automa-tion systems for power metering and analysis, which are therefore closer to the present paper. While [14] and [15] pro-vide mostly an architectural description, [16]–[19] and [23] provide implementation details and a demonstration.
Most of the proposed implementations connect the home sensor or automation network to the wide area network or to a central server by means of a complex gateway, with large computational power (several MB of RAM and FLASH and a complete operating system) [19], [20]. Communication can occur for example via ZigBee and 6LoWPAN [18], [19], [23] but also dedicated point-to-point radio links are proposed in [16] and [20]. The installation and configuration of this device makes the deployment of the system out of the reach of many end users. References [19], [21], and [22] implement the data storage, analysis, and user interface by means of a local server, assigning to the user the task to maintain and config-ure the system. In [36], a concept for integration of smart home devices into smart grid applications using multicast-enabled home gateways based on standard consumer routers with a 400 MHz and 32MB RAM ARM processor running OpenWRT, a Linux distribution for embedded devices.
With respect to this other group of papers, the advantages of our proposed architecture and implementation consist in their intrinsic scalability to large-scale deployment. This is enabled by the choice of low-cost gateway and power meter (the bill of material of each is less than 15$), and by the accent on deployment by nontechnical users.
V. CONCLUSION
We have presented an architecture, an implementation, and a demonstration of the Customer Domain of the smart grid, based on a platform for the IoT that can host a broad range of smart home applications.
Novelty in this field must be found in the architectural concept, in the system integration, and in the prioritization of
requirements. In this sense, our proposal has unique advan-tages and elements of novelty with respect to the state of the art: it is customer centric, it minimizes the deployment of specific smart grid infrastructure, and it leverages possibly available smart home applications, sensors, and networks. We believe this is key for a widespread acceptance of smart grid applications and equipment to be deployed at home.
REFERENCES
[1] V. Giordano, F. Gangale, and G. Fulli, “Smart grid projects in Europe: Lessons learned and current developments, 2012 update” Eur. Commission, Joint Res. Centre, Inst. Energy Transp., Sci. Policy Rep., 2013.
[2] National Institute of Standards and Technology, NIST Framework
and Roadmap for Smart Grid Interoperability Standards, Release 1.0,
Office of the National Coordinator for Smart Grid Interoperability-U.S. Department of Commerce, NIST Special Publication 1108, Jan. 2010 [3] R. Ma, H. H. Chen, Y. Huang, and W. Meng, “Smart grid
communication: Its challenges and opportunities,” IEEE Trans. Smart
Grid, vol. 4, no. 1, pp. 36–46, Mar. 2013.
[4] P. Palensky and D. Dietrich, “Demand side management: Demand response, intelligent energy systems, and smart loads,” IEEE Trans. Ind.
Informat., vol. 7, no. 3, pp. 381–388, Aug. 2011.
[5] K. Samarakoon, J. Ekanayake, and N. Jenkins, “Reporting avail-able demand response,” IEEE Trans. Smart Grid, vol. 4, no. 4, pp. 1842–1851, Dec. 2013.
[6] Energy Community. (2010). Energy Community Regulatory Board, A Review of Smart Meters Rollout for Electricity in the Energy Community [Online]. Available: http://www.energy-community.org/pls/portal/docs/744178.PDF
[7] A. A. Khan and H. T. Mouftah, “Web services for indoor energy man-agement in a smart grid environment,” in Proc. 2011 IEEE 22nd Int.
Symp. Pers. Indoor Mobile Radio Commun. (PIMRC), pp. 1036–1040.
[8] J. Byun, I. Hong, B. Kang, and S. Park, “A smart energy distribution and management system for renewable energy distribution and context-aware services based on user patterns and load forecasting,” IEEE Trans.
Consum. Electron., vol. 57, no. 2, pp. 436–444, May 2011.
[9] A. Zaballos, A. Vallejo, and J. Selga, “Heterogeneous communication architecture for the smart grid,” IEEE Netw., vol. 25, no. 5, pp. 30–37, Sep. 2011.
[10] T. Sauter and M. Lobashov, “End-to-end communication architecture for smart grids,” IEEE Trans. Ind. Electron., vol. 58, no. 4, pp. 1218–1228, Apr. 2011.
[11] F. Benzi, N. Anglani, E. Bassi, and L. Frosini, “Electricity smart meters interfacing the households,” IEEE Trans. Ind. Electron., vol. 58, no. 10, pp. 4487–4494, Oct. 2011.
[12] Enel Press Release. (2011, Nov. 4). Italy’s First Smart Grid in Isernia [Online]. Available:http://goo.gl/RsY8F
[13] B. Botte, V. Cannatelli, and S. Rogai, “The telegestore project in Enel’s metering system,” in Proc. 2005 18th Int. Conf. Exhib. Electr.
Distrib. (CIRED), pp. 1–4.
[14] Y. Yang, Z. Wei, D. Jia, Y. Cong, and R. Shan, “A cloud architecture based on smart home,” in Proc. 2010 2nd Int. Workshop Educ. Technol.
Comput. Sci. (ETCS), vol. 2. Wuhan, China, pp. 440–443.
[15] Q. Hu and F. Li, “Hardware design of smart home energy management system with dynamic price response,” IEEE Trans. Smart Grid, vol. 4, no. 4, pp. 1878–1887, Dec. 2013.
[16] Q. Liu, G. Cooper, N. Linge, H. Takruri, and R. Sowden, “DEHEMS: Creating a digital environment for large-scale energy management at homes,” IEEE Trans. Consum. Electron., vol. 59, no. 1, pp. 62–69, Feb. 2013.
[17] J. Park, I. Han, J. Kwon, J. Hwang, and H. Kim, “Development of a resi-dential gateway and a service server for home automation,” in Advanced
Internet Services and Applications (Lecture Notes in Computer Science),
vol. 2402. Berlin, Germany: Springer-Verlag, 2002, pp. 137–149.
[18] I. Choi, J. Lee, and S.-H. Hong, “Implementation and evaluation of the apparatus for intelligent energy management to apply to the smart grid at home,” in Proc. 2011 IEEE Instrum. Meas. Technol. Conf. (I2MTC), pp. 1–5.
[19] F. Viani et al., “Wireless architectures for heterogeneous sensing in smart home applications: Concepts and real implementation,” Proc. IEEE, vol. 101, no. 11, pp. 2381–2396, Nov. 2013.
[20] C. Borean, A. Ricci, and G. Merlonghi, “Energy@home: A ‘user-centric’ energy management system,” Metering Int., no. 3, pp. 52–56, 2011. [21] F. Salvadori, C. S. Gehrke, A. C. de Oliveira, M. de Campos,
and P. S. Sausen, “Smart grid infrastructure using a hybrid network architecture,” IEEE Trans. Smart Grid, vol. 4, no. 3, pp. 1630–1639, Sep. 2013.
[22] N. Morimoto et al., “Smart outlet network for energy-aware services utilizing various sensor information,” in Proc. 2013 27th Int. Conf. Adv.
Inf. Netw. Appl. Workshops (WAINA), Barcelona, Spain, pp. 1630–1635.
[23] B. Becker, A. Kellerer, and H. Schmeck, “User interaction interface for energy management in smart homes,” in Proc. 2012 IEEE PES Innov.
Smart Grid Technol. (ISGT) Conf., Washington, DC, USA, pp. 1–8.
[24] E. Spanò, S. Di Pascoli, and G. Iannaccone, “An intragrid implementa-tion embedded in an internet of things platform,” in Proc. 2013 IEEE
18th Int. Workshop Comput. Aided Model. Design Commun. Links Netw. (CAMAD), Berlin, Germany, pp. 134–138.
[25] R. T. Fielding, “Architectural styles and the design of network-based software architectures,” Ph.D. thesis, Dept. Inf. Comput. Sci., Univ. California, Irvine, Irvine, CA, USA, 2000.
[26] N. Meratnia et al., “Decentralized enterprise systems: A multiplatform wireless sensor network approach,” IEEE Wireless Commun., vol. 14, no. 6, pp. 57–66, Dec. 2007.
[27] C. Pastrone, M. A. Spirito, R. Tomasi, and F. Rizzo, “A Jabber-based management framework for heterogeneous sensor network applications,”
Int. J. Softw. Eng. Appl., vol. 2, no. 3, pp. 9–24, 2008.
[28] A. Kansal, S. Nath, J. Liu, and F. Zhao, “SenseWeb: An infrastruc-ture for shared sensing,” IEEE Multimedia, vol. 14, no. 4, pp. 8–13, Oct./Dec. 2007.
[29] S. Lei et al., “Connecting heterogeneous sensor networks with IP-based wire/wireless networks,” in Proc. 2006 4th Softw. Technol. Future
Embedded Ubiquitous Syst., 2nd Int. Workshop Collab. Comput., Integr. Assur. (SEUS-WCCIA), pp. 127–132.
[30] A. Dunkels, “Design and implementation of the lwIP TCP/IP stack,” Swedish Institute of Computer Science, Kista, Sweden, Technical report, Feb. 2001.
[31] G. Iannaccone, “Fast prototyping of network data mining applications,” in Proc. 2006 PAM Conf., Adelaide, SA, Australia, pp. 41–50. [32] L. Peterson, S. Muir, T. Roscoe, and A. Klingaman, “PlanetLab
architec-ture: An overview,” Princeton University and Berkeley Intel Research, Tech. Rep. PDN-06-031, Apr. 2006.
[33] D. Carney et al., “Monitoring streams: A new class of data management applications,” in Proc. 2002 28th ICVLDB, pp. 215–226.
[34] (2013, Nov.). Tornado Documentation Release 3.1.1 [Online]. Available:
www.tornadoweb.org
[35] M. Otto and J. Thornton. (2011). Twitter Bootstrap [Online]. Available:
http://getbootstrap.com/
[36] S. Meiling, T. Steinbach, M. Duge, and T. C. Schmidt, “Consumer-oriented integration of smart homes and smart grids: A case for multicast-enabled Home Gateways?” in Proc. IEEE 2013 3th Int. Conf.