SCADA integrated and power system distribution automation
V Rama Krishna1, K Rajesh Kumar2
1
B.tech scholar, Department of Electrical and Electronics Engineering, Siddhardha Institute of Engineering and Technology, Vinobha Nagar, Ibrahimpatnam, Hyderabad, Telangana-501506
2
Asst.Prof, Department of Electronics and Communication Engineering, Siddhardha Institute of Engineering and Technology, Vinobha Nagar, Ibrahimpatnam, Hyderabad, Telangana-501506
Abstract—Electrical Grid we have is more than 50 years old. The integration of information technology to the electric grid system is expected to address many shortcomings of the current and traditional electrical grids that have resulted in Smart Grid which is gaining lot of interest and momentum. In Smart Grid, Power Distribution is one part which requires monitoring and control. Lot of technologies and have been applied in
Smart grid towards sensing and action.
Supervisory Control and Data Acquisition (SCADA) system is very well proven within the substation region. There has been very less monitoring done on the distribution side due to the geographical distribution. Currently, Internet of Things has paved way for connecting huge number of devices to the Internet which would be very much effective and beneficial for power distribution and Automation. So accordingly, an IoT based SCADA integrated with Fog for Distribution Automation system has been proposed which takes care of the consumer utilization, outage management, power quality control and pole transformer health. This is supported by fog computing which does real-time streaming analytics. This helps in reducing the internet bandwidth and latency for immediate control action.
Keywords—; SCADA; Fog Computing;
Distribution automation; Smart Grids.
I. Introduction
Recently distributed generation (DG)
penetration has increased, and distributed power generation has increasingly affected power systems [1,2]. Many DG use renewable resources
such as wind power, solar power, hydro. Energy storage systems (ESSs) in distribution systems are also counted as DG. In Korea, the government aims to generate 12.5% of the total electricity from DG and 5.3% of the total electricity from renewable DG by 2029 [3]. However, renewable DG has already caused some problems in power systems in southwestern Korea, including reverse power flows and voltage violations during low electricity demand periods with a high penetration of DG. Large-scale DG in distribution systems can affect transmission as well as neighboring distribution systems. For example, photovoltaic distributed generators (PVDGs) connected to radial distribution feeders can cause a reverse power flow (RPF). The function of the protection and regulation devices placed in the radial distribution feeders can be disturbed by the RPF, because the devices consider power flow in one direction [4]. DG can also have an impact on the feeder voltage profile. DG output will reduce the load current seen from the transformer by supply loads in the feeders, and can even cause RPF. This results in underor overcompensation of the load tap changer (LTC) [5]. Vita et al. have analyzed the impacts of DG on voltage profiles, power losses or lighting protection for distribution networks [6,7]. DG systems have also been developed into hybrid renewable energy source (HRES) systems such as microgrids. The HRES system has multiple renewable resources and the control of the resources is getting more complicate [8–12]. The complicated DG system can have problems which have not seen before such as fault currents and imbalance issues [13– 15]. Research on development of the planning and
information system (GIS) for DG system was conducted. Monitoring, analysis, and evaluation associated with DG has been performed for individual distribution systems, assuming that in practice the power flow is unidirectional in a
distribution system. Conventional radial
distribution systems have been able to operate using separate methods, but as the DG connection increases, there is a need to accurately monitor and analyze such systems. In separate analysis and monitoring, DG could be connected and operated in a distribution system without considering the actual effects on other distribution feeders and transmission systems. Therefore as the installed DG has increased, the necessity to transmit and distribute integrated analysis has occurred . This paper presents a new transmission and distribution integrated monitoring and analysis system and methodology to evaluate the effects of DG in integrated system, and it recommends a method for the optimal operation of DG. The proposed system is new concept of grid operating for practical DG penetrated power systems. In previous grid operating systems, transmission and distribution systems are managed separately and the effect of DG cannot be analyzed properly. To analyze the effects of DG in real power system operations, the transmission and distribution integrated monitoring and analysis system is connected to a distribution automation system (DAS) and supervisory control and data acquisition (SCADA). When transmission and distribution integrated systems analyze DG connected power systems, both the SCADA and DAS system data are automatically combined. A new methodology and automated process for preliminary evaluation of DG connection also proposed in the paper. Case studies performed using practical data from Jeollanam-do Province in South Korea show the effectiveness and differences of the integrated system.
II. Architecture of the Transmission and Distribution Integrated Monitoring and Analysis System
Figure 1 shows the architecture of the integrated monitoring and analysis system. In Korean power systems, the transmission system is monitored in real-time using SCADA. The
Substation Operating Management System
(SOMAS) records of the Korea Electric Power Corporation’s (KEPCO) real-time data (main transformer, transmission line, breaker, etc.) from SCADA every 30 s. The DAS monitors and provides the operating conditions of the distribution system in real-time. Feeder remote terminal units installed in the distribution system send the state data of the equipment to the main server via a communication device. Although DAS can acquire data in several seconds depending on the communication type, in order to synchronize with the SOMAS, the integrated system produces integrated data every 30 s. Unlike SCADA, DAS also receives data of each phase from distribution lines and this enables one to analyze the unsymmetrical faults and power flow theoretically. However in practical power system operation, there are issues with single phase data reliability due to the numerous
transposition events in distribution lines.
Figure 1. System diagram of transmission and distribution integrated system.
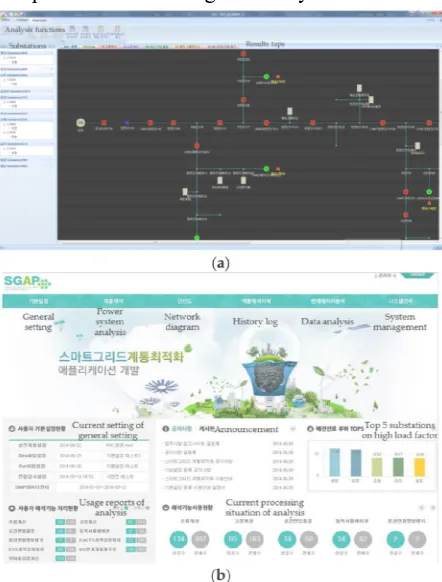
There are two types of transmission and distribution integrated system-network and stand-alone. Figure 2a,b show the main menu from each version. In the stand-alone version, an operator
installs the transmission and distribution
integrated analysis program on a stand-alone computer for monitoring and analysis.
Figure 2. Main menu of the transmission and distribution integrated monitoring and analysis system; (a) stand-alone version; (b) network version.
This version uses a power system data file extracted from DAS and SOMAS. In the network version, an integrated server acquires and stores power system data from SOMAS and DAS automatically, and every PC connected to the KEPCO network can run transmission and distribution integrated monitoring and analysis functions without installing any software. By
using this network version, system operators in regional headquarters can easily use the
transmission and distribution integrated
monitoring and analysis systems.
III. Functions of the Transmission and Distribution Integrated Monitoring and Analysis System
3.1. Integrated Data Acquisition and Convergence
Within the transmission and distribution integrated monitoring and analysis system, the transmission data is acquired from the SCADA system and the distribution data through DAS. The DAS system monitors power facilities installed on distribution systems and their operational status in real time, swiftly identifies any functional failure, shortens the time of failure
through remote control, and reduces
malfunctioning parts to support and ensure a stable power supply. Figure 3 shows the algorithm of the distribution system’s data acquisition in DAS. The data acquired by DAS and SCADA converge in the transmission and distribution integrated analysis and monitoring system, and are combined at the connection point between the distribution and transmission systems. The data conversion program selects a power system subjected to the integrated analysis to perform data merging of the selected distribution systems.
3.2. Power System Analysis
The transmission and distribution integrated monitoring and analysis system compares the results of the analysis automatically with the Korean power system regulations and provides a violation warning to users. The following analyses, which are difficult to perform with a conventional system that analyzes transmission and distribution separately, can be performed in an integrated system. Those analysis functions are essential for high DG penetrated power system operation.
• Power flow, fault current calculation
• Automated preliminary evaluation of DG
connection
• DG connection impact on neighboring
distribution or transmission systems
• Transmission system fault current
contribution of DG in distribution system
• Phase angle information for connection
switch operation between different
distribution systems
For power flow analysis, power system operator can choose between Gauss-Seidel and Newton-Raphson methods. In all fault analyses, the fault type is assumed to be a 3-phase fault, which yields the maximum short-circuit current values. In addition, every power flow and fault current analysis in this paper is performed in an assumed 3-phase balanced condition in practical operation. The transmission system fault current contribution from DG in distribution system also can be analyzed for reference in the transmission system protection plan. Phase angle information for connection switch operation is provided to the distribution system operator. This information can be analyzed in conventional DAS systems which assume the substation as a slack bus. By using phase angle differences at both ends of switch, the distribution operator can determine the switch operation.
3.3. Preliminary Evaluation of DG Connection
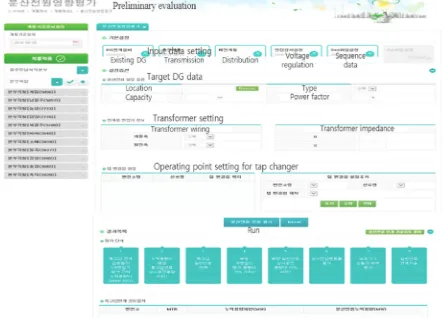
The main purpose of the transmission and distribution integrated monitoring and analysis system is to analyze the DG connection impact. Before DG installation, the system operator would need to consider the effect of DG on a power system. In a conventional system, the operator evaluates the effects of the DG manually, before it is connected. Additionally, the operator only considers the effect of DG on the distribution line that is connected to a DG, and ignores the effects of the DG on the transmission and other distribution systems. However, in real operation, DG affects the power quality of other distribution or transmission systems. As DG penetration increases, these effects become a considerable problem in the Korean power system. When the system operator receives a request for a new DG
installation from electricity suppliers,
transmission and distribution integrated
monitoring and analysis systems evaluate the impact of a new DG connection and display a warning to the operator when a regulatory violation is predicted. The input screen of a preliminary evaluation of a DG connection is shown in Figure 4.
In this preliminary evaluation, a transmission and distribution integrated analysis provides a more accurate evaluation by covering the entire power system and the previously installed DG, thereby preventing problematic DG installations. This automated preliminary evaluation process considers a voltage fluctuation, short-circuit capacity, and the possibility of a violation of voltage or capacity regulations, as shown in Figure 5.
Figure 5. Algorithm for preliminary evaluation of DG connection.
For preliminary evaluation, the operator has to input DG and transformer data such as location, capacity, transformer wiring and impedance. If the total capacity of the DG in the distribution system exceeds more than 15% of the main transformer (Mtr) capacity, the system automatically evaluates the substation voltage fluctuation. In a practical system, the on load tap changer (OLTC) and line drop compensation (LDC) methods are used for substation voltage control. For LDC, the voltage of the regulating point in the distribution system
Vreg can be calculated using:
From (4), the voltage deviation due to DG can be calculated as:
To prevent the frequent operation of OLTC and voltage fluctuation in the substation, ∆VDG
should be restricted in a dead band of OLTC.
If the DG failed to comply with (6), it cannot be connected to a normal distribution line. The integrated system tests a voltage violation when the total capacity of the DG in a distribution system exceeds more than 15% of the distribution line capacity. For the voltage violation test, the system calculates the power flow for the maximum and minimum output of the DG, and compares it to KEPCO’s voltage regulation (±2%). Unlike photovoltaic (PV) or synchronous generator type DGs, an induction generator type DG can cause an instantaneous voltage dip in the distribution line.
Therefore, a dynamic simulation is conducted to confirm the instantaneous voltage violation for the DG connecting and disconnecting, which is shown as:
Nominal and fault currents due to DG can cause the false operation of protection relays on distribution line. In protection system tests, the integrated system detects false operations of the relay by comparing the nominal current and fault current to the relay setting. If the DG fails those tests and evaluation, the DG must be connected through an exclusive distribution line, which only connects to the DG. In this case, harmonic distortion and fault current tests are performed as additional steps.
The integrated system examines the THD and
exclusive distribution line in the same way as a normal distribution line.
References
[1] R. Patterson, "A Quantum Leap into the IED Age", Proceedings of the Sixth International DA/DSM 96 Distributech Conference, 1996-January.
[2] K. Ghoshal, "Automating Today's Distribution Systems", T&D Automation Operations & Technology Conference '94, 1994-September. [3] C. Wilborn, J. Stock, "Recent Developments
in Substation Automation", T&D Automation Operations & Technology Conference '94. [4] K. Ghoshal, L. Douglas, "Integrating
Third-Party Packages into an EMS", IEEE Computer Applications in Power, April 1995.