What is opinion?
Who influences? and how it gets influenced?
Sr.SujathaYeruva (Ph.D)1, Dr. Mrs. T. Devi 2
1,2
Department of Computer Applications, Bharathiar University Coimbatore – 46, India
Abstract—The world is extremely complicated. When represented as a network, its intricacy gets smoothened and further helpful insights can be easily obtained. It facilitates to identify the way information diffuses in a social network and scrutinize how resilient every infrastructure network, like roads, or the electric power grid are to random or intentional builders. The goal is to know the way a network structure influences as and when innovative different processes occur on the network. This obtains the assumptions of how information diffusion can be plagued by the network structure. If any two members are connected through a brief multiplicity of hops does it mean that information could diffuse without any delay? Generally it is not the information is been spread slowly but it diffuses like an outbreak. The study about the way a social network gets influenced and how quickly an outbreak goes to unfold and what protection ways could be implemented if the structure of the network is known makes it highly motivating. The findings further enhance opinion formation and helps in reaching a common agreement across the network as people unceasingly update their beliefs or form an opinion just on single occasion, however it might be influenced by what one's friends presume. The prime decision based on coordination and cooperation can be obtained in a scenario when a certain task is imposed on an individual. This derives at a solution that an individual can accomplish the task as quickly as possible by enhanced increments of the nodes that one is tied to. Eventually, as per the resilience to attack, for fewer reasons, in spite of certain subset of the nodes being far away from the network, the network still can function.
Keywords—Network evolution, information diffusion, scale-free
networks, preferential attachment, population evolution
I. INTRODUCTION
With hundreds of millions of users worldwide, social networks provide great opportunities for social connection, learning, political and social change, as well as individual entertainment and enhancement in a wide variety of forms. Because many social interactions currently take place in online networks, social scientists have access to unprecedented amounts of information about social interaction [1]. Prior to online networks, these investigations required resource-intensive activities such as random trials, surveys, and manual data collection to gather even small data sets. Now, massive amounts of information about social networks and social interactions are recorded. This wealth of data can allow social scientists to study social interactions on a scale and at a level of detail that has never before been possible. In addition to providing a platform for scientists to observe
social interactions in large scale, online social networks are also changing the very nature of social interactions. People now have ready access to almost inconceivably vast information repositories that are increasingly portable, accessible, and interactive in both delivery and formation. Basic human activities have changed as a result, and new possibilities have emerged. For instance, the process by which people locate, organize, and coordinate groups of individuals with shared interests, the number and nature of information and news sources available, and the ability to solicit and share opinions and ideas across various topics have all undergone dramatic change with the rise of social networks.
Social networks have already emerged as a significant medium for the widespread distribution of news and instructions in mass convergence events such as the 2008 U.S. Presidential Election [2], the 2009 Presidential election in Iran [3], and emergencies like the landfall of Hurricanes Ike and Gustav in the fall of 2008 [2]. Use of social networks such as Facebook and Twitter has also been noted as providing great ease during the recent demonstrations in Middle East [4]. In light of these notable outcomes, understanding information diffusion over online social networks is a critical research goal. This greater understanding can be achieved through data analysis, the development of reliable models that can predict outcomes of social processes, and ultimately the creation of applications that can shape the outcome of these processes.
II. STATE OF THE ART
This study builds on work done on social media analysis and information diffusion. This section concisely discusses related work in all of those areas.
A. Social network analysis
Regarding the social media analysis field, we tend to have an interest within the structural analysis of the underlying social network and stream analysis of the information flow. Social network analysis constitutes a protracted established field in several areas [5]. Many scientists have investigated the structure of varied social media platforms and enforced careful analysis [6, 7, 8]. Normally, they study typical characteristics of social networks like (among others) the existence of power law distributions and small world properties.
The information diffusion field investigates how information (news, rumors etc) propagates among folks. Most of the basic analysis on the flow of data and influence through networks has been enforced within the context of medicine and therefore the unfold of diseases [9]. two distinguishing classes of related analysis that investig ate are 1) mechanisms of data diffusion and 2) structure and dynamics of data cascades as an additional targeted approach. The primary one includes how users share data and the way varied events impact on different temporal behaviour [10]. Moreover, distinguishing influentials or super spreaders is crucial for understanding the data propagation procedure [11]. Extremely connected with the task of distinguishing key users is that the drawback of influence maximization that is what percentage and that users ought to be targeted so as to possess most unfold [12]. This drawback is kind of widespread in advertising and viral marketing [13]. Another approach, ignoring utterly the structure of the network is inferring methods of influence by taking into thought solely infection time [14]. Quite relevant to our project is that the work by Ogan et al. [15] who study user interactions on Twitter and that they are building algorithms to reconstruct the conversational graphs.
III. TWO INGREDIENTS
Given that several real world networks appear to show power-law degree distributions, what preferred to do is to come up with a network model which will turn out these distributions as well. And for this, two ingredients are aimed at.
A. The network grows over time
So, as time goes on, one has got additional nodes further to the network and additional edges. There are several networks that this appears plausible, as an example if examined citation networks. Once a brand new paper is written, it'll cite papers that have precede it. Though social networks don't seem to be power law and this can be not most individuals don't need to attach to extremely popular people. However practically speaking, individuals will not sustain during a significant approach with thousands or tens of thousands of friends. Thus even if social networks don't seem to be parallel, an identical dynamic wherever individuals be a part of the network over time, whether or not through birth or another method that they land during a given social network. And then, they go to start out forming edges to alternative people with, at intervals that network. There is going to be a second element, that is that once an individual inherit the network, to own some edges that are allotted, as an example, if one has a new paper, one is going to own say, around thirty or a hundred citations that one is going to convey to the papers that have preceded. Within the papers context, what one is deciding between is citing a paper that nobody else has cited or citing a paper that millions of people have cited. Within the social network context, one may be deciding between connecting to
somebody who does not have several if the other connections or connecting to somebody who is well-liked and has millions of social ties and if one set forth the one who has numerous social ties. In fact, if the individual favours him or her in proportion to the amount of ties that they need, then this can be known as discriminatory attachment or cumulative advantage as depicted in Fig. 1.
Fig 1. Discriminatory attachment
Considering to first look at the first factor, which is that the network is growing. To simulate this scenario net logo is used to grow a network where each new node comes in with two edges that it allocates. In this one can see that some nodes have more edges than others. But, it's still relatively evenly distributed, the edges are between the nodes. From this some properties of the degree distribution can be derived here. And what's going is that at each time step one has one new node coming in with m edges to allocate, which means that at time
Fig 2. Network grows over time
step t there're going to have t nodes. This is depicted in Fig. 2. Now, observing at a node that's born at time i, and call its degree ki. Knowing that ki on average is going to be changing
individual node is competing with those t others for the m edges. Analysing further, over the lifetime of that node since time i when it was born, to time t. How many edges do we expect that it has? So we integrate the change in its degree from i to t, and we add the m edges that it had up front. i.e.
)
log(
)
(
i
t
m
m
t
k
i
. From this, it can be observed that onaverage nodes that were born earlier are going to have more edges than node that are born later. i.e.
k
i(
t
)
k
j(
t
)
ifi
j
Since they've simply been around longer and have accumulating these edges. This gives us another view of social networks, that what other modifications to the model might you make in order to make it more realistic? Fig. 3 describes this scenario.
Fig 3. Older nodes accumulate more edges
In the above simple model inspite of no modifications, it has just nodes arriving over time. To derive the degree distribution the fact that nodes that are born later are going to have lower degree on average is been considered. So, for example, if one want to know what is the property that a node has degree a hundred or less, we are going to figure out at what time a node with average degree hundred was born. This is denoted that time
and then the fraction of nodes that have lower degree are just going to be the ones who are born afterwards. So, this is (t –
)/t. And the solution for the degree of a node that was born at time
from before. So, thisis been solved for
(
)
log(
)
t
m
m
t
k
from thisequation and derive an exponential distribution for the degree
of the nodes. i.e.
m
m
k
t
)
log(
and mm k
e
t
. The
probability that a node has degree k or less is 1-
/t andm m k
e
k
k
P
'
1
)
(
'. So, given that this is an exponential distribution, what could be concluded is, what do one expect to this degree distribution to look like on a log-log plot? It is going to be a straight line.
B. Preferential attachment
That is when the new node comes in, they're not going to just connect to any node at random. They're going to prefer some over others and in fact, the ones that they are going to prefer
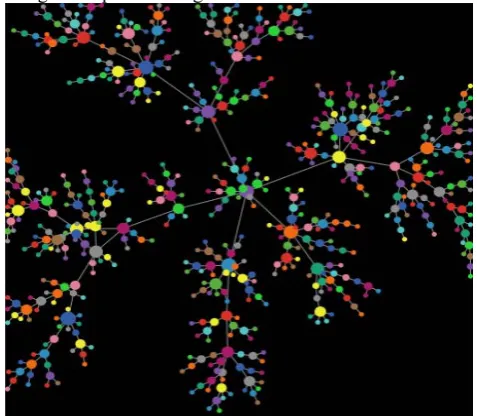
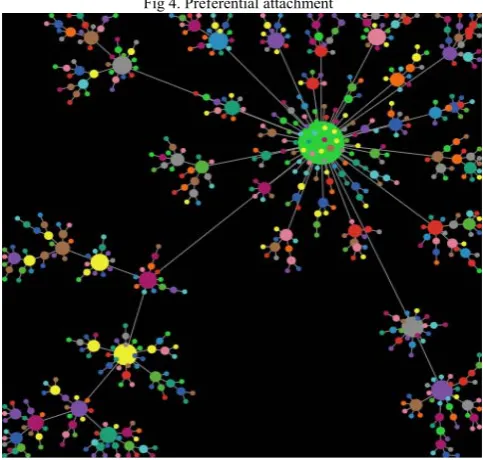
are the ones that already have a lot of edges. This kind of process is also known as accumulative advantage process, a rich get richer phenomenon, or the Matthew effect. That is, those nodes who already have a lot of edges are going to get even more disproportionately which is depicted in Fig. 4. In fact, it's going to be proportional to the number of edges that they already have.
Fig 4. Preferential attachment
The first such law proposed for networks was proposed by Price for citation networks. In his model, one has papers coming in and each paper is going to site m, other papers on average. But instead of just citing any old paper can find, it's going to cite other papers in proportion to the number of citations the paper already receives plus 1. That plus 1 is a little trick that makes the model works because a lot of papers start out with no citations at all. So, if one were citing in proportion to number of citations one would have cold start problem which helps the process along.
The process generates a very nice degree distribution which has a power law exponents with α = 2+1/m. A lot of the real-world citation networks do have power law exponents slightly above 2. So, it's just a very nice match and a very nice description of reality, where a few papers get lots and lots of citations, thousands, tens of thousands, but most papers are relatively neglected. This is shown in Fig. 5. They get no citations at all or just a couple.
Figure 5. Few nodes get more citations
But if a person thinks, oh, they're so popular, let me connect to them. Now, how does this translate to papers, why would you want to cite papers that already well cited? Well, for one, they're probably better but there's also a lot of anecdotal evidence that it's a little bit of the luck of the draw. One can have two scientists making pretty much the same discovery, but one paper gets a lot of attention and the other one is relatively unknown.
So, how can this happen. Well, one way in which it happens is through a copying mechanism. So, when one reading a paper that s/he think is relevant to one’s research, s/he going to look at the references and the papers that it cites. And then, one might copy one of those references into her/his own paper, after s/he reads it. And if one think about it, the chance that s/he encounters a citation to a paper is proportional to the number of papers who cite it. Now, there could be other mechanisms. For example, the better cited a paper is, the more likely it is that the authors are invited to give talks, which in turn means that more people find out about the paper etc. Attachment mechanism.
Now, what really set off a lot of research in complex networks was the model proposed by Barabasi and Albert, which is similar to the Price model, but not quite. And what they were aiming to do was to describe why there is a power law distribution in the number of n links that different pages receive. So, in their model, you have new web pages arriving over time and out of which each going to link with m links on average to web pages that are already there. And the probability of linking to an existing page is going to be proportional to the number of other pages that already link to
that page. And so, this probability
j j i
k
k
m
i
)
(
here.That a given node is node is going to connect to node i, i is going to be proportional, is going to be equal to m, which is a
number of new things that it has to add the degree of node i over the sum of the degrees of all the other notes. And this
results in a power law exponent of 3, which is a little bit problematic because the web degree distributions are much
closer to two and three is a relatively steep a power law
exponent meaning that you don't get the most popular websites would not be as popular as you would see in the real
world. So but one can correct for this in various ways, and Barabasi and Albert did indeed do this later by introducing different fitness for different sites meaning that some sites are
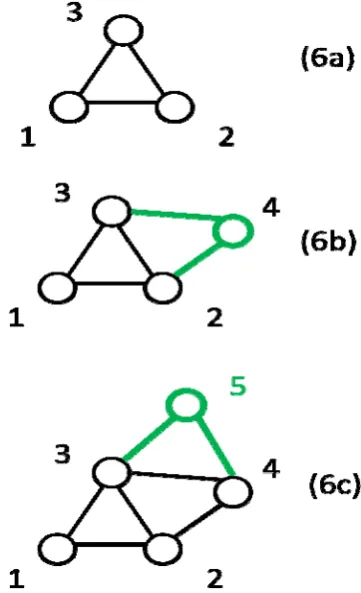
just a little bit more interesting. And so, they get more links. Fig. 6 depicts how this model works. So, if one were to simulate it, one would start say with a connected component of 3 nodes who all link to each other as in Fig. 6a. And now, by adding new nodes one by one. But one wants to keep track
of the degree of each node. And so, for each edge, record the end points and enter them into a flat list. And then, when a new node comes in, so say 4 comes in as at Fig. 6b, it's going to choose from this list of 1, 1 2, 2 3, 3. But now, if it happens
to choose 3, now 3 has degree 3, and is represented 3 times. And, so now, when 5 comes in as at Fig. 6c, it's a little bit
more likely that it's going to choose 3 as well over 1 or 2 actually over 1 which has degree 1 still.
Fig 6. Older nodes accumulate more links
we've already specified this. At each time step, there are m new links going around, and they're going to be allocated in proportion to the degree of the node divided by the sum of the
degrees.
t
k
tm
k
m
dt
t
dk
i i i2
2
)
(
with
k
i(
i
)
m
and2 / 1
)
(
)
(
i
t
m
t
k
i
And here, it's just t times m edges, and youhave 2 end points for each edge so it's just t, t times m times 2. And what we'll see again is that if we want to figure out what the probability is that a node has degree, say
k
'
prime or less, what we want to figure out is that what time point
was thenode with average-degree
k
'
prime born.2
'
k
m
t
and 2 2 ''
1
)
(
k
m
k
k
P
And then, we know that everyone bornafter that will on average have had lower degree.
And so, following a similar derivation, the distribution that says, the probability that a node had degree k is
3 2
2
)
(
k
m
k
p
. So, this is the power law exponent of three.Besides this power law distribution, other properties of this network would be, the one actually holds for the growth model as well is that it's just a single connected component. And this is simply due to the mechanism which is that by adding a node at a time. And it's linking to the nodes that are already there, who link to the nodes that are already there and so everything ends up being connected. In a growth model where new nodes were being added, but the new edges were not necessarily coming from the new node. And in that case, of course, one don't necessarily get everyone in the same component.
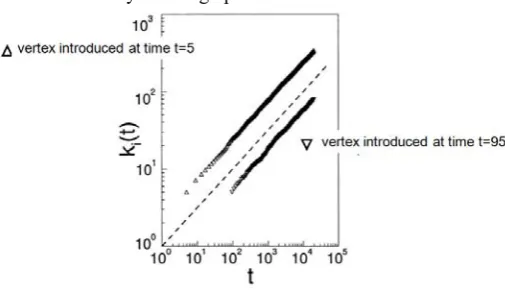
For some graphs, it might make sense. For example, for web pages, one might assume that may be the links are only added when the web created, and then not added after the fact. But for other networks, it might make more sense, if one has social network, may be initially a person who's come to a new city doesn't know anyone but they get to know someone and may get more people. So, it really depends. For citation network, this seems to be a very appropriate model. And the final observation which is also consistent with the random growth model is that, again, you have the older nodes having more edges. And the newer nodes, the young ones, actually don't really have a chance to catch up. Because they're born much later, and so they're born with very few edges. The older nodes have been around longer and some of them have gotten really big, so they're going to continue to accumulate. In Fig. 7, if one looks at these two nodes, one was born at time equals 5, and the other was born at time equals 95. And so, one can see that they're both kind of tracking in terms of their growth. And since this is a log scale, really at the point that the older node
has over 100. Edges this younger node just has a few dozen. And it's not really catching up.
Fig 7. Young vs. old in BA model
It is necessary to look at the degree distribution and also the size of the nodes if the difference in the two networks can be spotted. Relative to the random growth model, the degree distribution in the preferential attachment model resembles power-law distribution more.
IV. CONCLUSIONS
Most networks aren't born they're made. They grow over time and this means that some nodes, the older nodes might accumulate more than others. But, if one has the additional ingredient of preferential attachment, then nodes that end up with more edges as the network grows are going to accumulate even more for edges at the expense of other less fortunate nodes. i.e. it further skews the degree distribution towards a power-law.
REFERENCES
[1] Divyakant Agrawal, Ceren Budak, Amr El Abbadi, Information Diffusion In Social Networks: Observing and Influencing Societal Interests*, VLDB ‘11,Endowment
[2] A. L. Hughes and L. Palen. Twitter adoption and use in mass convergence and emergency events. In Proceedings of the6th International Information Systems for Crisis Response and Management Conference, 2009.
[3] L. Grossman. Iran protests: Twitter, the medium of the movement. Time (online), June 2009.
[4] C. Smith. Egypt’s facebook revolution: Wael ghonim thanks the social network. The Huffington Post, February 2011.
[5] Io Taxidou, Realtime Analysis of Information Diffusion in Social Media. VLDB Endowment 21508097/13/10, 2013
[6] A. Mislove et al. Measurement and analysis of online social networks. In Internet Measurement Conference, pages29–42, 2007
[7] H. Kwak et al. What is twitter, a social network or a newsmedia? In WWW, pages 591–600, 2010.
[8] J. Ugander et al. The anatomy of the facebook social graph.In CoRR, 2011.
[9] E. Stattner and N. Vidot. Social network analysis inepidemiology: Current trends and perspectives. In RCIS, pages 1–11, 2011.
[10]S. Wu et al. Who says what to whom on twitter. In WWW, pages 705– 714, 2011.
[11]M. Cha et al. Measuring user influence in twitter: The million follower fallacy. In ICWSM, 2010.
[12]Y.-C. Chen et al. Efficient algorithms for influence maximization in social networks. In Knowl. Inf. Syst., pages577–601, 2012.
[14]M. Gomez Rodriguez et al. Inferring networks of diffusion and influence. In SIGKDD, pages 1019–1028, 2010.