ISSN:2574 -1241
Different Semantic Processing of Chinese Character and
Japanese Kanji in Bilingual Brain
Zhenglong Lin
1, Wentao Zhang
1, Xiujun Li
2, Hongzan Sun
3, Qiyong Guo
3, Geqi Qi*
4, Jinglong Wu
5,6and
Xintao Zhang*
11Department of Sports Medicine and Rehabilitation, China
2School of Computer Science and Technology, China
3Department of Radiology, China
4Department of Psychology, China
5Key Laboratory of Biomimetic Robots and System, Beijing Institute of Technology, China
6Cognitive Neuroscience Laboratory, Graduate School of Natural Science and Technology, Japan
*Corresponding author: Xintao Zhang and Geqi Qi, Department of Sports Medicine and Rehabilitation, Department of Psychology, China
DOI: 10.26717/BJSTR.2019.15.002732
Received: February 10, 2019 Published: March 08, 2019
Citation: Zhenglong L, Wentao Z, Xiu-jun L, Hongzan S, Qiyong G, Geqi Q, Jinglong W, Xintao Z. Different Seman-tic Processing of Chinese Character and Japanese Kanji in Bilingual Brain. Biomed J Sci & Tech Res 15(4)-2019. BJSTR. MS.ID.002732.
Keywords: Bilingual; Chinese Charac-ter; Japanese Kanji; Semantic Process-ing; FMRI
ARTICLE INFO abstract
Chinese and Japanese languages share virtually identical morpho graphic characters invented in ancient China. Although the number of kanji characters that are used is overwhelmingly larger in Chinese than in Japanese, about 70-80% of the characters used in both languages are used to express the same meaning. This urges us to ask whether Chinese characters and Japanese kanjis share the same semantic processing network in the brain of a Chinese-Japanese bilingual or a Japanese-Chinese bilingual. To answer this question, we investigated brain activations associated with Chinese character and Japanese kanji semantic judgment tasks in 13 native Chinese speakers literate in Japanese (Chinese-Japanese bilinguals) and 13 native (Chinese-Japanese speakers literate in Chinese ((Chinese-Japanese-Chinese bilinguals) using functional magnetic resonance imaging. The results showed a largely common neural network for semantic processing of Chinese characters and Japanese kanjis in all bilinguals. However, there was also some difference possibly due to different neural strategies adapted by the two groups of bilinguals. We suggest that the Chinese-Japanese bilinguals utilized the usual strategy of directly mapping between orthography to meaning, while the Japanese-Chinese bilinguals utilized a detour pass of linking orthography to phonology to assist determining meanings of the words.
Introduction
One of the most important questions concerning language processing in the bilingual brain is whether the two languages share the same neural structure for comprehension [1-3]. Previous studies have collected data predominantly from subjects whose first (L1) and second (L2) languages both use alphabetic scripts. According to some of these studies, lexical and semantic storage of the two languages are largely localized in the same brain regions [1,4-6]. Others also reported some deviations due to additional executive demand of tasks or grammatical construction differences [7-11].
Japanese-Chinese Bilinguals are outstanding examples of those who have L1 and L2 presented with the same writing system - logogram. The Japanese and Chinese languages both use an extremely sophisticated writing system that uses kanji ideograms [18,19]. Also, the number of kanji characters that are used is overwhelmingly larger in Chinese than in Japanese, and about 70-80% of the characters used in both languages are used to express the same meaning. Although Previous Functional Resonance Magnetic Imaging (FMRI) studies on alphabetic language have shown effect of orthographic depth between L1 and L2 on language processing network [20,21]. In contrast to grapheme-to-phoneme mapping alphabets, logographic characters used in Chinese and Japanese languages map grapheme to a meaningful unit-morpheme or a word [17]. Thus, in principle, we could read Chinese characters/ kanjis directly for meaning without pronunciation. Based on these premises, we want to know whether bilinguals in Chinese and Japanese utilize the same lexico-semantic route for both languages, without involving neural network for phonological processing. So far, only one study has directly compared processing of L1 and L2, both of which use logographic script [22].
In that study, the authors investigated brain activation associated with Japanese and Chinese sentence reading in native Japanese speakers literate in Mandarin and native Chinese speakers literate in Japanese using functional magnetic resonance imaging. The results showed that both languages share the same processing network, while at the same time utilizing regions, which are dedicated to processing of one language but not the other. The goal of the present study is to compare the activation patterns during semantic processing in bilinguals of logographic language, using Chinese and Japanese words. Word reading is different from sentence reading, since the latter follows a more complicated syntax rules that bring the word components together into a context. For example, despite their common use of ideograms, Chinese characters and Japanese kanji are regarded very differently in sentences. A Japanese sentence is usually consisted of both kanji (morphograms) and kana (phonograms) and therefore it is a complex mixed system of phonograms and morphograms [23]. On the other hand, Chinese readers can convert character into corresponding sounds, or they can primarily read and understand the meaning of sentences written in character without first converting characters into sounds, a process like sight reading in English [24,25].
To exclude the complex processing of sentence reading, the cur-rent study specifically compared Chinese and Japanese word pro-cessing in bilinguals while they decided whether two pairs of Chi-nese characters or JapaChi-nese kanjis were similar in meaning or not. Our purpose is to identify the networks involved in semantic pro-cessing of Chinese characters and Japanese kanjis, to test if words of
both the languages use the same network without involving phono-logical processing. Furthermore, we want to quantify the differenc-es of semantic procdifferenc-essing in the two languagdifferenc-es if there are any. This would indicate whether the two groups of bilinguals use the same strategy for semantic processing of logographic characters.
Materials and Methods
Subjects
Twenty-six healthy college students participated in this FMRI study. All participants were right-handed. None of the participants displayed any signs or had any previous history of medical or neurological diseases. Written informed consent was obtained from each participant in accordance with the guidelines approved by Ethics Committees of the Shengjing Hospital of the China Medical University and Okayama University. The group of Chinese-Japanese bilingual participants consisted of 13 native Chinese (7 males and 6 females, aged 23.3±0.9 years), and they had learned Japanese for a period of 4.1±0.8 years. The group of Japanese- Chinese bilingual participants consisted of 13 native Japanese (7 males and 6 females, aged 22±2.2 years), and they had learned Chinese for a period of 3.7±2.1 years. At the time of the experiment, all Japanese-Chinese bilinguals were studying in China and were using Chinese daily. The Chinese-Japanese bilinguals’ proficiency in grammar and vocabulary in Japanese was assessed with the level 1 Japanese language proficiency test, which was administered by Japan Educational Exchanges and Services. Between the two groups, their ages [t (12) =2.27, p>0.04] and L2 learning periods [ t (12) = 1.32, p>0.2] were matched.
Experimental Design
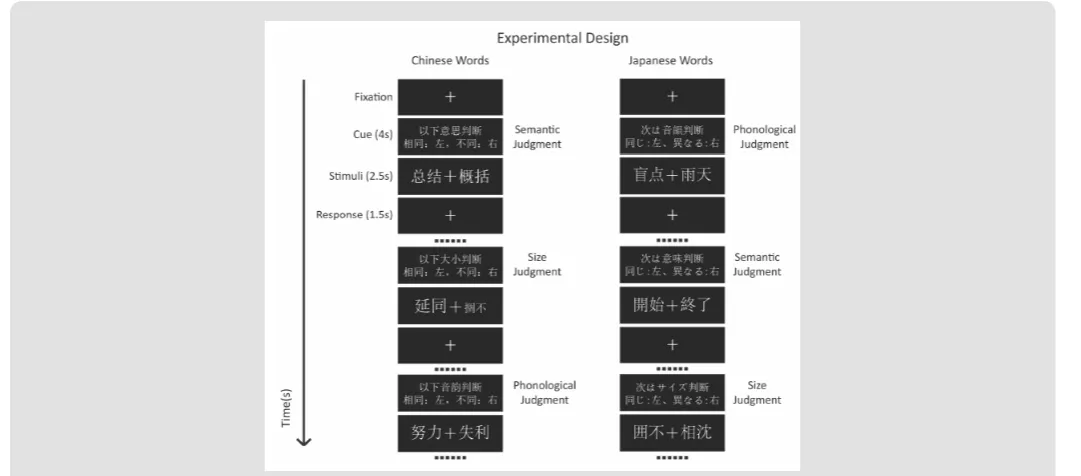
Figure 1: A block design was adopted, and each session contained 6 experimental blocks (36s), interleaved by rest conditions (24s). The blocks were evenly divided into the 3 experimental tasks (semantic, phonological and size judgment), and randomly distributed within a session. At the start of each block, a cue was presented for 4s to prompt what task was to be completed in the next series of trials. The stimuli were presented for 2.5s, each followed by 1.5s of fixation point. Such trails were repeated 8 times in each experimental block.
Table 1: Stimuli examples from six task events.
Response Task Same Different Same Different
Semantic Judgment Task 总结+概括 平常+别致 準備+用意 開始+終了
Meaning:
Sum-mary Meaning: Usual + Unique Meaning: Preparation Meaning: Start + Ending
Phonological Judgment Task 努力+失利 勤奋+失败 盲点+雨天 万全+利害
Pronunciation:
Nuli + Shili Pronunciation: Qinfen + Shibai Pronunciation: Mouten + Uten Pronunciation: Manzen + Rigai
Size Judgment Task 延同+搁不 醒放+张祸 似主+油談 囲不+相沈
Non-Chinese
words Non-Chinese words Non-Japanese words Non-Japanese words
FMRI Data Acquisition
Functional imaging data were acquired using a 3T Philip signal scanner at the Shengjing Hospital of China Medical University. A total of 192 FMRI volume images were collected during each session. Echo-Planar Images (EPIs) sensitive to the Blood Oxygen Level-Dependent (BOLD) response of 36 slices were acquired using the following scan parameters: TR, 2000ms; FoV, 192x192; matrix size, 62×64; voxel size, 3×3×3.5 mm3; slice thickness, 3.5 mm; slice gap, 0 mm; effective echo time (TE) = 30 ms, flip angle (FA), 90°. After functional scanning, three- dimensional (3D) T1-weighted anatomical images with TR = 9.5 ms, TE = 4.6ms, 1 mm3 isotropic voxel size (matrix 256×256×182) were acquired for cortex normalization and cortex surface reconstruction.
FMRI Data Analysis
The parameter from this normalization process was then applied to each functional image. Finally, the normalized functional
Random Effects Group Analysis: We evaluated the linear contrasts in each subject and obtained the contrast images that were used for the random-effect group analysis. In the group analysis, we performed a full- factorial analysis for each contrast. The height threshold for SPM[t] was set at 3.93 (equivalent to P<0.001 uncorrected). The statistical threshold for the spatial extent test on the clusters was set at P<0.05 and corrected for multiple comparisons over the search volume. Coordinates in MNI space were transformed into Talairach spae and the brain regions were anatomically defined and labeled using Automated Anatomical Labeling (AAL) software package [27]. We conducted both whole brain and Region-of-Interest (ROI) analyses. In the whole brain analysis, the search volume was the whole brain. In this analysis, we compared the semantic judgment task of each language with the fixation condition to identify the activation maps of the regions involved in semantic processing (Table 2). To create the ROIs, we looked for regions, which showed a main effect of semantic judgment task over both languages and subject groups in the full factorial analysis (independent).
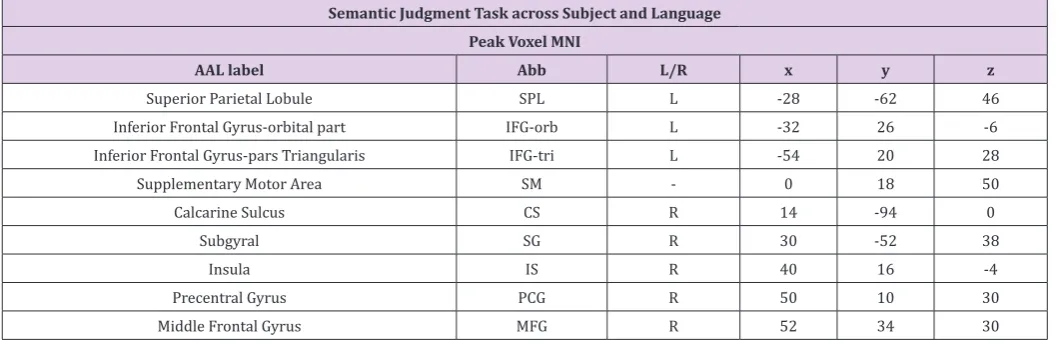
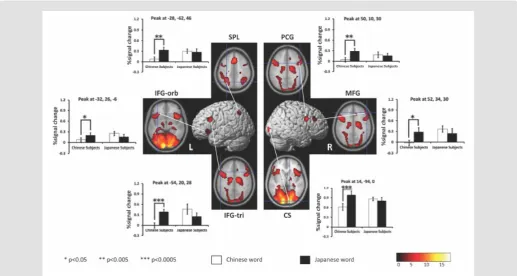
The activation map was thresholded at p<0.05 (corrected at cluster level) and consequently we identified 9 clusters, namely the left superior parietal lobule, left inferior frontal gyrus-orbital part, left inferior frontal gyrus pars triangularis, left supplementary motor area, right calcarine sulcus, subgyral, right insula, right precentral gyrus and the right middle frontal gyrus (Table 3). To confirm the activation patterns during semantic processing, we used the MarsBaR toolbox (http://marsbar.sourceforge.net) to calculate the % signal changes for the ROIs. We extracted the % signal changes from 8-mm-diameter (corresponding to FWHM of spatial smoothing) spheres centered on the peak coordinates (Figure 3 & Table 3). The percent signal changes were then compared using repeated-measures ANOVA in SPSS 13.0 (SPSS Inc., Tokyo, IL).
Results
Behavioral Results
The subjects responded more slowly and less accurately when they performed semantic and phonological tasks in their L2. However, no such difference between languages was observed in
performance during size judgment tasks. A two-way ANOVA analysis was performed to examine the influence of language and subject group on response time and accuracy during semantic judgment task, and the results are described in the following. A significant main effect of language [F (1, 24) = 10.63, P = 0.003] and group [F (1, 24) = 6.09, P = 0.021] and language × group interaction [F (1, 24) = 5.96, P = 0.022] were observed. Pairwise comparisons with Bonferroni corrections showed that the L2 resulted in significantly longer response times than the L1 for native Chinese [P < 0.001].
In addition, native Japanese had significantly longer response times than native Chinese with L1 [P = 0.006]. We found a significant main effect of language [F (1, 24) = 56.09, P < 0.001] and group [F (1, 24) = 8.57, P = 0.007], but language × group interaction was not significant. Pairwise comparisons with Bonferroni corrections showed that the L1 resulted in significantly higher accuracy than the L for both native Chinese [P < 0.001] and native Japanese [P < 0.001]. In addition, native Chinese had significantly higher accuracy than native Japanese during L1 [P < 0.01]. No statistically significant result was obtained during font size task for both response times and accuracy.
Imaging Results
Whole Brain Results: Whole brain activations during Chinese character and Japanese kanji semantic judgment tasks are shown in Figure 2 and Table 2. Both groups of subjects showed extensive activation along the bilateral ventral visual stream, suggesting a significant load of visual form processing for decoding visually complex Chinese character and Japanese kanji. In addition, there are activations in language-related regions, including the left IFG (Inferior Frontal Gyrus) and left IPL (inferior parietal lobule), which are involved in semantic processing. When statistical significance at cluster level was set at p<0.05 (FDR), activation patterns in native Chinese speakers were constrained to striate, extrastriate and temporal cortex regardless of the language. Native Japanese speakers, on the other hand, showed more extensive brain activation during Chinese character semantic task compared to Japanese kanji semantic task. Consistent with previous studies, the overall activation patterns associated with Chinese character and Japanese kanji in both subject groups are bilateral, suggesting a right hemispheric advantage for processing these words.
Table 2a.
AAL Label L/R Brodmann Area x y z Volume T (N=13)
Occipital Lobe
Calcarine L BA17 -12 -90 -4 1044 7.52
Calcarine R BA17 14 -94 0 919 7.35
Cuneus L BA18/19 -8 -94 6 113 4.36
Cuneus R BA18/19 16 -94 6 135 5.38
Lingual gyrus L BA18/19 -14 -90 -2 1261 7.38
Lingual gyrus R BA18/19 26 -70 -2 1230 5.78
Superior occipital gyrus L BA18/19 -12 -90 2 297 6.92 Superior occipital gyrus R BA18/19 20 -96 4 117 5.78 Middle occipital gyrus L BA18/19 -14 -90 -4 932 7.3
Middle occipital gyrus R BA18/19 24 -96 4 207 4.91
Inferior occipital gyrus L BA18/19 -12 -96 -8 709 6.12 Inferior occipital gyrus R BA18/19 22 -92 -2 509 5.36
Fusiform gyrus L BA37 -34 -76 -16 777 5.78
Fusiform gyrus R BA37 26 -70 -4 816 5.9
Temporal Lobe
Inferior temporal gyrus L BA20 -43 -40 -28 257 4.86
Inferior temporal gyrus R BA20 44 -58 -16 25 3.58
Frontal Lobe
Supplementary motor area L BA6 0 16 50 180 3.8
Parietal Lobe
Angular gyrus R BA39 28 -50 36 21 3.34
Other
Caudate L NA -14 -10 28 201 5.2
Caudate R NA 12 -10 26 469 6.21
Insula R NA 36 22 -2 133 3.95
Cerebelum L NA -10 -80 -14 1600 5.7
Cerebelum R NA 8 -70 -10 976 5.38
Table 2b.
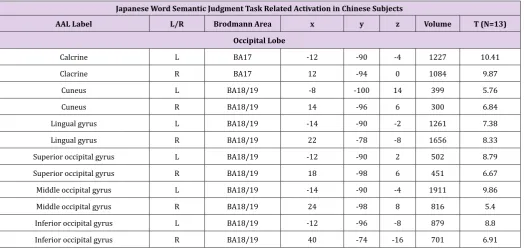
Japanese Word Semantic Judgment Task Related Activation in Chinese Subjects
AAL Label L/R Brodmann Area x y z Volume T (N=13)
Occipital Lobe
Calcrine L BA17 -12 -90 -4 1227 10.41
Clacrine R BA17 12 -94 0 1084 9.87
Cuneus L BA18/19 -8 -100 14 399 5.76
Cuneus R BA18/19 14 -96 6 300 6.84
Lingual gyrus L BA18/19 -14 -90 -2 1261 7.38
Lingual gyrus R BA18/19 22 -78 -8 1656 8.33
Fusiform gyrus L BA37 -34 -74 -18 1080 8.16
Fusiform gyrus R BA37 24 -72 -6 1077 8.31
Temporal Lobe
Middle temporal gyrus L BA21 -48 -50 -6 17 2.8
Inferior temporal gyrus L BA20 -44 -46 -28 723 6.49 Inferior temporal gyrus R BA20 48 -62 -20 485 4.69
Frontal lobe
Superior medial frontal gyrus R BA8/9/10 2 24 50 42 s
Supplementary motor area L BA6 -2 16 50 823 4.65
Inferior frontal gyrus, orbital part L BA44 -28 28 -6 50 3.7 Inferior frontal gyrus, orbital part R BA44 34 42 -20 79 3.69
Inferior frontal gyrus, triangal
part L BA45 -50 14 28 215 3.85
Inferior frontal gyrus, triangal
part R BA45 58 32 16 80 3.23
Inferior frontal gyrus, opercular
part L BA47 -50 12 28 173 3.79
Inferior frontal gyrus, opercular
part R BA47 46 10 30 309 4.03
Middle frontal gyrus L BA10 -52 14 40 119 3.6
Middle frontal gyrus R BA10 50 46 14 231 3.55
Precentral gyrus L BA4 -50 12 30 218 3.74
Precentral gyrus R BA4 46 8 30 175 4.05
Postcentral gyrus L BA2 -38 -30 42 16 2.64
Parietal Lobe
Angular gyrus L BA39 -32 -50 36 33 3.44
Angular gyrus R BA39 30 -54 42 157 3.6
Superior parietal gyrus L BA7 -28 -64 48 323 4.52
Superior parietal gyrus R BA7 32 -62 50 32 3.21
Inferior parietal gyrus L BA40 -36 -44 38 552 4.09 Inferior parietal gyrus R BA40 38 -44 42 116 3.3
Other
Caudate L NA -20 -26 20 77 4.88
Caudate R NA 12 -2 20 131 4.8
Putamen L NA -30 6 -4 51 3.41
Putamen R NA 32 4 0 104 3.85
Insula L NA -36 16 -2 214 3.95
Insula R NA 36 20 -2 279 4.34
Hippocampus L BA28 -30 -28 -8 154 3.95
Hippocampus R BA28 28 -34 4 130 4.64
Cerebulum L NA -34 -74 -20 3106 8.2
Table 2c.
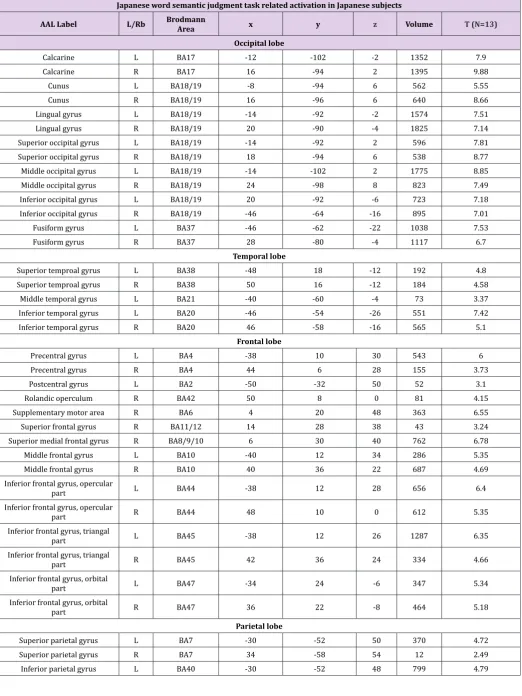
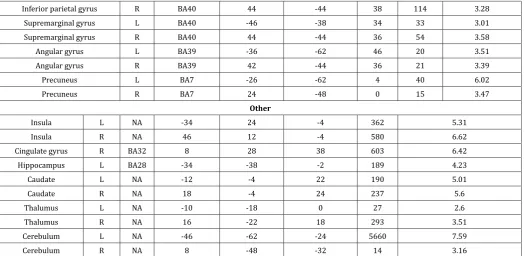
Japanese word semantic judgment task related activation in Japanese subjects
AAL Label L/Rb Brodmann Area x y z Volume T (N=13)
Occipital lobe
Calcarine L BA17 -12 -102 -2 1352 7.9
Calcarine R BA17 16 -94 2 1395 9.88
Cunus L BA18/19 -8 -94 6 562 5.55
Cunus R BA18/19 16 -96 6 640 8.66
Lingual gyrus L BA18/19 -14 -92 -2 1574 7.51
Lingual gyrus R BA18/19 20 -90 -4 1825 7.14
Superior occipital gyrus L BA18/19 -14 -92 2 596 7.81 Superior occipital gyrus R BA18/19 18 -94 6 538 8.77 Middle occipital gyrus L BA18/19 -14 -102 2 1775 8.85 Middle occipital gyrus R BA18/19 24 -98 8 823 7.49 Inferior occipital gyrus L BA18/19 20 -92 -6 723 7.18 Inferior occipital gyrus R BA18/19 -46 -64 -16 895 7.01
Fusiform gyrus L BA37 -46 -62 -22 1038 7.53
Fusiform gyrus R BA37 28 -80 -4 1117 6.7
Temporal lobe
Superior temproal gyrus L BA38 -48 18 -12 192 4.8
Superior temproal gyrus R BA38 50 16 -12 184 4.58
Middle temporal gyrus L BA21 -40 -60 -4 73 3.37
Inferior temporal gyrus L BA20 -46 -54 -26 551 7.42
Inferior temporal gyrus R BA20 46 -58 -16 565 5.1
Frontal lobe
Precentral gyrus L BA4 -38 10 30 543 6
Precentral gyrus R BA4 44 6 28 155 3.73
Postcentral gyrus L BA2 -50 -32 50 52 3.1
Rolandic operculum R BA42 50 8 0 81 4.15
Supplementary motor area R BA6 4 20 48 363 6.55
Superior frontal gyrus R BA11/12 14 28 38 43 3.24
Superior medial frontal gyrus R BA8/9/10 6 30 40 762 6.78
Middle frontal gyrus L BA10 -40 12 34 286 5.35
Middle frontal gyrus R BA10 40 36 22 687 4.69
Inferior frontal gyrus, opercular
part L BA44 -38 12 28 656 6.4
Inferior frontal gyrus, opercular
part R BA44 48 10 0 612 5.35
Inferior frontal gyrus, triangal
part L BA45 -38 12 26 1287 6.35
Inferior frontal gyrus, triangal
part R BA45 42 36 24 334 4.66
Inferior frontal gyrus, orbital
part L BA47 -34 24 -6 347 5.34
Inferior frontal gyrus, orbital
part R BA47 36 22 -8 464 5.18
Parietal lobe
Superior parietal gyrus L BA7 -30 -52 50 370 4.72
Superior parietal gyrus R BA7 34 -58 54 12 2.49
Inferior parietal gyrus R BA40 44 -44 38 114 3.28
Supremarginal gyrus L BA40 -46 -38 34 33 3.01
Supremarginal gyrus R BA40 44 -44 36 54 3.58
Angular gyrus L BA39 -36 -62 46 20 3.51
Angular gyrus R BA39 42 -44 36 21 3.39
Precuneus L BA7 -26 -62 4 40 6.02
Precuneus R BA7 24 -48 0 15 3.47
Other
Insula L NA -34 24 -4 362 5.31
Insula R NA 46 12 -4 580 6.62
Cingulate gyrus R BA32 8 28 38 603 6.42
Hippocampus L BA28 -34 -38 -2 189 4.23
Caudate L NA -12 -4 22 190 5.01
Caudate R NA 18 -4 24 237 5.6
Thalumus L NA -10 -18 0 27 2.6
Thalumus R NA 16 -22 18 293 3.51
Cerebulum L NA -46 -62 -24 5660 7.59
Cerebulum R NA 8 -48 -32 14 3.16
Table 2: Brain activation foci revealed by four semantic judgment tasks vs. rest condition (p<0.001 uncorrected, FDR corrected at cluster level).
Japanese word semantic judgment task related activation in Japanese subjects
AAL Label L/R Brodmann Area x y z Volume T (N=13)
Occipital lobe
Calcarine L BA17 -12 -102 -2 1006 7.57
Calcarine R BA17 16 -94 2 1115 9.9
Cunues L BA18/19 -8 -94 6 286 5.51
Cunues R BA18/19 16 -96 6 164 8.32
Lingual gyrus L BA18/19 -14 -92 -2 1049 7.52
Lingual gyrus R BA18/19 20 -90 -4 1094 7.64
Superior occipital gyrus L BA18/19 -14 -92 2 342 7.8 Superior occipital gyrus R BA18/19 18 -94 6 324 8.61
Middle occipital gyrus L BA18/19 -14 -102 2 1254 8.23
Middle occipital gyrus R BA18/19 24 -98 8 551 6.46
Inferior occipital gyrus L BA18/19 -10 -100 -8 679 5.52 Inferior occipital gyrus R BA18/19 22 -92 -2 257 6.87
Fusiform gyrus L BA37 -46 -62 -22 906 5.32
Fusiform gyrus R BA37 22 -80 -16 708 5.22
Temporal lobe
Superior temporal gyrus L BA38 -48 16 -10 17 3.15 Inferior temporal gyrus L BA20 -40 -38 -28 296 4.85 Inferior temporal gyrus R BA20 42 -42 -14 43 3.29
Frontal lobe
Supplementary motor area L BA6 -2 18 52 394 5.4
Superior medial frontal gyrus R BA8/9/10 0 24 50 210 4.79
Middle frontal gyrus R BA10 50 36 28 91 3.56
Inferior frontal gyrus, opercular part R BA44 48 12 24 223 3.69 Inferior frontal gyrus, triangal part L BA45 -32 28 -2 629 4.14 Inferior frontal gyrus, triangal part R BA45 52 36 26 106 3.78 Inferior frontal gyrus, orbital part L BA47 -32 26 -6 66 4.45
Parietal lobe
Superior parietal gyrus L BA7 -24 -64 44 183 4.37 Inferior parietal gyrus L BA40 -24 -66 44 196 4.39 Inferior parietal gyrus R BA40 42 -46 38 32 3.2
Angular gyrus R BA39 42 -46 36 34 3.04
Other
Insula L NA -32 26 -4 36 4.38
Insula R NA 38 18 -8 137 3.86
Cingulate gyrus R BA32 12 26 40 24 3.43
Hippocampus L BA28 -34 -30 -8 21 2.93
Hippocampus R BA28 40 -32 -12 122 3.62
Caudate L NA -8 6 18 10 3.3
Thalamus R NA 16 -8 6 11 3.3
Cerebulum L NA -46 -64 -24 1548 5.62
Cerebulum R NA 22 -80 -18 1063 5.18
ROI Results: To further investigate brain regions involved in semantic processing of Chinese character and Japanese kanji, we created Regions of Interest (ROIs) based on the functional activation patterns during both sematic judgment tasks. The analysis has been described in the materials and method part. 9 ROIs were defined, namely the left superior parietal lobule (LSPL), left inferior frontal gyrus-orbital part (LIFG-or), left inferior frontal gyrus pars triangularis (LIFG- tr), left supplementary motor area (LSMA), right calcarine sulcus (RCS), subgyral (SG), right insula (RI), right precentral gyrus (RPG) and the right middle frontal gyrus
(RMGF). We calculated the percent signal changes in these regions for both semantic tasks in each subject and performed two-way ANOVA analysis, which confirmed the observation below (Table 3). Three regions showed main effect of language, namely LSPL [F (1, 12) =7.490, p<0.05], RCS [F (1, 12) = 7.303, p<0.05] and RPG [F (1, 12) = 6.142, p<0.05], and they were more strongly activated for Japanese kanji than Chinese character irrespective of the subject groups. These regions also showed significant interaction between subject group and language: LSPL [F (1,12) =6.629, p<0.05], RCS [F (1,12) =10.837, p<0.006] and RPG [F (1,12) = 5.643, p<0.05]. Table 3: Regions of Interest (ROI) for further comparison of L1 and L2 related activations.
Semantic Judgment Task across Subject and Language Peak Voxel MNI
AAL label Abb L/R x y z
Superior Parietal Lobule SPL L -28 -62 46
Inferior Frontal Gyrus-orbital part IFG-orb L -32 26 -6
Inferior Frontal Gyrus-pars Triangularis IFG-tri L -54 20 28
Supplementary Motor Area SM - 0 18 50
Calcarine Sulcus CS R 14 -94 0
Subgyral SG R 30 -52 38
Insula IS R 40 16 -4
Precentral Gyrus PCG R 50 10 30
Middle Frontal Gyrus MFG R 52 34 30
Follow up pairwise comparisons with Bonferroni corrections revealed that Chinese character more strongly activated LSPL (p<0.05) and RCS (p<0.05) in Japanese-Chinese bilinguals than those in Chinese-Japanese bilinguals. Also, Chinese-Japanese
p<0.005] and RMGF [F(1, 12)= 4.891, p<0.05]. Further pairwise comparisons with Bonferroni corrections revealed that Chinese character more strongly activated these three regions in Japanese-Chinese bilinguals than those in Japanese-Chinese-Japanese bilinguals: LIFG-or (p<0.005), LIFG-tr (p<0.05) and RMGF (p<0.05). In addition, Chinese-Japanese bilinguals showed stronger activation to Japanese kanji than Chinese character in these three regions: LIFG-or (p<0.05), LIFG-tr (0.0001) and RMGF (p<0.05).
Discussion
The current study investigated brain activations during Chinese character and Japanese kanji processing in two groups of bilinguals, namely a Chinese-Japanese bilingual group and a Japanese-Chinese bilingual group. Consistent with our hypothesis, the results showed a largely common neural network for semantic processing of Chinese words and Japanese words in the brain of all bilinguals. However, there were also some differences between the activation patterns of the two bilingual groups, possibly due to different neural strategies adapted by the two groups. Regardless of writing systems, recognizing words universally requires mapping of the graphic forms to their corresponding pronunciations and meanings. However, different writing systems emphasize on different part of the language decoding process [17], which in turn is reflected on the corresponding activation patterns in the brain.
For example, shallow orthographic writings such as Italian more actively engage a dorsal pathway as a reflection of the computation of assembled phonology from individual graphemes, whereas deeper orthographies such as English engage a ventral pathway along which computation of addressed phonology takes place Chinese writing has even deeper orthography that does not map grapheme to phoneme, but instead maps logographic character to a meaningful unit [28]. And visually, Chinese characters differ drastically from other writings with their nonlinear square packed configurations. It has been suggested that such visual complexity demands for holistic spatial processing, thus engaging both left and right hemisphere for decoding [29]. This stands in contrast to left hemisphere dominance of alphabetic writing processing.
Bilateral brain activation was expected and demonstrated during the semantic processing of Chinese words at typical language areas (Figure 1). The most extensive activation was observed in the bilateral occipital lobe and along the ventral visual stream. These regions have been reported to decode pictorial features and orthography of Chinese characters [30]. As mentioned previously, Japanese kanjis are essentially Chinese characters used to write Japanese. Thus, most kanjis used in modern Japanese still
retain their Chinese meaning, physical resemblance with some of their modern traditional Chinese characters counterparts. Kanji contrasts with the other part of the Japanese writing system--kana and utilizes a differential processing route in the brain [31, 17]. While kana depends on the dorsal stream from the occipital to the inferior parietal area, Kanji processing relies on the ventral stream from the occipital to the temporal cortex [31,32,17].
During semantic judgment task of Japanese words, both Chinese and Japanese bilingual groups showed strong activations in the ventral processing stream (Figure 2 & Table 2). This is consistent with previous findings from imaging studies of kanji processing [33,34]. Our results may suggest that semantic decoding of kanji depends heavily on visual orthographic retrieval and lexical-semantic system through the ventral route, regardless of the bilingual groups. Other notable activation was observed in supplementary motor cortex, indicating preparatory processing during the semantic judgment task [34,35]. The activation patterns for Japanese word semantic processing in the two groups of bilinguals were like that of Chinese word semantic processing in the Chinese bilingual group, suggesting a common neural mechanism working behind these phenomena. As discussed in the previous sections, our overall results show that Chinese and Japanese bilingual groups adapted different strategies while completing sematic judgment tasks in two languages. For the Chinese word semantic judgment task, Chinese bilingual group relied on ventral route, mapping graphic form of characters to lexical/semantic information; Japanese bilingual group, on the other hand, additionally recruited language regions in the frontal and parietal lobe for orthographic and phonological information retrieval to assist the determination of semantic judgment.
Figure 3: BOLD signal change comparison between L1 and L2 in the subjects. Upper: schematic presentation of cumulative results. Lower: percent signal change. Statistically significant differences are marked with star signs and the corresponding regions are written in red (p<0.05, corrected for cluster level). The MNI coordinates indicate the peak voxels of the ROI. The white bar represents percent signal change for Chinese character, while the black bar represents that for Japanese kanji.
These regions include right calcarine, right precentral gyrus and right middle frontal gyrus, all of which have been implicated in visuospatial and orthographic processing of written words. Furthermore, semantic processing left inferior frontal gyrus (pars orbitalis and pars triangularis also showed stronger BOLD signal change for Japanese words than Chinese words [39]. These findings suggest that Japanese word semantic judgment task leads to higher demand for resources involved in orthographic and sematic processing in the brain of Chinese bilinguals. This is consistent with previous findings showing less proficient second language elicits higher level of activations in language areas [36].
Conclusion
To summarize, our findings showed that both Chinese-Japanese and Japanese-Chinese bilinguals partially relied on occipital and temporal network for Chinese and Japanese words, which suggest emphasis on orthography-to-semantic mapping during semantic processing of logographic scripts. However, unlike Chinese bilin-guals, Japanese bilinguals showed more neural demand in fron-tal language areas, which may reflect a reliance on orthographic and phonological information for semantic processing of Chinese words. Further research is needed to account for the influence of one logographic processing on the other in the bilingual brain and better understand of how more than one language is comprehend-ed in the brain.
Acknowledgment
This work was supported in part by Sanming Project of Medicine in Shenzhen (No. SZSM201612078).
References
1. Illes J, Francis WS, Desmond JE, Gabrieli JD, Glover GH, et al. (1999) Convergent cortical representation of semantic processing in bilinguals. Brain Lang 70(3): 347-363.
2. Gomez Ruiz MI (2010) Bilingualism and the brain: Myth and reality. Neurologia 25(7): 443-452.
3. Van Heuven WJ, Dijkstra T (2010) Language comprehension in the bilingual brain: fMRI and ERP support for psycholinguistic models. Brain Res Rev 64(1): 104-122.
4. Hernandez AE, Dapretto M, Mazziotta J, Bookheimer S (2001) Language switching and language representation in Spanish-English bilinguals: an fMRI study. Neuroimage 14(2): 510-520.
5. Klein D, Zatorre RJ, Chen JK, Milner B, Crane J, et al. (2006) Bilingual brain organization: a functional magnetic resonance adaptation study. Neuroimage 31(1): 366-375.
6. Willms JL, Shapiro KA, Peelen MV, Pajtas PE, Costa A, et al. (2011) Language-invariant verb processing regions in Spanish-English bilinguals. Neuroimage 57(1): 251-261.
7. Halsband U, BJ Krause, H Sipila, M Teras, A Laihinen (2002) PET studies on the memory processing of word pairs in bilingual Finnish-English subjects. Behav Brain Res 132(1): 47-57.
8. Perani D, Abutalebi J, Paulesu E, Brambati S, Scifo P, et al. (2003) The
role of age of acquisition and language usage in early, high-proficient bilinguals: an fMRI study during verbal fluency. Hum Brain Mapp 19(3):
9. Frenck Mestre, C, JL Anton, M Roth, J Vaid, F Viallet (2005) Articulation in early and late bilinguals’ two languages: evidence from functional magnetic resonance imaging. Neuroreport 16(7): 761-765.
10. Marian V, Shildkrot Y, Blumenfeld HK, Kaushanskaya M, Faroqi Shah Y, et al. (2007) Cortical activation during word processing in late bilinguals: similarities and differences as revealed by functional magnetic resonance imaging J Clin Exp Neuropsychol 29(3): 247-265.
11. Kovelman I, SA Baker, LA Petitto (2008) Bilingual and monolingual brains compared: a functional magnetic resonance imaging investigation of syntactic processing and a possible neural signature of bilingualism. J Cogn Neurosci 20(1): 153-169.
12. Chee MW, Weekes B, Lee KM, Soon CS, Schreiber A, et al. (2000) Overlap and dissociation of semantic processing of Chinese characters, English words, and pictures: evidence from fMRI. Neuroimage 12(4): 392-403. 13. Tan LH, Spinks JA, Feng CM, Siok WT, Perfetti CA, et al. (2003) Neural
systems of second language reading are shaped by native language. Hum Brain Mapp 18(3): 158-166.
14. Gao H, Bai HM, Han LX, Li TD, Wang W, et al. (2013) Brain mappings
in non-fluent late Chinese-English bilinguals. Zhonghua Wai Ke Za Zhi
51(11): 1021-1024.
15. Cao F, Young Kim S, Liu Y, Liu L (2014) Similarities and differences in
brain activation and functional connectivity in first and second language
reading: evidence from Chinese learners of English. Neuropsychologia 63: 275-284.
16. Mei L, Xue G, Lu ZL, Chen C, Wei M, et al. (2015) Long-term experience with Chinese language shapes the fusiform asymmetry of English reading. Neuroimage 110C: 3-10.
17. Bolger DJ, Perfetti CA, Schneider W (2005) Cross-cultural effect on the brain revisited: Universal structures plus writing system variation. Human Brain Mapping 25(1): 92-104.
18. Jeong H, M Sugiura, Y Sassa, S Yokoyama, K Horie, et al. (2007)
Cross-linguistic influence on brain activation during second language
processing: An fMRI study. Bilingualism-Language and Cognition 10(2): 175-187.
19. Zhao J, Shu H, Zhang L, Wang X, Gong Q, et al. (2008) Cortical competition during language discrimination. Neuroimage 43(3): 624-633.
20. Beaton AA, NW Davies (2007) Semantic errors in deep dyslexia: does orthographic depth matter? Cogn Neuropsychol 24(3): 312-323. 21. Buetler KA, De León Rodríguez D, Laganaro M, Müri R, Spierer L, Annoni
JM, et al. (2014) Language context modulates reading route: an electrical neuroimaging study Front Hum Neurosci 8: 83.
22. Huang K, Itoh K, Kwee IL, Nakada T (2012) Neural strategies for reading Japanese and Chinese sentences: A cross-linguistic fMRI study of character-decoding and morphosyntax Neuropsychologia 50(11): 2598-2604.
23. Yokoyama S, J Kim, S Uchida, T Miyamoto, K Yoshimoto, et al. (2009) Left
middle temporal deactivation caused by insufficient second language
word comprehension by Chinese-Japanese bilinguals. J Neurolinguistics 22(5): 476- 485.
24. Luke KK, Liu HL, Wai YY, Wan YL, Tan LH (2002) Functional anatomy of syntactic and semantic processing in language comprehension. Human Brain Mapping 16(3): 133-145.
25. Mo L, Liu HL, Jin H, Yang Y (2005) Brain activation during semantic judgment of chinese sentences: A functional MRI study. Human Brain Mapping 24(4): 305-312.
26. Worsley,KJ, KJ Friston (1995) Analysis of fMRI time-series revisited-again. Neuroimage 2(3): 173-181.
27. Tzourio Mazoyer N, Landeau B, Papathanassiou D, Crivello F, Etard O, et al. (2002) Automated anatomical labeling of activations in SPM using a macroscopic anatomical parcellation of the MNI MRI single-subject brain. Neuroimage 15(1): 273-289.
28. Tan LH, Laird AR, Li K, Fox PT (2005) Neuroanatomical correlates of phonological processing of Chinese characters and alphabetic words: A meta-analysis. Human Brain Mapping 25(1): 83-91.
29. Tan LH, Spinks JA, Gao JH, Liu HL, Perfetti CA, et al. (2000) Brain activation in the processing of Chinese characters and words: a functional MRI study. Hum Brain Mapp 10(1): 16-27.
30. Guo Y, ED Burgund (2010) Task effects in the mid-fusiform gyrus: a comparison of orthographic, phonological, and semantic processing of Chinese characters. Brain Lang 115(2): 113-120.
31. Nakamura K, Honda M, Hirano S, Oga T, Sawamoto N, et al. (2002) Modulation of the visual word retrieval system in writing: a functional MRI study on the Japanese orthographies J Cogn Neurosci 14(1): 104-115.
32. Matsuo K, Chen SH, Hue CW, Wu CY, Bagarinao E, et al. (2010) Neural substrates of phonological selection for Japanese character Kanji based on fMRI investigations. Neuroimage 50(3): 1280-1291.
33. Nakamura K, Honda M, Okada T, Hanakawa T, Toma K, et al. (2000) Participation of the left posterior inferior temporal cortex in writing and mental recall of kanji orthography: A functional MRI study. Brain 123( Pt 5): 954-967.
34. Thuy DH, Matsuo K, Nakamura K, Toma K, Oga T, et al. (2004) Implicit and explicit processing of kanji and kana words and non-words studied with fMRI. Neuroimage 23(3): 878-889.
35. Blacker D, Byrnes ML, Mastaglia FL, Thickbroom GW (2006) Differential activation of frontal lobe areas by lexical and semantic language tasks: a functional magnetic resonance imaging study. J Clin Neurosci 13(1): 91-95.
36. Van Heuven WJ, Dijkstra T (2010) Language comprehension in the bilingual brain: fMRI and ERP support for psycholinguistic models. Brain Res Rev 64(1): 104-122.
37. Cao F, Peng D, Liu L, Jin Z, Fan N, et al. (2009) Developmental differences of neurocognitive networks for phonological and semantic processing in Chinese word reading. Hum Brain Mapp 30(3): 797-809.
38. Zhao J, Shu H, Zhang L, Wang X, Gong Q, et al. (2008) Cortical competition during language discrimination. Neuroimage 43(3): 624-633.
Submission Link: https://biomedres.us/submit-manuscript.php
Assets of Publishing with us
• Global archiving of articles
• Immediate, unrestricted online access • Rigorous Peer Review Process • Authors Retain Copyrights • Unique DOI for all articles
https://biomedres.us/ This work is licensed under Creative
Commons Attribution 4.0 License
ISSN: 2574-1241
DOI: 10.26717/BJSTR.2019.15.002732