ISSN (Print) : 2320 – 3765 ISSN (Online): 2278 – 8875
I
nternational
J
ournal of
A
dvanced
R
esearch in
E
lectrical,
E
lectronics and
I
nstrumentation
E
ngineering
(An ISO 3297: 2007 Certified Organization)
Website: www.ijareeie.com
Vol. 6, Issue 5, May 2017
Design and Development of Heart Rate and
Temperature Measuring Device Using
MATLAB
Gaurav Kumar1, Km. Shilpa Maurya2, Gargi Goyal3
Assistant Professor, Dept. of ICE, Galgotias College of Engineering & Technology, Greater Noida, U.P., India1 UG Student, Dept.of ICE, Galgotias College of Engineering & Technology, Greater Noida, Uttar Pradesh, India2,3
ABSTRACT: Physicians’ understanding of biosignals as measured with medical instruments becomes the foundation of their decisions and diagnoses of patients, as they rely strongly on what the instruments show. Thus, it is critical and very important to ensure that the instruments’ recordings exactly reflect what is happening in the patient’s body so that the acquired signal is the real one or atleast as close to the real in body signal as possible. The following paper deals with the analysis of PPG (Photo plethysmography) signal to measure heart rate and analysis of resistance change in thermistor for temperature measurement by the means of MATLAB tool effectively. Study of PPG signal include generation of PPG signal, amplification of PPG signal and PPG signal filtering and study of resistance change in thermistor include linearization of the acquired data, measuring the resistance change and interpreting the data. This project is been inspired by the need to find an efficient method for heart rate and temperature analysis which is simple and has good accuracy and less computation time.
.
KEYWORDS: Arduino, Finger plethysmography, Heartrate Measurement, Thermistor, Temperature Measurement, Photoplethysmography (PPG), MATLAB.
I. INTRODUCTION
There are a wide range of parameters which have to be kept in check for the well being of a patient irrespective weather the patient is in hospitals or at home. The basic parameters generally are heart rate, blood oxygen concentration, breathing rate, body temperature. The proper monitoring of these parameters not only requires expensive instruments but also require trained persons to interpret the data show by such instruments. This not only makes the monitoring at home very difficult but also in rural places of India, such machines are impossible to be used due to their requirement of trained person, along with their costly nature & power requirements adds to the worse.
Heart rate is the speed of the heartbeat measured by the number of contractions of the heart per minute. The measurement of body temperature can help detect illness Cardiac activities and temperature are among the most crucial health factors of a human body, and not only it has to be kept under a constant surveillance for critical patients but also should be regularly checked up for monitoring the proper functioning system of the body.
There are wide variety of human heartrate and temperature measuring and monitoring devices available in the market. But these devices are not self intelligent nor do they have any kind of artificial intelligence. Also they can only monitor a single person at a time. The lacking facility efficient alarming system also discourages the lay man to use these machines. In our proposed system the use of optical method of IR transmitters and receivers is done for the measurement of heart rate (finger plethysmography) and use of thermistor for the measurement of temperature.
ISSN (Print) : 2320 – 3765 ISSN (Online): 2278 – 8875
I
nternational
J
ournal of
A
dvanced
R
esearch in
E
lectrical,
E
lectronics and
I
nstrumentation
E
ngineering
(An ISO 3297: 2007 Certified Organization)
Website: www.ijareeie.com
Vol. 6, Issue 5, May 2017
Heart rate measurement is one of the very important parameters of the human cardiovascular system. The heart rate of a healthy adult at rest is around 72 beats per minute (bpm). Athletes normally have lower heart rates than less active people. Babies have a much higher heart rate at around 120 bpm, while older children have heart rates at around 90 bpm. The heart rate rises gradually during exercises and returns slowly to the rest value after exercise. The rate when the pulse returns to normal is an indication of the fitness of the person. Lower than normal heart rates are usually an indication of a condition known as bradycardia, while higher than normal heart rates are known as tachycardia[1] .
Endure athletes often have very low resting heart rates. Heart rate can be measured by measuring one's pulse. Pulse measurement can be achieved by using specialized medical devices, or by merely pressing one's fingers against an artery (typically on the wrist or the neck). It is generally accepted that listening to heartbeats using a stethoscope, a process known as auscultation, is a more accurate method to measure the heart rate. There are many other methods to measure heart rates like Phonocardiogram1 (PCG), ECG, blood pressure wave form and pulse meters but these methods are clinical and expensive[1].
III. PROPOSED METHODOLGY AND DISCUSSION
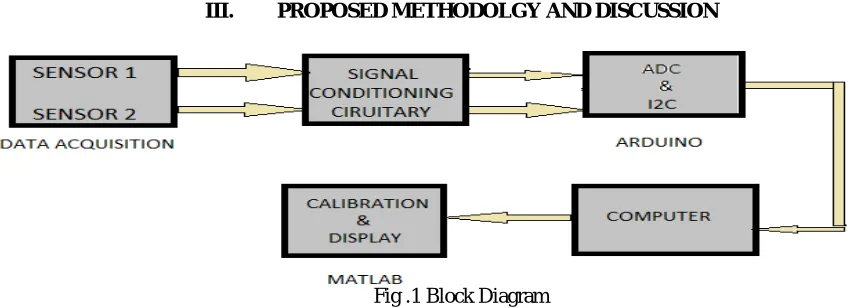
Fig .1 Block Diagram
In figure 1, the Block diagram depicts the whole heart rate and temperature measurement device software and hardware structure whose details are explained below.
IV. BLOCK DIAGRAM
SENSORS
A sensor is an module, or subsystem whose purpose is to detect events or changes in its environment and send the information to other electronics, frequently a computer processor. A sensor is always used with other electronics, whether as simple as a light or as complex as a computer.
A. SENSOR-1 (INFRARED SENSORS)
ISSN (Print) : 2320 – 3765 ISSN (Online): 2278 – 8875
I
nternational
J
ournal of
A
dvanced
R
esearch in
E
lectrical,
E
lectronics and
I
nstrumentation
E
ngineering
(An ISO 3297: 2007 Certified Organization)
Website: www.ijareeie.com
Vol. 6, Issue 5, May 2017
B.SENSOR-2(NTC THERMISTOR)
A thermistor is used for the data acquisition and a thermistor is a type of resistor whose resistance is dependent on temperature, more so than in standard resistors. Thermistors are widely used as temperature sensors (Negative Temperature Coefficient or NTC type typically). With NTC, resistance decreases as temperature rises. The thermistor here used is NTC 103. Range: -55 ~ 150 .
SIGNAL CONDITIONING A. HEART RATE MEASUREMENT
FILTER AND AMPLIFICATION:-
It consist of two units: UNIT 1 & UNIT 2,in which the amplifier is designed by using op-amp GND741 and the filter designed as a RC butterworth filter.
Unit 1: It is used to remove the body noise and range of the filter is non-adjustable. Unit 2: It is used to remove environmental noises and the range of the filter is adjustable.
VOLTAGE FOLLOWER:-
The addition of an additional buffer to the system provides the safety of overloading the circuitry while using to digital converter. It just receives the signal from filtering and amplification unit and sends it to the microcontroller.
B. TEMPERATURE MEASUREMENT
The thermometer unit of this device consists of a thermistor (NTC) as a primary sensing device for the temperature measurement. Linearization of the thermistor done using a resistor (10Kohm). After the linearization readings of the resistance change is taken and from the change of resistance the temperature is inferred using the Steinhart Equation.
MICROCONTROLLER Arduino ATMega 2560 is used for two main purposes in this project.
ADC: To convert the analog data received from the circuit in digital form.
I2C: Communication protocol (It is used to communicate to the computer),so that we can transfer analog signals to computer.
AtMega is connected to the computer through USB.
COMPUTER AND MATLAB
ATMega is connected to the computer through USB. The digital output is used to calculate and display the heart rate and temperature of the subject using the Matlab Software.
The signal is filtered and amplified to obtain a nice and clean PPG waveform, which is synchronous with the heart beat and an alarming system is designed for alert of high and low alerts of temperature.
The heart rate and temperature calculater algorithms are implemented on the raw data and the alarming system are then used as per requirement.
V. HARDWARE
The Heart Rate Detection module:
The heart rate detection is done using the infrared transmitter and receiver which are mounted on a spring loaded clip, which is attached to the subjects figure or ear. In this unit the data is acquired using the IR receiver and transmitter, the heart rate is determined by the variation of the IR energy variation passing through the subjects figure.
ISSN (Print) : 2320 – 3765 ISSN (Online): 2278 – 8875
I
nternational
J
ournal of
A
dvanced
R
esearch in
E
lectrical,
E
lectronics and
I
nstrumentation
E
ngineering
(An ISO 3297: 2007 Certified Organization)
Website: www.ijareeie.com
Vol. 6, Issue 5, May 2017
passing through and being received by the receiver depends upon the hemoglobin content at the site of action .The variation of the energy received by the receiver is used to infer the heart rate of the subject Since the above system is sensitive of external noise due to the power lines and other sources, the signal acquired after this stage need further processing. The above section consist of an passive high pass filter with a cut off frequency of 0.7Hz followed by a active filter with a gain of 100 and the approx. filter cut of frequency is 2.35Hz.Since these filter are not sufficient to remove the low frequency noise the second stage filter are being required. This stage passive filter and an adjustable gain is provides so as to amend the gain of whole module whenever required, this section is followed by an active low pass filter. The addition of an additional buffer to the system provides the safety of overloading the circuitry while using to digital converter. The digital output is used to calculate the heart rate of the subject, which is then displayed on the output device. The heart rate calculater algorithms are implemented on the raw data, and the alarming system are then used as per requirement.
The Temperature Detection Module:
The primary sensing device thermistor decreases its resistance on the increment of the temperature, this property is used and the Steinhart equations are used to indirectly determine the temperature digitally. The thermometer units of this device consist of a thermistor (NTC) as a primary sensing device for the temperature measurement. Linearization of the thermistor is done using a resistor (10Kohm). After the linearization readings of the resistance change is taken and from the change of resistance the temperature is inferred using Steinhart Equation.
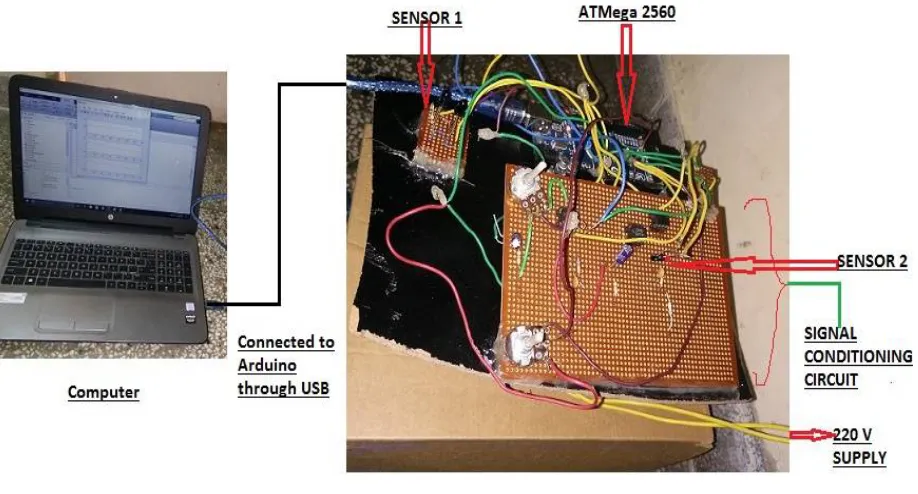
Fig .2 Experimental Setup
ISSN (Print) : 2320 – 3765 ISSN (Online): 2278 – 8875
I
nternational
J
ournal of
A
dvanced
R
esearch in
E
lectrical,
E
lectronics and
I
nstrumentation
E
ngineering
(An ISO 3297: 2007 Certified Organization)
Website: www.ijareeie.com
Vol. 6, Issue 5, May 2017
VI. SOFTWARE
The software’s which have been used are Atmel studio 7.0 and MATLAB. Atmel studio 7.0 which is an open platform software for the programming and burning of the Atmel microcontroller .In the proposed model ATMega 2560 microcontroller have been used solely because of compact size and the low power requirement. MATLAB is used for calibration and display of the unprocessed signal and the filtered signal and the heart rate, the signals are filtered by designing digital filters for low pass and high pass signal filtration. It is also used for calibration of the resistance change in the thermistor and display of the temperature and to give a alarming display of low or high alert of temperature. Matlab is used to display Heart Rate, PPG and temperature with a alert message.
VII. EXPERIMENTAL RESULT
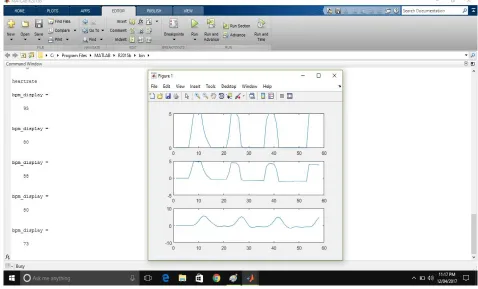
The accurate Photoplethysmograph (PPG) and heart rate and temperature information is one of the vital aspects for the different kinds of heart functioning disorder identification. The work proposed a universal portable, low cost system to acquire PPGs and heart rate and temperature display. The value of the real time heart rate and temperature is displayed in digital format along with the ECG if the system is connected with computer. The Heart rate, unprocessed signal, digital high pass filter result and the actual cardio activity, heart rate, temperature and temperature alert is displayed on the computer using MATLAB.
Fig .3 Display of heart rate module
ISSN (Print) : 2320 – 3765 ISSN (Online): 2278 – 8875
I
nternational
J
ournal of
A
dvanced
R
esearch in
E
lectrical,
E
lectronics and
I
nstrumentation
E
ngineering
(An ISO 3297: 2007 Certified Organization)
Website: www.ijareeie.com
Vol. 6, Issue 5, May 2017
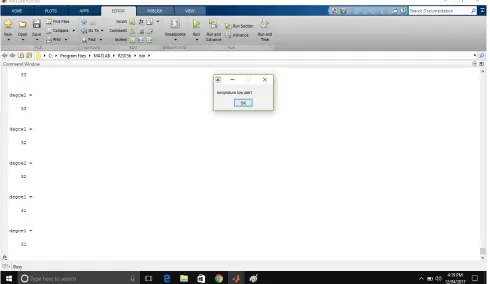
Fig .4 Display of temperature module
In figure , The snapshot of the temperature measurement device result is shown. The result is displayed on personal computer using MATLAB software.It shows the temperature measured using the thermistor and an alert message as low alert temperature for the temperature less than 31Celcius. A similar alert message will be displayed if temperature goes above 39Celcius displaying heart temperature.
VIII. CONCLUSION
There are wide variety of human heart rate measuring and monitoring devices available in the market. But these devices are not self intelligent nor do they have any kind of artificial intelligence. Also they can only monitor a single person at a time. The lacking facitlity efficient alarming system also discourages the lay man to use these machines.
Measuring the real time body temperature of human body is very essential for clinical treatment procedures. The body temperature must always be monitored constantly , use of traditional oral method does not continuously monitor or have any alarming systems availaible. In our system we are using body surface mini thermistor for monitoring the body temperature , & with the help of microcontroller the alarming system is properly generated.
REFERENCES
[1] M.M.A.Hashem, Rushdi Shams, Md. Abdul Kader, and Md. Abu Sayed, “Design and Development of a Heart Rate Measuring Device using Fingertip”, International Conference on Computer and Communication Engineerin,ICCCE2101, Kuala Lumpur, Malaysia ,2010.
[2] G. M. Azmal , A. Al-Jumaily and M. Al-Jaafreh, "Continuous Measurement of Oxygen Saturation Level using Photoplethysmography Signal", biomedical and Pharmaceutical Engineering, 2006. ICBPE 2006.
[3] Yousuf Jawahar, “Design of an Infrared based Blood Oxygen Saturation and Heart Rate Monitoring Device”, McMaster University Hamilton, Ontario, Canada April 10, 2009.
ISSN (Print) : 2320 – 3765 ISSN (Online): 2278 – 8875
I
nternational
J
ournal of
A
dvanced
R
esearch in
E
lectrical,
E
lectronics and
I
nstrumentation
E
ngineering
(An ISO 3297: 2007 Certified Organization)
Website: www.ijareeie.com
Vol. 6, Issue 5, May 2017
[5] Ibrahim D and Buruncuk K.- “Heart Rate Measurement from the Finger Using A Low-Cost Microcontroller”.
[6] Rajashri Patil, Prof.Balaji Hogade, ”On Line Real Time Health Monitoring of ICU Patients using ARM7”, (IJCSN), Volume-1, Issue-3, 2012 [7] S. Edwards. , “Heart rate Monitor Book”, Leisure systems international,Dec. 1993.
[8] M. Malik and A. J. Camm.,“Heart Rate Variability” Futura Publishing Co. Inc., sept 1995. [10] Cromwell and Weibell, “Biomedical Instrumentation and measurements”, PHI.
[11] McGraw Hill, D.C.Readdy, “Biomedical signal Processing”. [12] Willis J. Tompkin, “Biomedical Digital Signal Processing”, PHI [13] Introduction to biomedical Equipment Technology -- Carr Brown
[14] B. Cornish, B. Thomas, and L. C. Ward, “Effect of temperature and sweating on bioimpedance measurements,” Appl. Radiat. Isot., vol. 49, no. 5, pp. 475–476, May/Jun. 1998.
[15] Peter Csordas, Balazs Scherer Development and Applications of A Home Health Monitoring Device, Proc.of International Carpathian Control Conference (ICCC),May 29-31 (2006)
[16] P. S. Hamilton and M. G. Curley, “Adaptive removal of motion artifact,” in Proc. IEEE 19th Annu. Conf. EMBS, vol.1. Nov. 1997, pp. 297–