Initial Data of Digital Correlation ECE with a Giga Hertz Sampling Digitizer
Hayato Tsuchiya1,a, Shigeru Inagaki2,3, Tokihiko Tokuzawa1 and Yoshio Nagayama1
1
National Institute for Fusion Science, Toki 509-5292, Japan
2Research Institute for Applied Mechanics, Kyushu University, Kasuga 816-8580, Japan 3
Itoh Research Center for Plasma Turbulence, Kyushu University, Kasuga 816-8580, Japan
Abstract. The proposed Digital Correlation ECE (DCECE) technique is applied in Large Helical Device. DCECE is realized by the use of the Giga Hertz Sampling Digitizer. The waveform of intermediate frequency band of ECE, whose frequency is several giga hertz, can be discretized and saved directly. The discretized IF data can be used for the analysis of correlation ECE with arbitrary parameter of spatial resolution and temporal resolution. In this paper, the characteristic of DCECE and initial Data in LHD is introduced.
1 Introduction
The ECE is useful for the measurement of electron temperature (Te) fluctuation and Te radial profile in high magnetic field torus plasma, and widely has been used for the study of MHD oscillation. Because the ECE measurement is the passive diagnostic and doesn’t disturb plasma, ECE is expected to catch the turbulence phenomena. The turbulence phenomena are classified roughly in terms of their scale and frequency. The assumed parameter of the meso- and micro-turbulence are summarized in Table 1. The Lc is the scale length and
a is the device size and theiis the ion Lamor radius. Considering of necessary of multi measurement point in scale length, ECE has possibility to catch the mesoscale turbulence. The microscale turbulence would be too small and too fast to catch the oscillation by ECE. However, there is possibility to observe the envelop of amplitude of the micro turbulence.
These turbulence is considered to affect not only the local transport but also global transport. So, experimentally, it is desirable that the mesoscale turbulence and large scale transition phenomena are obtained in parallel.
In this paper, the target phenomenon is the mesoscale turbulence and our purpose is to develop the technique to catch the 100kHz oscillation.
Table 1. Typical parameters of meso- and micro- turbulence
Size(Lc) LHD case Frequency
Meso (a i) ~3cm ~100kHz
Micro i ~2mm ~1MHz?
2 Experimental Setup
2.1 ECE measurement of LHD
The ECE antenna was designed and re-installed in out of torus of LHD on 14th campaign (2010). The sight line of ECE is on the midplane of horizontal elongated cross section. There is a magnetic field peak around the centre of the plasma in helical device. The field of view is limited in outside of tours. The ECH antenna is located at the opposite side of ECE antenna to avoid the effect of the stray light of ECH.
The antenna is consists of four ellipsoidal mirrors. In Fig.1, the antenna in vacuum vessel is shown as M3, M4. To improve the measured microwave intensity, it is desirable to enlarge M4, which faces the plasma.
Figure 1. The ece antenna (M3,M4) in the vacuum vessel. In
!
a
same measurement port, there are devices of Soft-X-ray measument and fast energy particle.
The size of the M4 is determined by the interaction to the neighboring devices. The size of M4 is 27cm in a minor axis, 37cm in major axis. The most strict condition is to pass the port tube whose diameter is 60mm. The concaved M4 is designed by constant phase concept [1] to improve the coupling and light harvesting of gauss beam. The ECE whose spot size is 62 mm can pass though the port tube. The west size depend on the frequency, we guarantee the passing of the 1.5 sigma of Gaussian beam, at least. The gauss beam is matched to the corrugated wave guide behind M1 in the air. The detail is described in the reference [2].
The corrugated wave guide from LHD vacuum port to detectors system in the adjoining room are used (Fig.2). The length of the wave guide is more than 100 meter long. The 20 miter bend are used. The transmission rate of the wave guide system is -2.5dm in actual measured value.
Figure 2 Diagram of the corrugate wave guide system in LHD and the transition rate of antenna system and wave guide.
There are 3 radiometers, which are heterodine systems whose local frequency is 70 GHz, 95 GHz and 135 GHz. 70GHz and 135GHz radiometer system have 32 channels each. (LFS 16ch, HFS 16ch) and the 95GHz radiometer system has 12 channels. The data of each channel is acquired by PXI (national instruments) and we7000 (Yokogawa Meters & Instrument Corp.). The typical sampling rate of them is 1MHz and 100kHz, respectively. The ADC for the if digitizing method is installed to HFS of the 135GHz heterodine systems. The performance is shown in the next section 2.2.2
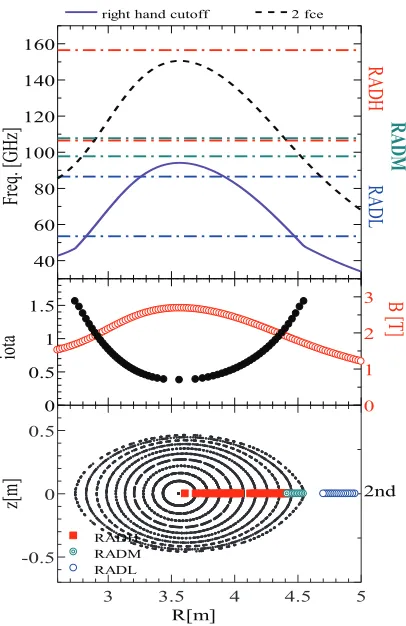
The radial profile of right hand cut off frequency, 2nd harmonics ECE, rotation transform (iota), magnetic field intensity and the viewpoints of radiometers are summarized in Fig.3. The magnetic configuration is high field standard magnetic configuration. In the high field condition, the 135GHz radiomenter shown as RADH is available in the core region, and the 95GHz radiometer shown as RADM is used for the fluctuation measurement in the edge region. The resolution of the IF frequency is 1GHz, that is corresponding to about 2cm spatial resolution. The 95GHz radiometer shown as RADL is used in case of middle filed experiment (Bax ~ 1.5T).
Figure 3 The radial profile of of right hand cut off frequency, 2nd harmonics ECE, rotation transform (iota), magnetic field intensity and the viewpoints of radiometers. The magnetic configuration is Rax = 3.6m, Bax = 2.75T.
2.2 IF digitizing method for DCECE
2.2.1 The concept of digital correlation ECE
The conventional ECE diagnostic using radiometer is the power detection of filtered IF. The conventional system has a demerit of the fixed spatial resolution, because the resolution is determined by the installed IF filter. It is not easy to deal the small phenomena such as unknown size macro turbulence. If we can change the spatial resolution, it will be easy to apply the spatial decorrelation [3]. We propose the digital correlation ECE (DECE) which is combination method of IF band digitizing method and the correlation ECE.
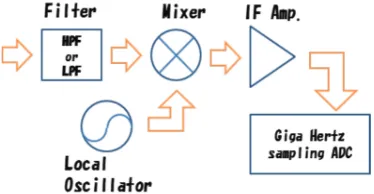
A schematic diagram of the heterodyne radiometer system for IF digitizing method for DCECE is shown in Fig 4. The RF (100-150GHz) is divided into a lower side band (LSB, 100-132GHz) and upper side band (USB, 132-150GHz) by a low/high pass filter. They are down-converted to IF (0-18GHz). Then, the IF wave form itself is saved by a Giga hertz sampling digitizer.
There is the example of applying the IF digitizing method for ECE diagnostics of TEXTOR [4]. The 2nd
IF, which is downconveted by 140GHz and 14GHz local oscillators from 112-158 GHz RF, is directly sampled.
3 3.5 4 4.5 5
-0.5 0 0.5 2nd RADH RADM RADL 0 0.5 1 1.5 0 1 2 3 R[m]
io
ta
B [T
]
z[
m]
40 60 80 100 120 140 160 2 fceRA
D
H
RA
D
L
Fr
eq. [G
H
z]
right hand cutoff
Because they tried to use this method for the real time feedback control, they use the FPGA of FFT and they save the data as Te fluctuation. For DCECE, saving the IF wave form is a key so that the spatial resolution can be change after plasma discharge.
Figure 4. Schematic of the heterodyne system for DCECE. Depending on the condition, it is necessary to install the IF amplifier and band pass filter before ADC.
2.2.2 Giga Hertz digitizer
Recently, ad digitizer sampling at several dozen giga-hertz has been developed commercially, we can see the IF waveform digitally over a sufficient frequency band. IF the sampling frequency is over several gita-hertz, it is also possible to obtain the waveform data continuously as far as the storage limit [5].
For trail of the IF digitizing of ECE from LHD plasma, we used LabMaster 10-36Zi (teledynelocroy) [5]. The spec is shown in Table 2. Data length per a channel is 512 Mbyte in binary. If the maximum sampling rate 80GHz is applied, the data length corresponding to the 6.4ms data length.
Table.2 The spec of Lab Master 10-36Zi
Bandwidth 36GHz.
Sampling rate 80GHz
Acquisition Memory 512Mbyte/ch
Vertical Resolution 8bit
Sensitivity 50 : (5mV-500mV/div)
2.2.3 Analysis procedure of DCECE
The electron temperature fluctuations can be obtained as fluctuation of IF spectra. A block diagram of the analysis and analysis image are shown in Fig. 5. This is the block diagram of analysis. The discretized IF data x(t) is converted to the complex spectra components by FFT, Then we can get the power spectrum. The time window length is corresponding to the time resolution of Te fluctuation data. The IF frequency resolution will be
several Mega Hertz. We have to average the spectrum in frequency domain to remove discretizing error. The frequency band in this procedure is corresponding to the band width (Bif), in conventional filter band system. In
other words, this procedure is corresponding to the band pass filter. So we can change the spatial resolution, if we have the IF wave form as raw data. We can get the multi-channel Te fluctuation as function of IF frequency which
is converted to radial position in plasma devices. After averaging procedure, it is same as the correlation ECE analysis procedure.
Figure 5 Block diagram of DCECE analysis.
2.2.4 sensitivity limit
Because ECE derives from the emission of the black body, we have to take care the thermal noise. It is widely recognized that the noise level can be reduce by correlation analysis. The correlation analysis would be necessary for IF digitizing method because the narrow band is applied to detect small phenomena. The noise level is given by
(1)
where Bvid is the signal bandwidth and BIF is the band
width. The Ns is the number of spectra for correlation
analysis. Because the sensitivity limit is proportional to the forth root of Ns, the increasing Ns is important. Figure 6 shows the relationship between Ns and sensitivity in case of Bif = 50, 100, 200, 300, 500MHz.
Increasing Ns means to make the time resolution (Δt) worse. And, improving the spatial resolution (Δr) (i.e. the narrower Bif) make the sensitivity worse. So this relation
Figure 6. Relationship between number of summation (Ns) and sensitivity.
2.2.4 Characteristic of DCECE
Saving the raw IF waveform leads some merit for the measurement of small phenomena. The most advantage is to choose the spatial and temporal resolution after plasma discharge. And, experimentally, the hardware of detection is more simple than conventional multi filter bank system. But necessary of saving and handling the huge data is a disadvantage point. In case of using IF digitizing for the electron temperature profile measurement, the difficulty of absolute calibration is also a disadvantage point. However, in case of using it for the fluctuation diagnostic, we don’t have to calibrate the intensity.
3 Preliminary data of LHD
The initial IF digitizing radiometer system using 8Gs ADC was constructed and the initial data can be obtained from the LHD plasma [6]. The target plasma is sustained by ECH and NB injection. The typical electron temperature is 4keV and the electron density is more than 1*1018
m-3
. The optical thick is enough large in the observed whole area. Figure 7 shows the example of the
Figure 7. IF spectra calculated by the discretized IF wave form. The red line is a spectrum, and the black line indicates the averaged spectrum.
spectra. The used window length (Nw) for calculation of
IF spectra is 216
. In this condition, we can get 7812 IF spectra. The time resolution (Δt) is 0.8μs. We consider that the effective range of IF spectrum is 1GHz to 18GHz, where is the bandwidth of mixer. Actually the characteristic of the mixer can be seen in the figure.
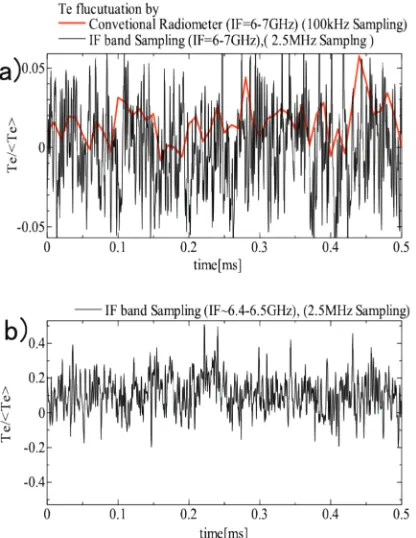
Using the ideal rectangle bandpass filter, we can reconstruct the Te fluctuation. Fig.8 a) shows the reconstructed time-series data of normalized electron temperature using 6-7GHz IF and data of conventional radiometer. The bandwidth is same as one of the conventional radiometer. Both waveforms are roughly consistent. We can obtain the data with narrow filter (Bif=100MHz) at the same time shown as Fig.8 b).
Figure 8 Reconstructed time-series data of normalized electron temperature. a) Bif = 1GHz. b) Bif = 100MHz.
Calculating Te fluctuation data, we can get the power spectra of the each radial channel. Figure 9 shows the power spectra profile in case of Bif = 100MHz and 1GHz.
Because the conventional radiometers bandwidth is 1GHz, we can obtain similar spectra. Using IF digitizing method, we can obtain detail profile of the 160 radial channels data in case of narrow band 100MHz.
Using cross spectrum between neighbor channels, we can reduce the effect of thermal noise. When we do the correlation analysis, it is desirable to calculate correlation with close channel data. And if there are small scale fluctuation, the fluctuation is averaged if band width is wider than the fluctuation scale. We can obtain the averaged cross spectra with various bandwidth parameter, as shown in Fig.10. The number of the averaging is 7, that value is limited by the memory size of ADC (see detail parameter study in ref.6.).
We can see the detail structure in case of using narrow band. The correlation
1 10 100 1000
0 2 4 6
Ns
sensitivity limit [%
]
Bif=50MHzFigure 9 Power spectra profile with Bif =100MHz and
1GHz.
4. Summary and Future work
The concept of DCECE measurement is proposed for mesoscale phenomena and the trial of application in LHD is introduced. DCECE is based on digitizing the IF band and analysing spatial correlations in ECE analysis. The greatest merit is to choose the spatial and temporal resolution when we analysis. In the initial data in LHD, we can see the detail cross power spectra, however, we need more detail validation of the small fluctuations, for example, the derivation of correlation length is a key to discuss the mesoscale turbulence.
There are still tasks remaining. The handling of large amount IF data by the common computing is not easy. The installing of the specialized computer for parallel computing is necessary. The 8bit resolution of ADC will be also problem for guarantee the IF spectra including low fluctuation level.
Figure 10 averaged cross spectra with Bif = 100Mz, 200MHz, 500MHz, 1GHz.
References
1. S. Kubo et al., Plasma Phys. 23, 1127 (1981). 2. H. Tsuchiya et al., Plasma Fusion Res. 6, 2402114
(2011).
3. C. Watts, Fusion Sci Tech. 52, 176 (2007).
4. W. A. Bongers et al., Rev. Sci. Instrum. 82, 063508 (2011).
5. http://teledynelecroy.com