1266 | P a g e
Determination of Suitable Landfill Site Using
Geospatial Techniques: A Case study
of Vasai-Virar City
Ms. Priyanka S. Deshmukh
1, Prof. Upendra R. Saharkar
21
P.G Student, Department of Civil Engineering, D.Y. Patil Institute of Engineering and Technology,
Ambi, Pune, Savitaribai Phule Pune University
2
Head of Department of Civil Engineering, D.Y. Patil Institute of Engineering and Technology, Ambi,
Pune, Savitaribai Phule Pune University
ABSTRACT
Now-a-days, as rate of generation of waste increases hence solid waste management becomes challenge for city
authorities in developing country, the burden posed on the municipal budget as a result of the high costs
associated to its management, the lack of understanding over a multiplicity of factors that affect the different
stages of waste management and associations necessary to permit the entire handling system functioning. This
study represents solution for disposal of solid waste in Vasai- Virar city in forthcoming future by signifying one
potential landfill location. Our results show that 6.25% of the territory of Vasai-Virar is unsuitable for regional
landfill siting. The most suitable areas cover 37.49%, suitable areas 37.49%, while areas with low and very low
suitability cover 18.75 and 6.25% of the territory, respectively. Based on these findings, two sites close to two
large urban groups were suggested as possible locations for a regional landfill site in Vasai-Virar. Ten factors
selected as criteria/sub-criteria were recognized as most important divided into geo-natural environmental,
social, & techno-economic factors. Spatial layers were overlaid into a landfill suitability map. Criteria were
mapped using the GIS system and spatial analytic tools.
Keywords: Landfill, Geographic Information System, solid waste management, overlay analysis.
I. INTRODUCTION
The practice of solid waste management in Vasai-Virar is mainly open dump system with only one designated
site popularly known as Gokhiware site. The disposal ground started off as a tipping site in 2001 without
provision of daily/frequent covering of disposed wastes.Vasai-Virar city is the fifth largest urban city in kokan
region with an estimated population growth rate of 16% per year with waste generation rates of approximately
500 tons/day of which 45% is disposed off to at dumpsite,27 % of the total wastes is recycled or recovered by
informal sectors and the remaining 30% is left unattended to and finally deposited to the surrounding
environment by storm water and wind.
The Geographical Information System (GIS) offers reasonabledevice since many aspects such as planning and
1267 | P a g e
also provides digital database management system that is ideal for advanced site selection that can efficiently
store, retrieve, analyze and display information according to user defined specifications.
The process of solid waste disposal management consists of collection, transportation and disposal. One way to
dispose solid waste is to place it in properly designed, constructed, and managed landfills, where it is safely
contained. Nevertheless, the selection of a suitable site for solid waste disposal is a daunting task, complex
spatial problem, involving multiple criteria which require the use of spatial analysis models.
The present study focuses on an optimized landfill site selection which based on different parameters and
geographic information system based overlay analysis. The most appropriate site has been identified for Vasai-
Virar city by considering various influential parameters and factors to arrive at optimum siting decision. Factors
including geology, air quality, soil types and its different properties, surface water ground water depth & its
quality, slope and elevation, land use land cover etc. based on this all ten factors thematic maps were prepared
within the paradigm of GIS software. A GIS-based overlay analysis was performed to identify the optimum site
for the landfill, one which fulfilled all of the desired attributes.
II. MATERIALS & METHODS
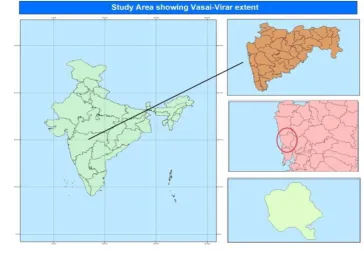
2.1 Study Area
Vasai-Virar city is located between latitude 19o23’34’’N and longitude of 72o51’42’’ E. This city is located in
Palghar district surrounded by 67 villages such as Sativali, Chincholi, Rajiwali, Kolhi etc. it is surrounded by
Vasai creek, Arabian sea, Vaitarna river, Achole lake etc. Its west is the Arabian Sea. Vaitarna river separates
Vasai Taluka from PalgharTaluka . On the north side and on the south it is separated from Thane main land by
the Vasai creek. Vasai-Virar is Tehsil of Kokan division comprising most populated part of Palghar District and
5TH largest city in Maharashtra. This City has been separated from Greater Mumbai and Mira-Bhayandar City
because of presence of Vasai Creek part of estuary of Ulhasriver.
1268 | P a g e 2.2 Methodology
The study depend on the existing soil data, geology/lithology data, road and rail network data, hydrology data
such as underground water depth and its quality and city shape file. Some data was extracted from LANDSAT 8
OLI 30 (m) resolution image to determine land use/ land cover maps of the study area. All the above data were
collected from different departments, manipulated and analyzed in GIS environment to be used for further
analysis.
Suitable criteria for landfill site selection in Vasai-Virar were generated based on pre-existing information
published on landfill criteria, existing environmental laws and regulatory requirements, as well as the prevailing
local conditions. Ten important criteria were identified protected areas, distance to streams and water bodies,
distance from transportation routes, underlying soil structure and geology and geological structures of the study
area, air quality index, surface water and underground water parameters etc.
Digital Elevation Model (DEM 30*30m resolution) was used to derive slope. GIS buffering and Euclidean
process were used to screen out unsuitable areas based on the defined criteria. All the constraint criterion maps
were overlaid to produce the final key map. Acceptable areas were extracted from constraint maps and classified
into classes of most suitable, suitable, unsuitableand moderately suitable for being used as site locations.
2.3 Criteria Used in the Analysis
Land use/land cover:
Land use/ land cover of the study area was mapped from satellite image LANDSAT 8 OLI. Image classification
was done to categorize the image to different classes through supervised classification. General land cover of the
area was derived and five land cover classes were identified namely: water-body, built-up, barren-land, forest,
mixed vegetation, vegetation and saltpans. Solid waste disposal site should not be placed too close to settlement
areas and recreation centers. Land use types such as grassland, forests, agricultural land, wet land, bush lands
would be considered and assigned an appropriate index of land use suitability.
Slope and elevation: Slope is one of the key criteria in landfill siting because it can reduce or increase stability
of landfills. DEM was used to derive slope and elevation. Figure 5 shows the slope suitability indicating 20% of
the study area as a steep/high slope >30%. A steep slope is neither recommended due to difficulty in
construction and/or leveling. In general, steeper slopes have less soil development, high erosion rates, shallow
depths, and courser texture. Therefore, areas of lower slope were best considered than the areas with higher
slope. For this study a slope of less than 12% was most suitable.
Air quality, underground water depth, soil type: These three types of data were collected from different
departments. According to data provided, the maps were generated from the data by geocoding the location
along with its value like air quality index value, depth value and soil type value. And then creating points from
the geocoded value to create map and use for criteria analysis.
2.4 Euclidean Process (Buffering Analysis)
Euclidean distance is calculated from the center of the source cell to the center of each of the surrounding cells.
True Euclidean distance is calculated in each of the distance tools. Conceptually, the Euclidean algorithm works
1269 | P a g e
x_max and y_max as the other two legs of the triangle. This calculation derives the true Euclidean distance,
rather than the cell distance. The shortest distance to a source is determined, and if it is less than the specified
maximum distance, the value is assigned to the cell location on the output raster.
The Euclidean tool is present under Spatial Analyst tool ->Distance tool -> Euclidean distance in ArcMap. Here
the buffering takes place according to the distance calculated from the tool to the nearest cell value of the
feature. The buffering value is calculated automatically and assigned within a range. This buffering value is
taken for further processing. The Euclidean distance output raster contains the measured distance from every
cell to the nearest source. Alternatively, this tool can be used when creating a suitability map, when data
representing the distance from a certain object is needed.
Below description uses the method of euclidean distance which are protected areas, rail neywork and residential
areas.
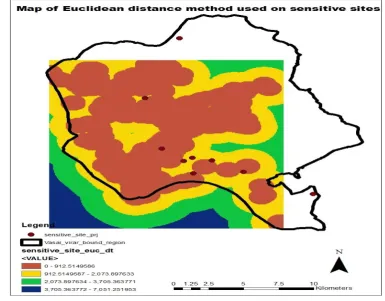
2.4.1 Distance from protected areas (sensitive sites), residential and railway network
Distance from protected areas (sensitive sites): A landfill must not be located in close proximity to sensitive
areas or protected areas and areas gazette for special protection. Figure shows proximity map with buffering
distances prepared to identify most preferable site for a landfill. Euclidean distance was used to delineate
exclusionary areas from the siting process.
The ranges where approximately calculated from 0-900 m, 900-2000 m, 2000-4000 m and 4000-7000 m Areas
further away from the protected areas were most preferred as opposed to those nearer these areas. A distance
greater than 2000m and above was considered suitable for this study.
1270 | P a g e 2.4.2 Distance from rail network and residential area:
Euclidean distance for railway network was used to delineate exclusionary areas from the siting process.
The ranges where approximately calculated from 0-2500 m, 2500-5500 m, 5500-8500 m and 8500-11500 m
Areas further away from the protected areas were most preferred as opposed to those nearer these areas. A
distance greater than 8500m and above was considered suitable for this study.
And for residential area, the ranges where approximately calculated from 0-1750 m, 1750-3500 m, 3500-5500 m
and 5500-7500 m Areas further away from the protected areas were most preferred as opposed to those nearer
these areas. A distance greater than 3500m and above was considered suitable for this study.
Fig.No. 3 Map of Euclidean distance method used on railway network.
Fig.No.4 Map of Euclidean distance method used on residential layer.
Distance from roads: Landfill location must be close to roads network for accessibility and ease of
transportation, consequently reducing relative costs. Minimum and maximum distance from road network for
1271 | P a g e
located within a 1 km buffer from the roads and other transportation facilities. For this study Roads are
segregated into different five categories which are highways, major roads, minor roads, street roads and other
roads. These roads are merged together in MapInfo Professional software. Highways are given 1000 m
buffering, major roads are given 700m buffering, minor roads are given 500m buffering, street roads are given
300m buffering and other roads are given 100m buffering.
Fig.No.5 Multiple buffers to allocate exclusionary areas.
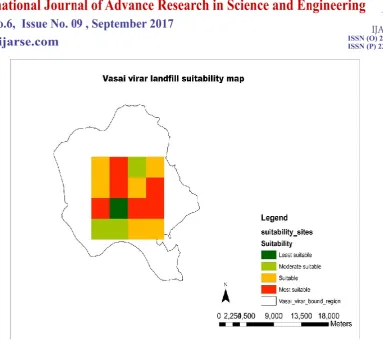
III. RESULTS AND DISCUSSIONS
In site suitability methodology, every layer has been reclassified according to their parameters using reclassify
tool in Spatial Analyst tool of ArcMap. Ten layers were considered like LULC layer, sensitive site buffer layer,
road buffer layer, rail line buffer layer, soil layer, water depth layer, residential buffer layer, slope layer, contour
layer and air quality layer.
In ArcMap, we reclassify according to the criteria set as very low, low, moderate and high or according to their
values as 1 for low and high or suitable as 4, for the layers or criteria’s considered. The layers like LULC, road
buffer, rail line buffer, Slope, Contour, residential buffer, sensitive site buffer, air quality layer, soil data layer
and ground water depth layer are considered for site suitability which is overlaid all together according to their
categories in raster calculator under Spatial Analyst tool which adds all the layer and gives overall analysis
raster which would be consisting of 4 classes which would be reclassified according as poorly suitable as least
followed by moderately suitable, suitable and most suitable as higher category class which would be considered
for landfill sitting suitability in near future. The area calculation of suggested candidate sites by GIS was done in
the attribute table of the feature. It was calculated in hectares. By interpretation of the area values, the most
suitable area has the value of 5037.57 hectares. Finally location in kolhi or around Chincholi area was selected
1272 | P a g e Fig. No. 6 Map of potential landfill sites
IV. CONCLUSION
Landfill site selection is a complex procedure which involves evaluating numerous factors like regulations,
environmental, socio-cultural, engineering and economic factors. Using GIS for locating landfill sites is an
economical and practical way as they have capabilities of producing useful, high quality maps for landfill site
selection in a short period of time. During the studies, it is proved that GIS is a powerful tool in handling large
amounts of data and narrowing areas of interest for potential landfill sites. Final suitability map was created
showing 6 candidate sites, in Vasai-Virar city kolhi was found as potential landfill location.
V. ACKNOWLEDGEMENT
Authors would like to thank Department of town planning and solid waste management of Vasai- Virar City
Municipal Corporation for providing relevant information particularly Mr. Sanjay Jagtap
REFERENCES
[1] Tamara ZelenovicVasiljevic, ZoricaSrdjevic (2011) GIS and the Analytic Hierarchy Process for Regional
Landfill Site Selection in Transitional Countries: A Case Study From Serbia Environmental Management
(2012) 49:445–458
[2] M. IrfanYesilnacara, M. LutfiSuzen (2012)Municipal solid waste landfill site selection for the city of
Sanliurfa-Turkey: an example using MCDA integrated with GIS International Journal of Digital Earth, Vol.
1273 | P a g e
[3] BasakSener (2004) Landfill site Selection by using Geographic Information system
[4] Jess W. Everett (1996) Landfill siting using geographic information system: A demonstration journal of
Environmental engineering
[5] Wang Guiqina, Qin Lib (2009) Landfill site selection using spatial information technologies and AHP: A
case study in Beijing, China journal of environmental Management Elsevier 90 (2009) 2414–2421.
[6] Emilio Morelio(2008) Evaluation of a municipal landfill site in Southern Spain with GIS-aided
methodology , journal of hazardous material Elsevier
[7] NadaliAlavi (2012) Municipal solid waste landfill site selection with geographic information systems
andanalytical hierarchy process: a case study in Mahshahr County, Iran Waste Management and Research
31(1) 98–105
[8] JacekMalczewski (2004) GIS-based land-use suitability analysis: a critical overview, Progress in Planning
62 (2004) 3–65.
[9] O.E. Demesouka,(2013) Suitability analysis for siting MSW landfills and its multicriteria spatial decision
support system: Method, implementation and case study, Waste Management 33 (2013) 1190–1206.
[10] Katerina R. Donevska (2011) Integrating multi-criteria evaluation techniques with geographic information
systems for landfill site selection: A case study using ordered weighted average ,Waste Management 32
(2012) 287–296.
[11] SarikaRathi (2005) Alternative approaches for better municipal solid waste management in Mumbai, India,
Waste Management 26 (2006) 1192–1200.
[12] Solomon Peter Gbanie (2012) Modelling landfill location using Geographic Information Systems (GIS) and
Multi-Criteria Decision Analysis (MCDA): Case study Bo, Southern Sierra Leone, Applied Geography xxx
(2012) 1-10.
[13] Mehdi Rezaeimahmoudi (2014) Application of geographical information system in disposal site selection
for hazardous wastes, journal of environmental health science & engineering.
[14] Fides K. Kirimi& Edward H. Waithaka (2014) Determination of Suitable Landfill Site Using Geospatial